INTRODUCTION
The role of corridors and stopovers for birds that migrate entirely within the tropics may differ fundamentally from that of migrants originating in temperate zones (Boyle Reference BOYLE2010). Migration is a widespread adaptive response throughout bird taxa to exploit the availability of ephemeral resources (Alerstam et al. Reference ALERSTAM, HAKE and KJELLÉN2006, Boyle & Conway Reference BOYLE and CONWAY2007, Pulido Reference PULIDO2007). While latitudinal migrations characterize many temperate-zone birds, short-distance altitudinal migration is common among tropical species (Ornelas & Arizmendi Reference ORNELAS, ARIZMENDI, Wilson and Sader1995, Stiles Reference STILES, Alameda and Pringle1988). Underlying drivers of intratropical altitudinal migration differ from latitudinal migration and may include predation, parasites or storms in addition to resource availability (Boyle Reference BOYLE2008, 2010; Boyle et al. Reference BOYLE, NORRIS and GUGIELMO2010, Loiselle & Blake Reference LOISELLE and BLAKE1991). Although the diversity of habitats tropical bird species encounter across relatively short-distance altitudinal migrations can be as dramatic as those of latitudinal migrants (Chesser Reference CHESSER1994), the role of stopovers may differ according to drivers of migration and landscape connectivity.
The functional connectivity of migration routes is dependent on the landscape matrix and vagility of different species; birds are able to fly over unsuitable habitat patches, whereas non-volant animals may need contiguous suitable habitat to complete migration (Bennett Reference BENNETT2003, Berger et al. Reference BERGER, CAIN and BERGER2006, Uezu et al. Reference UEZU, METZGER and VIELLIARD2005). Refuelling at stopovers within corridors is often essential during the course of migration, requiring more stopovers to complete longer-distance migrations (Sawyer & Kauffman Reference SAWYER and KAUFFMAN2011). Latitudinal migrants may select stopovers for a variety of reasons, including forage quality and density, water resources, weather conditions and predator densities (Batbayar et al. Reference BATBAYAR, TAKEKAWA, NEWMAN, PROSSER, NATSAGJORJ and XIAO2011, Dingle & Drake Reference DINGLE and DRAKE2007, Weber et al. Reference WEBER, ENS and HOUSTON1998). Although stopover ecology is a prominent area of avian research (Bonter et al. Reference BONTER, GAUTHREAUX and DONOVAN2008, Erni et al. Reference ERNI, LIECHTI and BRUDERER2002, Newton Reference NEWTON2008), the role of stopovers has been studied in few other intratropical migrants and is little known in island species (Davenport et al. Reference DAVENPORT, NOLE BAZÁN and CARLOS ERAZO2012, Powell & Bjork Reference POWELL and BJORK2004).
Our objective was to quantify how population-level patterns of altitudinal migration in an insular tropical bird, the endangered Hawaiian goose or nene (Branta sandvicensis Vigors), differ from temperate zone ancestors and other intratropical altitudinal migrant birds. Although probable migration routes have been identified, the spatial extent of corridors, use of stopovers and habitat preferences during migration have not been investigated (Hess et al. Reference HESS, LEOPOLD, MISAJON, HU and JEFFREY2012). We hypothesized that: (1) nene subpopulations use common, well-defined corridors and stopovers during altitudinal migration that lie within its historical geographic range prior to severe population decline; (2) the nene makes longer-duration migrations with more stopovers en route to non-breeding areas than in return to breeding areas as do other goose species; (3) habitat use during migration is similar to the non-breeding period; (4) migration distance and the number of stopovers are related as in other migratory animals; and (5) stopovers occur along unidirectional movements. Hypotheses 4 and 5 would both indicate that refuelling en route is necessary to complete migration. We used Brownian bridge utilization distribution (BBUD) models to characterize migration corridors, stopovers and habitat preferences during migration and shorter-distance movements (Bullard Reference BULLARD1999, Prosser et al. Reference PROSSER, CUI, TAKEKAWA, TANG, HOU, COLLINS, PAN, HILL, LI, LI, LEI, GUO, XING, HE, ZHOU, DOUGLAS, PERRY and NEWMAN2011, Sawyer & Kauffman Reference SAWYER and KAUFFMAN2011, Sawyer et al. Reference SAWYER, KAUFFMAN, NIELSON and HORNE2009). We also used measures of displacement to independently define stopovers and analyse temporal patterns in movement (Bunnefeld et al. Reference BUNNEFELD, BÖRGER, VAN MOORTER, ROLANDSEN, DETTKI, SOLBERG and ERICSSON2011, Kareiva & Shigesada Reference KAREIVA and SHIGESADA1983, van Wijk et al. Reference VAN WIJK, KOLZSCH, KRUCKENBERG, EBBINGE, MUSKENS and NOLET2011).
METHODS
Study species and area
The movements of nene are opposite in direction and timing of most other intratropical altitudinal migrants which typically move from higher-elevation breeding ranges to lower-elevation non-breeding ranges (Boyle Reference BOYLE2010, Hobson et al. Reference HOBSON, WASSENAAR, MILÁ, LOVETTE, DINGLE and SMITH2003, Johnson & Maclean Reference JOHNSON and MACLEAN1994, Ornelas & Arizmendi Reference ORNELAS, ARIZMENDI, Wilson and Sader1995). Although the seasonal timing of nene migration roughly corresponds to that of the Canada goose (Branta canadensis Linnaeus) from which nene evolved ~1 Mya (Paxinos et al. Reference PAXINOS, JAMES, OLSON, SORENSON, JACKSON and FLEISCHER2002), altitudinal migration is not known in the Canada goose (Mowbray et al. Reference MOWBRAY, ELY, SEDINGER, TROST, Poole and Gill2002). The nene breeds and moults at lower-elevation areas during September to April, and then migrates to higher-elevation areas during the non-breeding season, but with substantial individual variation (Banko et al. Reference BANKO, BLACK, BANKO, Poole and Gill1999, Hess et al. Reference HESS, LEOPOLD, MISAJON, HU and JEFFREY2012).
We studied the nene from two breeding sites on Hawai‘i Island: Big Island Country Club golf course (BICC; 625–665 m asl) and Hakalau Forest National Wildlife Refuge (Hakalau; 995–2030 m asl). These two subpopulations were re-established after 1991 and 1996, respectively, but were isolated from each other until traditional seasonal movement patterns became re-established coincident with steady recovery from near-extinction (Henshaw Reference HENSHAW1902, Hess Reference HESS2011, Perkins Reference PERKINS and Sharp1903, Smith Reference SMITH1952, USDI 2004). Both subpopulations move seasonally to the Kahuku Unit of Hawai‘i Volcanoes National Park (Kahuku; 585–3885 m asl) (Hess et al. Reference HESS, LEOPOLD, MISAJON, HU and JEFFREY2012). Predominant ground cover at BICC was non-native grass (Cenchrus clandestinus (Hochst. ex Chiov.) Morrone). Higher-elevation shrubland at Kahuku was dominated by native species including Leptecophylla tameiameia (Cham. & Schltdl.) C. M. Weiller and Vaccinium reticulatum Sm. with sparse ground cover of the native grass Deschampsia nubigena Hillebr. and large areas of recent lava flows with sparse vegetation (Hess et al. Reference HESS, LEOPOLD, MISAJON, HU and JEFFREY2012, Leopold & Hess Reference LEOPOLD and HESS2013). Modified areas included water features and turf mowed for recreational sports primarily at BICC. Hakalau was formerly a densely forested environment unsuitable for nene, but large areas were converted to several species of non-native pasture grasses.
Satellite telemetry
We outfitted six male nene in 2010 and 2011 with 45-g solar-powered platform transmitter terminals (PTTs) equipped with global positioning system (GPS) capability (Microwave Telemetry, Columbia, MD). PTTs measured 57 × 30 × 20 mm and were attached dorsally with a double-threaded backpack harness made of Teflon® ribbon (Bally Ribbon Mills, Bally, PA). Capture, handling and transmitter attachment procedures were approved by University of Hawai‘i IACUC Protocol 08–636. Transmitter packages weighed ≤ 3% of each bird's mass. PTT units were fitted only on males to reduce potential interference with breeding and because mates are generally monogamous and migrate together. Candidates for PTTs must have nested at Hakalau or BICC, been observed at Kahuku, but were not related or members of the same social group. All PTTs were programmed to record GPS coordinates at 00h00, 10h00, 14h00 and 19h00 HST to capture movements from midday to evening and nightly roosts. Data were retrieved every 3 d (CLS America Inc., Largo, MD). We conducted stationary trials for PTTs prior to deployment and found 95% of GPS coordinates were horizontally accurate ±15 m.
We defined a migration event as the departure and return of an individual to a breeding site, and included 5 d of location data before and after each migration event. If 5 d of data comprised >50% of locations, data from breeding grounds were reduced to 50% of locations per migration event to limit weighting of BBUDs at terminal destinations. We included all available data in cases where transmitters ceased functioning before an individual returned to its breeding grounds. We also examined shorter-duration movement events defined as the departure from a site and arrival at the same site or another within a season. For analysis, we included data from a 24-h period prior to departure, all data collected while in transit, and 24 h after reaching a destination. We used migration events to address hypothesis 1 and movement events to address hypotheses 4 and 5.
Movement modelling
We created BBUDs for each migration event using the ADEhabitatHR package (version 0.3.4) in program R (R Development Core Team, v. 2.12.2) to determine migration corridors. We used a 15-m location error to correspond with the error radius of GPS coordinate data, and a grid cell size of 100 × 100 m to generate BBUDs. We generated discrete BBUDs at 2.5% intervals ranging from 5–99% to create high-precision BBUD polygons for each migration event. All areas outside of each 99% BBUD were assigned a dummy category value. We used linear regression to determine if the number of locations was related to the area or natural logarithm of area for 95%, 75%, 50% and 25% BBUDs. BBUD polygon data were imported into ArcMap v. 10 (ESRI, Redlands, CA) and converted to raster datasets with 30 × 30-m resolution. We averaged each subject's BBUDs and averaged BBUDs among subjects from each breeding area (BICC, n = 4; Hakalau, n = 2) to make inferences at the subpopulation level. We also averaged among all subjects to make inferences at the population level (n = 6). To simplify interpretation of averaged BBUDs, we rescaled categories by quartiles in the same manner as Sawyer et al. (Reference SAWYER, KAUFFMAN, NIELSON and HORNE2009): highest use (≤25%), moderate–high use (>25–50%), low-moderate use (>50–75%), and lowest use (>75–99%).
We created BBUDs for each movement event and converted polygon data to raster datasets as described above. We used linear regression to determine if the number of locations was related to the area or natural logarithm of area for 95%, 50% and 25% BBUDs. In six cases, 95% BBUDs were clipped to the shoreline of Hawai‘i Island because they exceeded the geographic range of nene. We defined stopovers as 25% BBUDs occurring outside breeding and non-breeding areas for each subject (Sawyer et al. Reference SAWYER, KAUFFMAN, NIELSON and HORNE2009). We overlaid 25% BBUDs and summed values among all movement events to identify frequently used stopovers. We compared the locations of current migration corridors, stopovers and non-breeding areas to the historic geographic range of nene from observations made prior to 1944 (Baldwin Reference BALDWIN1945).
We used displacement thresholds to independently identify stopover sites (van Wijk et al. Reference VAN WIJK, KOLZSCH, KRUCKENBERG, EBBINGE, MUSKENS and NOLET2011). We defined a displacement threshold as a cluster of consecutive locations within 10 km from the previous location and occurring >10 km from breeding or non-breeding sites. Stopover coordinates were defined as the mean latitude and longitude of each cluster. We used Mann–Whitney tests to determine if number of stopovers differed between BBUDs and our displacement criteria. We also used a Mann–Whitney test to evaluate whether the number of stopovers differed between migrations to and from breeding and non-breeding sites. We used linear regression to determine if there was a relationship between the total distance travelled during movement events and the number of stopovers used en route to non-breeding areas, during return to breeding areas, in movements between other areas, and in all combined movement events. We also used net squared displacement (NSD) values from BBUD migration event output to examine directionality through time during migration (Bunnefeld et al. Reference BUNNEFELD, BÖRGER, VAN MOORTER, ROLANDSEN, DETTKI, SOLBERG and ERICSSON2011, Kareiva & Shigesada Reference KAREIVA and SHIGESADA1983). We presented the expected squared distance, rather than linear distance, which increases linearly with time (Börger et al. Reference BÖRGER, DALZIEL and FRYXELL2008).
We used Hawai‘i Gap Analysis data (http://gis1.usgs.gov/csas/gap/viewer/land_cover/Map.aspx) classified at 30 × 30-m resolution with land-cover categories modified as per Leopold & Hess (2013) to determine habitat characteristics at stopovers. We also assessed the proportion of land-cover types within BBUDs of stopover and non-breeding sites and compared values relative to land-cover availability within study sites and Hawai‘i Island overall. Only habitats within the documented altitudinal range of ≤2760 m were included in analyses (Hess et al. Reference HESS, LEOPOLD, MISAJON, HU and JEFFREY2012).
RESULTS
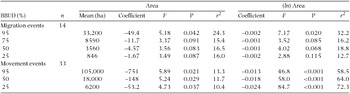
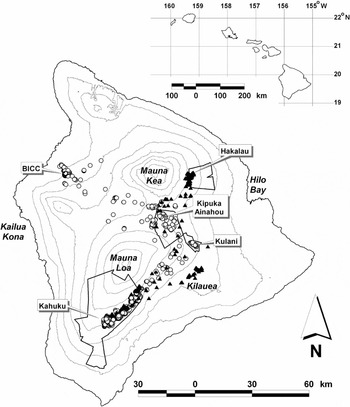
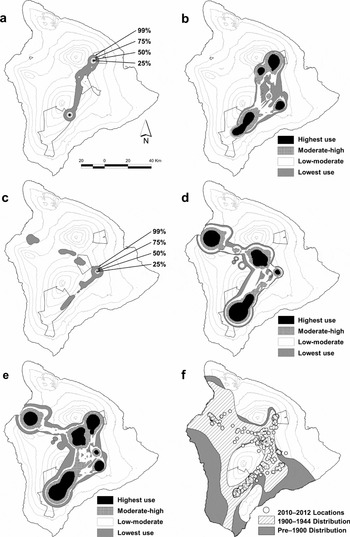
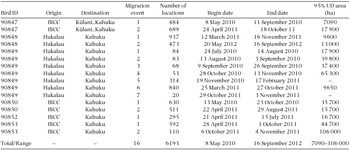
Data from six nene with PTT units during 2010–2012 provided a GPS coordinate fix rate of 95%. A total of 6193 GPS coordinates were used to estimate BBUDs for 16 migration events, although only 14 were suitable for analysis (Figure 1; Appendix 1). Estimated 95% BBUDs ranged in area between 7095–106349 ha. The area of 75%, 50% and 25% BBUD estimates were not related to numbers of locations, indicating sufficient sample size. However, 95% BBUDs were negatively related to numbers of locations, indicating that sample sizes were not sufficient for determining precise BBUD size (Table 1). The 5 d of origin and destination data that we used to define each migration event likely affected this relationship, particularly for BBUDs with fewer locations en route. Highest-use areas were identified at breeding sites of Hakalau (Figure 2a, b) and BICC (Figure 2c, d), at Kīpuka ‘Ainahou Nene Sanctuary (Kīpuka ‘Ainahou; 2000 m asl), a nearby reservoir on Mauna Kea (2188 m asl), and at non-breeding areas of Kahuku and Kūlani Correctional Facility (Kūlani; 1580 m asl; Figure 2e). A corridor of moderate to high use occurred between both breeding sites and Kīpuka ‘Ainahou, then merged and extended to Kahuku (Figure 2e). Three nene subjects flew directly from non-breeding to breeding sites on four occasions and one subject completed four migration events during 2010. Approximately 11.8% of satellite telemetry locations occurred outside of the reported pre-1900 distribution of nene (Figure 2f). We found no evidence for migration corridors in the former range of leeward Mauna Loa and Hualālai volcanoes (Baldwin Reference BALDWIN1945; Figures 2e, f).
Relationship between area of Brownian bridge utilization distributions (BBUDs) and number of locations during migration (n = 6193) and movement (n = 1552) events of six nene (Branta sandvicensis) individuals on Hawai‘i Island, 2010–2012.

Five areas on Hawai‘i Island used by nene (Branta sandvicensis) during migrations in 2010–2012. Breeding areas were at Hakalau Forest NWR (Hakalau; black triangles) and Big Island Country Club (BICC) golf course (white circles); non-breeding areas included Kīpuka ‘Ainahou Nene Sanctuary (Kīpuka ‘Ainahou), Kūlani Correctional Facility (Kūlani), and the Kahuku unit of Hawai‘i Volcanoes National Park (Kahuku). Total n = 6193 locations from satellite telemetry. Elevation contours are at 500-m intervals.

Migration corridors of nene (Branta sandvicensis) on Hawai‘i Island 2010–2012 based on Brownian bridge utilization distributions (BBUD). A BBUD was generated for each migration event from nene breeding at Hakalau (a) and averaged (n = 7) across two study subjects (b). A BBUD was generated for each migration event from nene breeding at BICC (c) and averaged (n = 7) across four study subjects (d). BBUDs of all migration events were averaged across six study subjects (e). All telemetry locations from 2010–2012 were overlaid on the historical distribution of nene prior to 1944 (f).

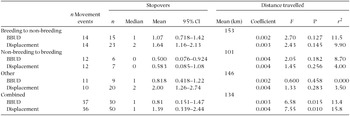
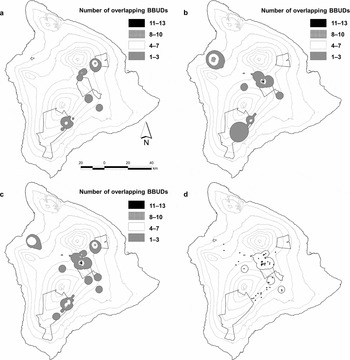
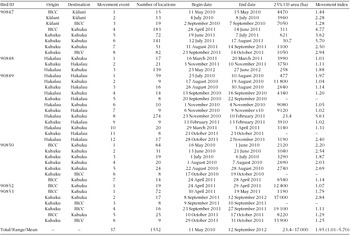
A total of 1552 GPS coordinates were used to estimate 25% BBUDs from 37 movement events, although only 33 were suitable for analysis. Estimated 95% BBUDs ranged in area 23.4–37010 ha (Appendix 2). The number of locations included in movement events ranged from 8–274, although the event with 274 locations was due to the use of an alternative breeding site that was not within any study area. The area of 95%, 50% and 25% BBUDs were negatively related to numbers of locations, indicating that sample sizes were not sufficient for determining the precise area of BBUDs (Table 1). Highest-use areas were identified at breeding sites of Hakalau (Figure 3a) and BICC (Figure 3b). The sum of all 25% BBUDs from movement events contained 30 stopovers between Mauna Kea and Mauna Loa, including a reservoir on Mauna Kea and a large area at Kīpuka ‘Ainahou (Table 2; Figure 3c).
Relationship between number of stopovers and total distance travelled during movement events of six nene (Branta sandvicensis) individuals on Hawai‘i Island, 2010–2012 determined by Brownian bridge utilization distributions (BBUDs) and displacement threshold criteria. The number of stopovers during movements from breeding to non-breeding areas did not differ between BBUD and displacement criteria (Mann–Whitney test W = 242, P ≤0.057); movements from non-breeding to breeding areas also did not differ (W = 153, P >0.090); however, stopovers during all other movements differed (W = 145, P < 0.011).

Stopover sites of nene (Branta sandvicensis) on Hawai‘i Island from 2010–2012 defined by 25% Brownian bridge utilization distributions (BBUDs) and displacement thresholds of movement events. All BBUDs (n = 13) of two nene breeding at Hakalau were summed (a) and BBUDs (n = 20) of four nene breeding at BICC were summed (b). All 25% BBUDs of six study subjects from both breeding location were summed (c). The locations of stopovers determined by displacement thresholds (black circles) were overlaid on the outlines of stopovers determined by 25% BBUDs (d).

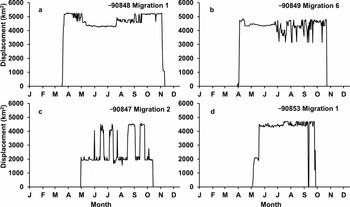
We identified 50 stopovers using displacement thresholds (Table 2; Figure 3d). Stopover locations included frequent use of Kīpuka ‘Ainahou in addition to locations scattered across the northern and eastern slopes of Mauna Loa at 1225–2710 m asl. Plots of NSD on ordinal date demonstrated multiple migration patterns and four of six subjects demonstrated non-unidirectional movements during the non-breeding season. Some individuals such as 90848 flew to Kahuku and returned to breeding sites with few pauses (Figure 4a); 90849 repeatedly flew between multiple stopover areas and multiple non-breeding areas (Figure 4b); 90847 flew repeatedly between multiple non-breeding areas (Figure 4c); and 90853 completed full migration twice prior to breeding (Figure 4d).
Temporal patterns in nene (Branta sandvicensis) migration determined by net squared displacement for four migration events on Hawai‘i Island during 2010–2012. Patterns included direct flights with few pauses between breeding and non-breeding areas (a), flights between multiple stopovers and multiple non-breeding areas (b), flights between multiple non-breeding areas (c), and multiple complete migrations between breeding and non-breeding areas (d).

Confidence intervals of the mean number of stopovers determined with 25% BBUDs and displacement threshold criteria were exclusive for breeding to non-breeding movements and for other movement events (Table 2). We found a greater number of stopovers used in movements from breeding to non-breeding sites than from non-breeding to breeding sites with both displacement threshold and 25% BBUD criteria, respectively (Mann–Whitney test W = 241, P < 0.006; W = 227, P = 0.032). We found no relationship between number of stopovers determined by displacement thresholds and direct distance between breeding and non-breeding sites (F 1,31 = 0.11, P = 0.738, r 2 < 0.01), although the relationship between number of stopovers and total distance travelled by nene was significant (F 1,31 = 25.8, P < 0.001, r 2 = 43.7). Nene travelled a mean distance of 1.95 times further than the direct distance between destinations (Appendix 2).
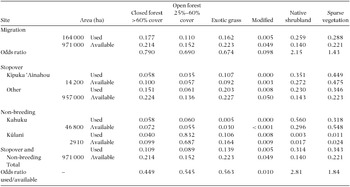
Nene demonstrated strong preferences for particular land-cover classes relative to overall availability based upon 50% migration corridor BBUDs and 25% movement event BBUDs, disproportionately using native shrubland and sparse vegetation at stopovers during migration (Table 3). Nene underutilized exotic grass and open forests, and avoided closed forests and modified areas of mowed turf. Habitat preferences during migration and stopovers reflected historical records of non-breeding locations, although the use of stopovers near water features was not previously reported (Baldwin Reference BALDWIN1945).
Habitat use relative to habitat availability for migration corridors based on 50% Brownian bridge utilization distributions (BBUDs) of migration events, and 25% BBUD estimates of stopover and non-breeding locations, respectively, of six nene (Branta sandvicensis) individuals on Hawai‘i Island, 2010–2012. Odds ratios are based on habitat used relative to total available habitat.

DISCUSSION
We found well-defined common migration corridors and stopovers used by nene during annual migrations from two widely separated breeding populations that were previously isolated from each other. Subjects from respective breeding populations used separate corridors during altitudinal migration to access a common stopover site at Kīpuka ‘Ainahou near the centre of the island, where they joined to use a common corridor on windward Mauna Loa to access the southern non-breeding destination at Kahuku. Nene typically stopped at several locations en route during movement events, nearly doubling their total movement distance, but were clearly capable of moving between terminal destinations regardless of habitat, occasionally flying directly between non-breeding and breeding destinations. All of the migration corridors, stopovers and non-breeding areas we identified were within the historical geographic range of nene. Although we found no evidence for any current use of the leeward western flanks of Mauna Loa or Hualālai volcanoes documented by Baldwin (Reference BALDWIN1945), it is possible that other individuals may use these areas.
Stopovers at Kīpuka ‘Ainahou were used by several subjects for weeks, suggesting the area may also serve as an alternative non-breeding destination. Many other nene from Hakalau and BICC also spent extended periods at Kīpuka ‘Ainahou during the non-breeding season (Hess et al. Reference HESS, LEOPOLD, MISAJON, HU and JEFFREY2012). Baldwin (Reference BALDWIN1945) reported numerous non-breeding season observations in this area and surrounding vicinity from 1890–1942 as nene approached their historic minimum abundance, indicating traditional use of this area by the relictual population. The origin of individuals and significance of migration routes, corridors and stopovers, however, were unknown at that time.
Migration routes and long-distance movements are culturally transmitted from adults to goslings in many goose species, including nene (Banko et al. Reference BANKO, BLACK, BANKO, Poole and Gill1999, Sutherland Reference SUTHERLAND1998), suggesting that current use of these stopover locations within corridors may be strongly influenced by traditional knowledge from previous generations, presumably from those that survived the severe population reduction of the mid-20th century. If nene form pair-bonds during the non-breeding season as do many other goose species (Robertson & Cooke Reference ROBERTSON and COOKE1999), overlapping migration corridors may serve to enhance genetic exchange between subpopulations. Further investigation of social dynamics and traditional use of stopovers and non-breeding destinations may reveal additional factors related to the seasonal importance of these locations during migration.
The role of stopovers for species that migrate only moderate distances may differ from that of long-distance migrants which require refuelling en route. Altitudinal migrants may need few stopovers if overall migration distance is relatively short, or may use many stopovers for relatively long time periods to exploit ephemeral resources as they move through altitudinal zones. Drivers of migration may also differ between upslope and downslope movements for intratropical altitudinal migrants (Boyle Reference BOYLE2010, Boyle et al. Reference BOYLE, NORRIS and GUGIELMO2010). Nene used numerous stopovers during migration away from breeding areas, but used fewer stopovers and returned more quickly during migrations back to breeding areas. Other bird species also exhibit protracted post-breeding migration patterns (O’Reilly & Wingfield Reference O’REILLY and WINGFIELD1995). If stopovers were necessary for refuelling, the number of stopovers used and migration distance should be positively related (Sawyer & Kauffman Reference SAWYER and KAUFFMAN2011). The fact that nene travelled substantially further than direct distances after breeding indicates factors others than refuelling influenced both the duration and routes of migration. Social avian species are known to congregate at stopovers, suggesting that the role of social interactions may be important during migration (Kruckenberg & Borbach-Jaene Reference KRUCKENBERG and BORBACH-JAENE2004).
We found that habitat preferences along migration routes and stopovers corresponded with preferences at non-breeding areas (Cornett Reference CORNETT2011, Leopold & Hess Reference LEOPOLD and HESS2013). Nene encountered a wide diversity of habitats over a broad altitudinal gradient, ranging from non-native low-elevation grasslands to nearly barren lava flows at >2700 m asl. Stopovers primarily occurred at the confluence of movement between the two breeding subpopulations, most frequently in native-dominated subalpine shrubland, but also at an unnatural water feature surrounded by mixed exotic and native grassland. Stopovers were not dominated by exotic grass habitats such as those strongly preferred during breeding and moulting (Leopold & Hess Reference LEOPOLD and HESS2013). Further research using spatial patterns of NDVI may help determine if intratropical migrants such as nene follow the phenology of vegetation during migration to take advantage of the seasonal availability of food resources in space and time as do some migrant geese that breed in temperate zones (van der Graaf et al. Reference VAN DER GRAAF, STAHL, KLIMKOWSKA, BAKKER and DRENT2006, van Wijk et al. Reference VAN WIJK, KOLZSCH, KRUCKENBERG, EBBINGE, MUSKENS and NOLET2011). Alternatively, the timing of migration initiation may be unrelated to food resource availability and subject to endogenous control as in other tropical bird species which are influenced by small shifts in photoperiod (Styrsky et al. Reference STYRSKY, BERTHOLD and ROBINSON2004). Our findings, and the direction and timing of migration, which is opposite that of other intratropical altitudinal migrants, suggest that the drivers of nene migration may differ fundamentally from most other tropical birds.
ACKNOWLEDGEMENTS
Funding for this project was provided by Park Oriented Biological Support and the Natural Resources Preservation Program of the National Park Service and the U.S. Geological Survey. We acknowledge Hawai‘i Division of Forestry and Wildlife, Three Mountain Alliance, Hakalau Forest National Wildlife Refuge, Big Island Country Club, and Hawai‘i Volcanoes National Park for access to field sites. The U.S. Army Pōhakuloa Training Area provided satellite transmitters for this research. We also thank S. P. Berkowitz, K. W. Brinck, R. J. Camp, L. S. Elliott, D. Hu, J. J. Jeffrey, K. Misajon, D. R. Leopold, J. T. Polhemus, and H. Sin for assistance and M. H. Reynolds and two anonymous reviewers for many helpful suggestions. Use of trade, product, or firm names in this publication is for descriptive purposes and does not imply endorsement by the U.S. Government.
Identities, origin, destination, number of locations, sample period, and area of Brownian bridge utilization distributions (BBUDs) for migration events of six nene (Branta sandvicensis) individuals on Hawai‘i Island, 2010–2012. Migration events were defined as a departure from and return to a breeding location including 5 d of location data at the breeding site before and after each migration. Dashes indicate migration event was excluded from analyses.

Identities, origin, destination, number of locations, sample period, and area of Brownian bridge utilization distributions (BBUDs) for movement events of six nene (Branta sandvicensis) individuals on Hawai‘i Island, 2010–2012. Dashes indicate movement event was excluded from analyses. Movement index was calculated as the ratio of total distance travelled by Nēnē to direct distance between breeding and non-breeding areas.