Inhibitory control is a central executive function defined as the suppression of automatic responses to reach an objective set by environmental requirements (Fontana et al., Reference Fontana, Raimondi, Schmidt and González2016). Importantly, inhibitory control permits individuals to limit the influence of unwanted behaviors and thoughts, aiding behavioral flexibility towards adapting to diverse goals and environmental contingencies (Anderson & Weaver, Reference Anderson, Weaver and Squire2009). Impairments in inhibitory control might play a crucial role in emotional disorders because they can hinder disrupting maladaptive cognitive processes (e.g., worry and rumination). Indeed, the relationship between depression and generalized anxiety disorder (GAD) with inhibitory control has been studied in recent years (e.g., De Raedt & Koster, Reference De Raedt and Koster2010; Harlé et al., Reference Harlé, Shenoy and Paulus2013).
Regarding depression, inhibitory control deficits might hinder disrupting attention to negative stimuli and self-referent negative thoughts. This might lead to increased processing of negative stimuli and depressive rumination (Disner et al., Reference Disner, Beevers, Haigh and Beck2011; Gotlib & Joormann, Reference Gotlib and Joormann2010; Joormann & D’Avanzato, Reference Joormann and D’Avanzato2010; Joormann & Vanderlind, Reference Joormann and Vanderlind2014; Koster et al., Reference Koster, De Lissnyder, Derakshan and De Raedt2011). Indeed, De Raedt and Koster (Reference De Raedt and Koster2010) suggested that experiencing recurrent depressive episodes reduces prefrontal control, which could lead to impaired inhibitory control over processes such as rumination when faced with stressors.
As for GAD, Hirsch and Mathews (Reference Hirsch and Mathews2012) propose that deficits in inhibitory control interact with associated involuntary processes to affect GAD symptomatology. Similarly, attentional control theory proposes that worrying impairs cognitive efficiency because it competes for attentional resources and hinders inhibitory control (Eysenck et al., Reference Eysenck, Derakshan, Santos and Calvo2007).
The Stroop Color and Word Test (SCWT; Stroop, Reference Stroop1935) is one of the most widely-used instruments to measure inhibitory control (Snyder, Reference Snyder2013). In its classic form, the SCWT consists of three cards. The first two cards are known as the neutral condition. In the first one, participants must read a list of words with black ink as quickly as possible (SCWT-Word). In the second card, the participant must name the ink color of rows of X’s (SCWT-Color). These neutral conditions are thought to measure processing speed. The third card is known as the incongruent condition, and it measures inhibitory control by asking participants to name the ink color of words disregarding their meaning (SCWT-Word-Color).
Other versions of the Stroop test have also been designed, such as the Emotional Stroop Task (EST). The EST measures both inhibitory control and emotional interference through rows of negative and positive affect words (Williams et al., Reference Williams, Mathews and MacLeod1996). There is a large body of evidence of attentional biases towards negative words in the EST in participants with depression, possibly due to emotional interference and impaired inhibitory control (see a meta-analysis in Peckham et al., Reference Peckham, McHugh and Otto2010). Other studies have also found similar results in the EST in participants with GAD (Becker et al., Reference Becker, Rinck, Margraf and Roth2001; Chen et al., Reference Chen, Wang, Wu, Cai, Shen, Wang and Shi2013; Mogg & Bradley, Reference Mogg and Bradley2005; Taghavi et al., Reference Taghavi, Dalgleish, Moradi, Neshat-Doost and Yule2003). However, the EST involves both inhibitory control and emotional interference; therefore, it is not possible to isolate the effect of inhibitory control in these studies. Conversely, there are fewer studies regarding SCWT performance in patients with depression and GAD.
Some studies have found that individuals with clinical levels of depressive symptoms perform significantly worse than the controls in the SCWT (Fossati et al., Reference Fossati, Ergis and Allilaire2002; Javed et al., Reference Javed, Hanif and Siddique2019; Sarosi et al., Reference Sarosi, Gonda, Balogh, Szekely, Sasvari and Faludi2008). However, other investigations have not found significant differences in SCWT performance between clinical and nonclinical participants (Aker et al., Reference Aker, Bø, Harmer, Stiles and Landrø2016; Holler et al., Reference Holler, Kavanaugh and Cook2014). The meta-analysis by Snyder (Reference Snyder2013) showed that participants with depression presented a larger SCWT interference effect than healthy participants, d = 0.39, 95% CI [0.23, 0.54], k = 20.
Considerably fewer studies have been conducted on inhibitory control in participants with GAD. Nonetheless, one study found that participants with clinical levels of GAD symptoms performed significantly worse than the controls in the SCWT, with symptom severity predicting slower and less accurate performance (Hallion et al., Reference Hallion, Tolin, Assaf, Goethe and Diefenbach2017). However, Price and Mohlman (Reference Price and Mohlman2007) did not find significant differences between older adult participants with clinical and nonclinical levels of GAD symptoms.
There is a lack of empirical evidence regarding the performance in the SCWT in clinical Spanish-speaking samples. To our best knowledge, the only related study was performed by Rodríguez et al. (Reference Rodríguez, Ruiz, Valdés, Reinel, Díaz, Flores, Crempien, Leighton, Botto, Martínez and Tomicic2017). This study was conducted with 91 Chilean, nonclinical undergraduates who responded, among other instruments, to the Beck Depression Inventory (BDI; Beck et al., Reference Beck, Ward, Mendelson, Mock and Erbaugh1961) and the SCWT. The BDI scores showed a statistically significant negative correlation with the number of correct responses on a computerized version of the SCWT. However, this study did not compare the performance on the SCWT between depressed and nondepressed groups, nor correlated the performance on the SCWT with GAD symptoms.
Cultural differences may play a significant role in the SCWT performance. This topic has not been widely addressed, although some studies have been conducted. For instance, Chinese participants reported lower self-control perception and better performance on the SCWT than the U.S. participants (Li et al., Reference Li, Vazsonyi and Dou2018). On the other hand, Buré-Reyes et al. (Reference Buré-Reyes, Hidalgo-Ruzzante, Vilar-López, Gontier, Sánchez, Pérez-García and Puente2013) did not find significant differences in the SCWT within Spanish-speaking subgroups. Lastly, Alansari and Baroun (Reference Alansari and Baroun2004) results showed that Kuwaiti college students presented higher SCWT interference than their British counterparts.
Cultural differences in the SCWT performance might be attributed to many reasons. Firstly, quality of education might play a significant role due to the differential importance that different educational systems give to psychological processes associated to academic performance such as reading skills, attention span, memory, etc., which can affect neuropsychological performance (Buré-Reyes et al., Reference Buré-Reyes, Hidalgo-Ruzzante, Vilar-López, Gontier, Sánchez, Pérez-García and Puente2013; Kennepohl et al., Reference Kennepohl, Shore, Nabors and Hanks2004; Manly et al., Reference Manly, Jacobs, Touradji, Small and Stern2002). Secondly, the socioeconomic status of the sample might also play a significant role, not only on an individual level but also as a base for discrepancies regarding the investment each country does to educational systems (Armengol, Reference Armengol2002; Buré-Reyes et al., Reference Buré-Reyes, Hidalgo-Ruzzante, Vilar-López, Gontier, Sánchez, Pérez-García and Puente2013; Llorente, Reference Llorente and Llorente2008). Thirdly, the SCWT performance might also be affected by the complexity of the language structure, either by its pronunciation or the length of words used in the conditions (Alansari & Baroun, Reference Alansari and Baroun2004). Fourthly, the SCWT performance might be influenced by the different tendency across cultures in vocal tone and word meaning. For instance, there is some evidence of the better performance on the SCWT by Japanese participants, who tend to pay more attention to the vocal tone, compared with North Americans, who tend to focus more on the meaning (Alansari & Baroun, Reference Alansari and Baroun2004; Ishii et al., Reference Ishii, Reyes and Kitayama2003). Lastly, cultural differences in the SCWT might also be attributed to the conditions of the experimental setting such as the differences in how the instructions were given, the personal distance used during testing, use of formal language that opposes the common expressions of the participants, etc. (Buré-Reyes et al., Reference Buré-Reyes, Hidalgo-Ruzzante, Vilar-López, Gontier, Sánchez, Pérez-García and Puente2013).
In conclusion, no studies have been conducted in Spanish-speaking countries comparing inhibitory control between individuals with depression or GAD and a healthy control group. Accordingly, this study aimed to advance in this direction by analyzing the performance on the SCWT between groups of Colombian individuals with clinical levels of depression and GAD and a nonclinical control group.
Method
Participants
The sample was recruited through a non-probability, convenience sampling (see details of the recruitment in the procedure section). It consisted of 105 adult participants from the general population (68 women and 37 men, age range = 18 to 38, M = 22.94, SD = 4.62). Thirty-seven percent of participants were currently working, and their educational level was: 71.4% mid-level graduates, 9.5% technicians, 9.5% graduates, and 9.5% postgraduates. Participants’ socioeconomic status was: 19% low, 76.2% medium, and 4.8% high.
Instruments
Patient Health Questionnaire (PHQ–9; Spitzer et al., Reference Spitzer, Kroenke and Williams1999). The PHQ–9 consists of a Likert-type scale (3 = nearly every day; 0 = not at all) that measures depressive symptoms according to the DSM–IV through 9 items. A cutoff of 10 is usually adopted to establish a diagnosis of depression (Kroenke & Spitzer, Reference Kroenke and Spitzer2002). The Spanish translation distributed by Pfizer for Colombia has shown adequate psychometric properties and a one-factor structure in previous studies in our laboratory. In this study, the PHQ–9 showed a Cronbach’s alpha of .84.
Generalized Anxiety Disorder–7 (GAD–7; Spitzer et al., Reference Spitzer, Kroenke, Williams and Löwe2006). The GAD–7 consists of a Likert-type scale (3 = almost every day; 0 = not at all) that measures GAD symptoms according to the DSM–IV through 7 items. A cutoff of 10 is usually adopted to establish a diagnosis of GAD (García-Campayo et al., Reference García-Campayo, Zamorano, Ruiz, Pardo, Pérez-Paramo, López-Gómez, Freire and Rejas2010; Spitzer et al., Reference Spitzer, Kroenke, Williams and Löwe2006). The Spanish translation distributed by Pfizer for Colombia has shown good psychometric properties and a one-factor structure in previous studies conducted in our laboratory. In this study, the GAD–7 showed an alpha of .86.
Stroop Color and Word Test (SCWT; Golden, Reference Golden2007). The test consists of 3 cards, each one with five columns and twenty rows. Participants must name as many words or colors, depending on the subtest, as they can in the correct order in 45 seconds. The first card (Word) contains names of colors written with black ink. The second card (Color) contains X’s of different colors (red, green, blue, yellow, and black). These two cards are known as the neutral conditions and are thought to measure processing speed. These two subtests are scored by summing the number of words or colors the participants named. The last card (Word-Color) corresponds to the word-color interference since it has names of colors printed in an ink that does not match the printed word. This latter card can be scored based on the number of the colors named or by computing a score, namely Stroop Interference, which controls for baseline differences in the two neutral conditions. Stroop Interference was calculated with the following formula: Stroop Interference = WC – WC’, where WC is the number of colors named in this subtest and WC’ is the number of colors expected to name according to the participants’ performance in the neutral conditions. WC’ is calculated with the following formula: WC’ = (W x C) / (W + C), where W is the number of words named in the first neutral condition and C is the number of colors named in the second neutral condition. The SCWT has shown good psychometric properties in Colombia (Rodríguez-Barreto et al., Reference Rodríguez-Barreto and Pineda-Roa2016).
Procedure
The institutional ethics committee approved the procedures employed in this study. The recruitment was conducted through the social media of the institution with an aid that asked people if they were interested in knowing their memory and attention capacities.
People interested in the research were contacted through phone or email to schedule the experimental session, which was conducted in a clinical psychology laboratory. After signing the informed consent, participants responded to the sociodemographic and questionnaire package in an online platform. Afterward, the administration of the SCWT was conducted by trained psychologists. Upon completion of the test, participants were debriefed, and a report with their results was given.
Data AnalysisFootnote 1
Before conducting the data analyses, all variables were explored for the accuracy of data entry and missing values. No missing values were found. We computed Bayesian data analyses with the software JASP 0.12.2.0Footnote 2 (JASP Team, 2020). This software provides a graphical interface of multiple R packages, including the BayesFactor package. The latter provides the computation of Bayes factors for multiple and widely used statistical tests (e.g., t-tests, ANOVA, regression, etc.).
Bayesian hypothesis testing has some interesting advantages over the frequentist’s counterpart (e.g., Dienes & Mclatchie, Reference Dienes and Mclatchie2018). One advantage is that Bayes factor (BF) provides a quantification of the relative evidence in the observed data, expressed as relative odds, for the null and the alternative hypotheses (Afonso et al., Reference Afonso, Machado, Carreiro and Machado-Pinheiro2020). This way, and contrary to the frequentist framework, Bayesian data analyses allow the null and alternative hypotheses to compete in the same conditions (Dienes, Reference Dienes2014). Bayes factors are usually interpreted using the following guidelines (Jeffreys, Reference Jeffreys1961): 1 = No evidence for the alternative hypothesis; 1–3 = Anecdotal evidence for the alternative hypothesis; 3–10 = Substantial evidence for the alternative hypothesis; 10–30 = Strong evidence for the alternative hypothesis; 30–100 = Very strong evidence for the alternative hypothesis; and > 100 = Extreme evidence for the alternative hypothesis. BFs < 1 are interpreted similarly but favoring the null hypothesis. A second advantage of Bayesian hypothesis testing is that it includes prior expectations of the parameters. These prior expectations are expressed in prior distributions in which plausible parameters have a higher density than implausible ones (Lee, Reference Lee2004). These distributions can be determined according to previous empirical evidence (Wagenmakers et al., Reference Wagenmakers, Love, Marsman, Jamil, Ly, Verhagen, Selker, Gronau, Dropman, Boutin, Meerhoff, Knight, Raj, van Kesteren, van Doorn, Šmíra, Epskamp, Etz, Matzke, de Jong and Morey2018).
Initially, we explored the equivalence of the subgroup of depressed vs. nondepressed participants and the subgroup of anxious vs. nonanxious participants. For categorical variables, we computed Bayesian multinomial tests (Gunel & Dickey, Reference Gunel and Dickey1974), whereas, for continuous variables, we used the JZS Bayesian independent t-test (Rouder et al., Reference Rouder, Speckman, Sun, Morey and Iverson2009). Default prior distributions were used in these analyses because we did not have previous expectations of the parameters. For the Bayesian multinomial tests, a default prior concentration of 1 was used. Regarding the JZS independent t-test, the default prior consisted of a Cauchy distribution in which the effect size of the factor, termed δ, was located at 0, and the parameter r was set at .707. This latter parameter represents the width of the distribution.
To compare the performance of the groups of participants with clinical and nonclinical levels of emotional symptoms on the SCWT, we used the informed Bayesian t-test suggested by Gronau et al. (Reference Gronau, Ly and Wagenmakers2019). This informed test is especially suited for expected small to medium effect sizes, as it was our expectation given the systematic reviews and meta-analyses available (e.g., Snyder, Reference Snyder2013). This prior follows a t-distribution with location 0.350, scale 0.102, and 3 degrees of freedom.
Results
Distribution of Participants into Clinical and Nonclinical Groups
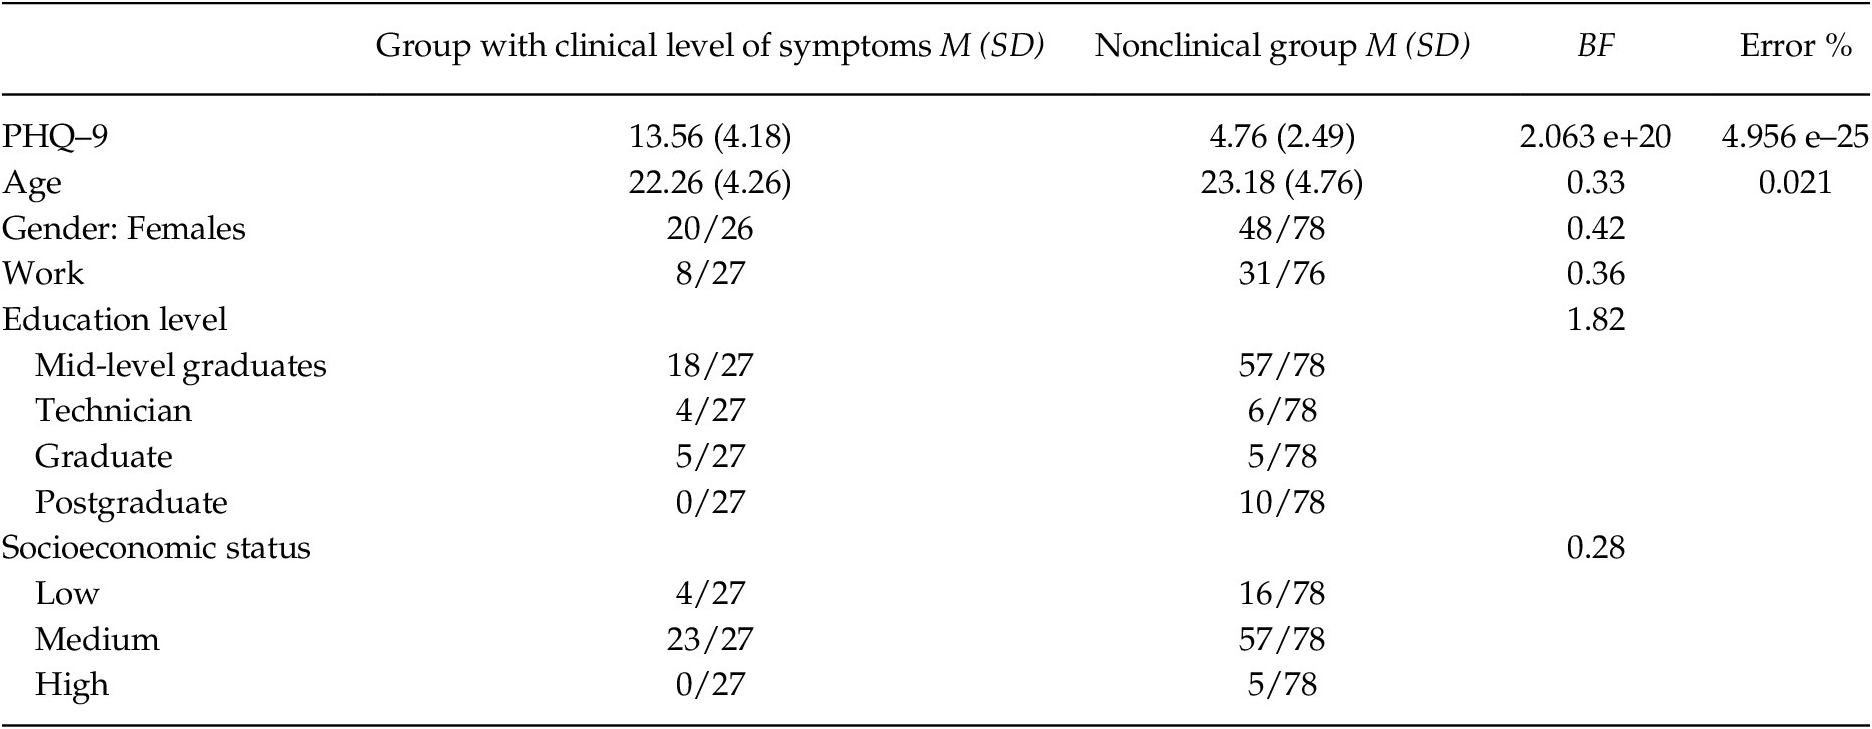
Depressed vs. nondepressed subgroups. Twenty-seven of the 105 participants (25.71%) showed a clinical level of depression symptoms (i.e., PHQ–9 ≥ 10). Table 1 shows the descriptive data of the depressed and nondepressed subgroups. The Bayesian independent t-test yielded an extremely large BF supporting the alternative hypothesis of different scores on the PHQ–9 between the subgroups. The BFs for the sociodemographic characteristics supported the null hypothesis of no differences between the subgroups (i.e., BF < 1), except for the education level. However, note that the BF for this variable was 1.82, which only provides anecdotal evidence in favor of the alternative hypothesis. In conclusion, the two subgroups had a different level of depression symptoms but were equivalent in age, gender, working status, education level, and socioeconomic status.
Descriptive Data and Bayes Factors for the Subgroup with Clinical Levels of Depression vs. the Subgroup with Nonclinical Levels

Note. PHQ–9 = Personal Health Questionnaire–9.
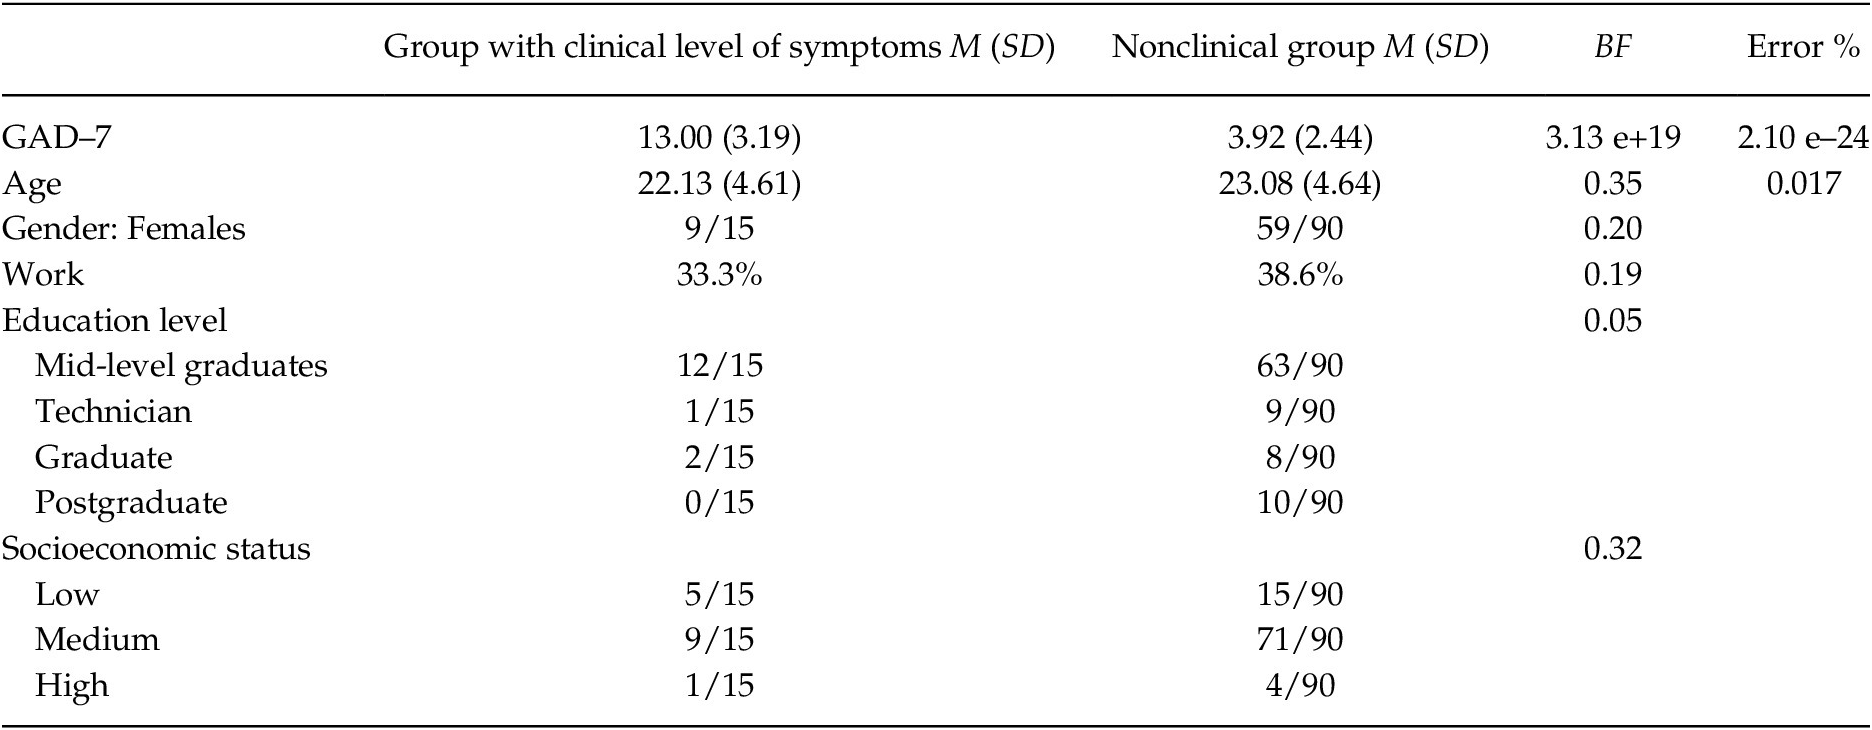
Anxious vs. nonanxious subgroups. Fifteen participants (14.29%) showed a clinical level of GAD symptoms (i.e., GAD–7 ≥ 10). Table 2 shows the descriptive data of the anxious and nonanxious subgroups. The Bayesian independent t-test also yielded an extremely large BF supporting the alternative hypothesis of different scores on the GAD–7 between the subgroups. The BFs for the sociodemographic characteristics indicated support for the null hypothesis of no differences between the subgroups (i.e., BF < 1). In conclusion, the two subgroups had a different level of GAD symptoms but were equivalent in sociodemographic characteristics.
Descriptive Data and Bayes Factors for the Subgroup with Clinical Levels of GAD Symptoms vs. the Subgroup with Nonclinical Levels

Note. GAD–7 = Generalized Anxiety Disorder–7.
Results on the SCWT
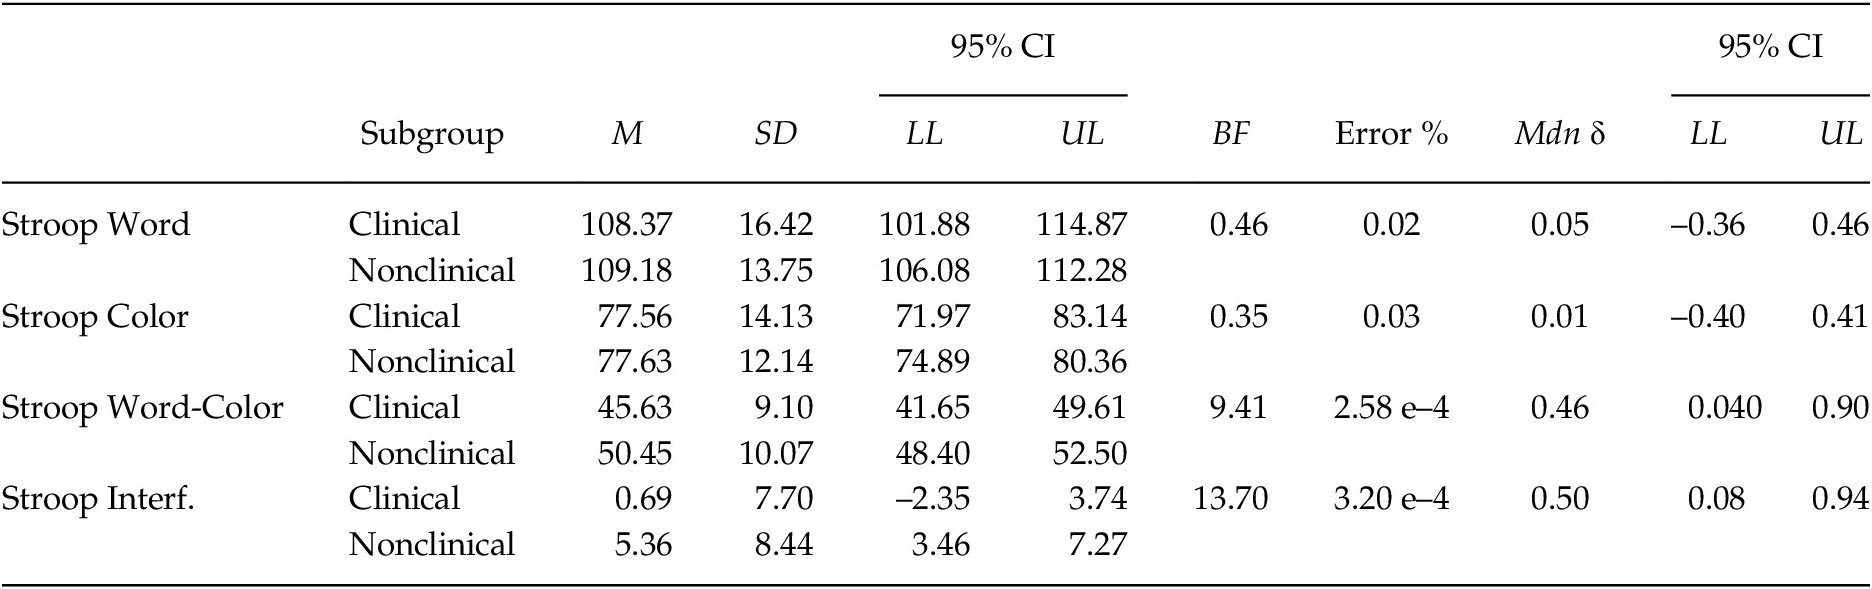
Depressed vs. nondepressed subgroups. Table 3 shows the descriptive data with 95% credible intervals (CI), BFs, and main parameters of the posterior distribution (median effect size and 95% CI) yielded from the informed Bayesian independent t-test. Mean scores on the SCWT-Word and SCWT-Color were very similar between the depressed and nondepressed subgroups, with the BFs providing greater support to the null hypothesis. Also, the median effect sizes were very small. However, mean scores showed more differences regarding the SCWT-Word-Color. The BF of this comparison was 9.41, which provides near to strong support for the alternative hypothesis. The median effect size was 0.46, 95% CI [0.04, 0.90]. Additionally, the scores on Stroop Interference were higher for the nondepressed group, with a BF of 13.70 that provides strong support for the alternative hypothesis. The median effect size was 0.50, 95% CI [0.08, 0.94].Footnote 3
Descriptive Data and Bayes Factors for the Groups with Clinical Levels of Depression Symptoms vs. the Groups with Nonclinical Levels

Note. CI = Credible intervals.
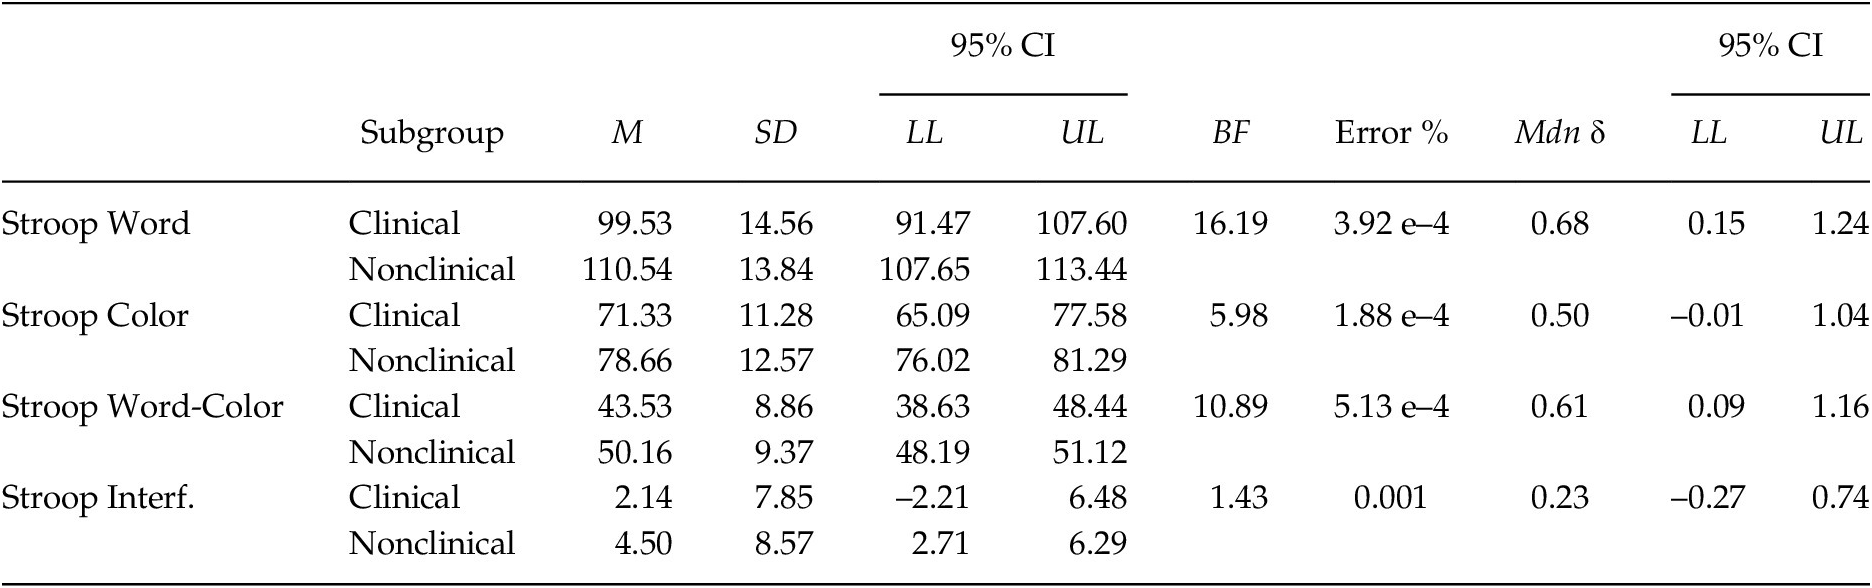
Anxious vs. nonanxious subgroups. Table 4 shows the results of the informed Bayesian independent t-test. The nonanxious subgroup showed higher mean scores on the neutral conditions of the SCWT than the anxious subgroup. The BFs indicated strong evidence for alternative hypothesis in the SCWT-Word (BF = 16.19) and substantial evidence in the SCWT-Color (BF = 5.98). The median effect sizes were medium in both cases, SCWT-Word: δ = 0.68, 95% CI [0.15, 1.24]; SCWT-Color: δ = 0.50, 95% CI [–0.01, 1.04]. These results indicate that the nonanxious subgroup showed higher processing speed than the anxious subgroup.
Descriptive Data and Bayes Factors for the Groups with Clinical Levels of GAD Symptoms vs. the Groups with Nonclinical Levels

Note. CI = Credible intervals.
The results also supported the alternative hypothesis for the incongruent condition (i.e., SCWT-Word-Color). However, due to the differences in the neutral conditions, Stroop Interference is the indicator more adequate in this case because it controls for baseline differences in processing speed (Snyder, Reference Snyder2013). The results only showed anecdotal evidence favoring the alternative hypothesis for Stroop Interference (BF = 1.43), with a small effect size, δ = 0.23, 95% CI [–0.27, 0.74]Footnote 4.
Discussion
This study aimed to analyze the differences in inhibitory control in Colombian participants with clinical levels of depression and GAD vs. nonclinical control groups by using the SCWT. In so doing, we used a cutoff of 10 points on the PHQ–9 and GAD–7 to identify participants with clinical levels of depression and GAD, respectively. The application of this cutoff led to subgroups of participants with very large differences in symptoms of depression and GAD. These subgroups, however, were equivalent in sociodemographic characteristics such as age, gender, working status, education level, and socioeconomic status.
Depressed vs. Nondepressed Groups
The results between the depressed and the nondepressed group showed that participants’ scores on the neutral conditions of the SCWT (SCWT-Word and SCWT-Color) were equivalent, indicating that both subgroups obtained similar scores on processing speed. These results contrast with the meta-analysis conducted by Snyder (Reference Snyder2013), in which the weighted effect size for the neutral conditions was medium (d = 0.61, k = 14). In conclusion, depressed participants did not show deficits in processing speed in our study.
According to the results on the neutral conditions, the predicted performance on the incongruent condition (i.e., SCWT-Word-Color subtest) was expected to be very similar. However, nondepressed participants outperformed their depressed counterparts in this condition. Indeed, the median effect sizes were medium, and the BFs strongly supported the alternative hypothesis of differences between groups in both the number of colors named and Stroop interference. These results were consistent with previous studies (e.g., Fossati et al., Reference Fossati, Ergis and Allilaire2002; Javed et al., Reference Javed, Hanif and Siddique2019; Sarosi et al., Reference Sarosi, Gonda, Balogh, Szekely, Sasvari and Faludi2008) and the meta-analysis conducted by Snyder (Reference Snyder2013). In the latter study, the weighted effect size was higher for the incongruent condition (d = 0.73, k = 19) than for the Stroop Interference (d = 0.39, k = 20). In our study, however, the effect sizes were basically the same. In summary, this study supports the hypothesis of impairments in inhibitory control among depressed participants in comparison with healthy controls.
Anxious vs. Nonanxious Subgroups
The results between the anxious and the nonanxious subgroups showed that participants’ scores on the neutral conditions of the SCWT (SCWT-Word and SCWT-Color) were considerably different. Specifically, nonanxious participants outperformed their anxious counterparts according to the BFs and with medium effect sizes. These results indicate that participants with a clinical level of GAD symptoms showed deficits in processing speed relative to healthy controls. This significantly contrasts with the results obtained in this study with depressed participants.
According to the results on the neutral conditions, the predicted performance on the incongruent condition was expected to be better in nonanxious participants. Indeed, the Bayesian independent t-test supported this expectation. However, as Snyder (Reference Snyder2013) noted, in contexts in which groups differed in the performance on the neutral conditions, Stroop Interference is more informative because this score controls for baseline differences in processing speed. Importantly, the BF obtained in Stroop Interference only anecdotally supported the alternative hypothesis of differences between groups, with a small effect size. Accordingly, the results of our study contrast with a previous study that found deficits in inhibitory control in individuals with GAD relative to healthy controls (Hallion et al., Reference Hallion, Tolin, Assaf, Goethe and Diefenbach2017). In conclusion, the results of our study indicate that participants with a clinical level of GAD symptoms present deficits in speed processing, but not in inhibitory control.
The latter conclusion is partially consistent with the attentional control theory proposed by Eysenck et al. (Reference Eysenck, Derakshan, Santos and Calvo2007). This approach states that worrying impairs cognitive efficiency because it competes for attentional resources, which could be the cause of the slower processing speed reflected by individuals with clinical levels of GAD symptoms. However, the attentional control theory also suggests that worrying should hinder inhibitory control. The current results do not support this hypothesis.
The current results contrast with the ones found with the EST in participants with clinical levels of GAD symptoms. Accordingly, the results on the EST might be more influenced by the emotional functions of the stimuli of the task than by deficits in inhibitory control (Price & Mohlman, Reference Price and Mohlman2007).
Possible Explanations for the Inconsistent Results
As commented above, the results found in this study contrasted in some aspects with previous findings in English-speaking countries. These divergences could be attributed to the expected variability found across studies in this topic. For instance, to our best knowledge, only two studies were conducted analyzing inhibitory control deficits in GAD: Hallion et al. (Reference Hallion, Tolin, Assaf, Goethe and Diefenbach2017) found significant differences between participants with GAD and a control group, whereas Price and Mohlman (Reference Price and Mohlman2007) did not find differences in inhibitory control. However, cultural differences might also be relevant due to language differences, educational background, socioeconomic status, or even subtle cultural characteristics such as the tendency to focus on the vocal tone or the word meaning (Alansari & Baroun, Reference Alansari and Baroun2004; Armengol, Reference Armengol2002; Buré-Reyes et al., Reference Buré-Reyes, Hidalgo-Ruzzante, Vilar-López, Gontier, Sánchez, Pérez-García and Puente2013; Ishii et al., Reference Ishii, Reyes and Kitayama2003; Llorente, Reference Llorente and Llorente2008). However, the current study was not designed to address the potential effect of these characteristics. Accordingly, future research should compare the SCWT performance across cultures and analyze the variables that might explain the differences on inhibitory control performance.
Some limitations of the current study are worth mentioning. Firstly, inhibitory control was only measured by the SCWT. Using multiple inhibitory control tasks could provide a more comprehensive understanding of the possible deficits showed by individuals suffering from depression and GAD in this executive function (e.g., Hayling, Go/no-go, Stop Signal, the Simon Task, or other tests more oriented to performance on everyday life). Secondly, the variability of symptom severity within the clinical groups could affect SCWT performance. Further studies might group their clinical participants according to their symptom severity to assess if this variable could be affecting inhibitory control performance. Thirdly, our sample was composed of almost twice women than men. Although there were no differences across subgroups in this variable, gender could be a potential moderator variable to analyze in further studies. Fourthly, we grouped participants with clinical levels of depression and GAD according to their scores on the PHQ–9 and GAD–7, respectively. Subsequent studies should recruit participants suffering from depression and GAD with a clinical interview. Lastly, the recruitment implemented in this study led to a considerably smaller subgroup of clinical participants than healthy controls. This is a higher limitation regarding our results about GAD because only 15 participants showed clinical levels of this type of symptomatology. Further studies should recruit groups of participants of approximately the same size.
This study has preliminarily addressed the lack of empirical evidence in Spanish-speaking countries regarding the relationship between inhibitory control and clinical levels of depression and GAD. The results of this study show that clinical levels of depression seem to be associated with inhibitory control deficits but not difficulties in processing speed. Conversely, clinical levels of GAD were associated with deficits in processing speed but not in inhibitory control. Accordingly, psychological interventions for depression and GAD might test the effect of including trainings in increasing skills in inhibitory control (e.g., Schroder et al., Reference Schroder, Dubuson, Dousset, Mortier, Kornreich and Campanella2020) and processing speed (Manglani et al., Reference Manglani, Samimy, Schirda, Nicholas and Prakash2020).