

INTRODUCTION
Women's dominance in Ghanaian marketplaces is well documented (Chamlee-Wright Reference Chamlee-Wright1997; Clark Reference Clark1994; Nypan Reference Nypan1960; Overå Reference Overå1998; Robertson Reference Robertson1984). Unlike in many other parts of Africa, female traders are not morally condemned or regarded as un-feminine when they use physical strength, talk loudly, display self-acquired wealth or exercise power over others (including male employees). Rather, such behaviour is seen as a necessary aspect of the trader role. To be a trader has become a ‘natural’ way for women to fulfil the social expectation of combining their roles as wives and mothers with income generation (Clark Reference Clark2000).Footnote 1 Gender ideologies or ‘assumptions about gender-appropriate behaviour’ (McDowell Reference McDowell1997: 27) are time- and place-specific, and in Ghana the trader role, primarily within the food crops and textile sectors, has been constructed as female through ‘the interplay between global historical forces and local social relations’ (Grosz-Ngaté Reference Grosz-Ngaté, Grosz-Ngaté and Kokole1997: 1). During the twentieth century, the marketplaces became ‘sites of female accumulation’ (Akyeampong Reference Akyeampong, Anderson and Rathbone2000: 222). Among petty traders and hawkers outside the marketplaces and in the streets, in the so-called informal economy (Hart Reference Hart1973), women have likewise outnumbered men in retailing vegetables, selling ‘street food’, hawking various necessities, commonly employing the strategy of bulk-breaking larger stocks into tiny-tiny portions.
During the 1990s, the streets of Accra became more even more crowded than after the demolition of the historic market Makola No. 1 in the late 1970s (see Robertson Reference Robertson1983), and this time one could observe more and more men among the petty traders and hawkers.Footnote 2 Men also increasingly performed tasks associated with food-provision that – in this part of Africa – used to be done primarily by women, such as sitting on the roadside selling small heaps of onions or tomatoes, and helping women cooking and hawking snacks and ‘street food’. ‘Men now even carry food on their heads’, people said to illustrate the ‘femininity’ of this kind of activity. These observations generate many questions: What are the circumstances that drive men to do ‘women's work’? How do men handle their male identity when they engage in ‘female’ occupations? How do women respond to male competition?
Accra's street scene expresses an ongoing process of ‘informalisation’ (Castells & Portes Reference Castells, Portes, Portes, Castells and Benton1989), conceived as a process and a wider response to crisis (Meagher Reference Meagher1995; Rogerson Reference Rogerson and Rakodi1997). This conceptualisation has been offered as an alternative to the ‘disengagement from the state’ approach often proposed by the World Bank, the ILO and academics (i.e. Azarya & Chazan Reference Azarya and Chazan1987; De Soto Reference De Soto1989; Tripp Reference Tripp1997). In this view, the so-called informal economy is celebrated for its potential for employment generation, economic growth and political influence. This unquestionable potential must however be analysed in light of the realities that African economies have become increasingly marginalised globally, most Africans earn meagre incomes, and African states often put severe obstacles in the way of those who try to employ themselves (Hansen & Vaa Reference Hansen, Vaa, Hansen and Vaa2004).
In the case of Ghana, among the most significant factors explaining the crisis are political instability and economic mismanagement, falling terms of trade for the country's primary products on the global market, and (partly in response to this) implementation of World Bank recommended public sector reforms and economic liberalisation through Structural Adjustment Programmes (SAP) since 1983 (Aryeetey & Harrigan Reference Aryeetey, Harrigan and Aryeetey2000). The focus of this paper is not on the underlying causes of informalisation, but on the effect of structural changes on social dynamics within the informal economy: how do women and men adapt their livelihood strategies to a deteriorating economic environment, and how do these strategies influence gendered power relations and the performance of gender roles?
Many studies have illuminated the consequences of the ‘belt-tightening’ liberalisation policies implemented in Ghana since the mid-1980s. First of all, public spending in the social sectors such as health and education was drastically reduced, and state subsidies were removed. Combined with exchange rate adjustments which resulted in dramatic devaluations of the cedi, this meant that a larger share of household budgets was spent on medicines and school fees (Konadu-Agyemang Reference Konadu-Agyemang2000: 474). Real wages in 1995 were half what they had been in 1970 (Fine & Boateng Reference Fine, Boateng and Aryeetey2000; Teal Reference Teal2000); and not surprisingly, living conditions in terms of housing and consumption deteriorated (Yankson et al. Reference Yankson, Lareya, Aryeetey and Sawyer2001). Furthermore, a series of so-called ‘redeployment exercises’ started in 1984 (Ninsin Reference Ninsin1991). Between 1987 and 1998, 60,000 civil servants were made redundant (Maxwell et al. Reference Maxwell, Levin, Armar-Klemesu, Ruel, Morris and Ahiadeke2000: 33). Only 25% of the civil servants were female, but since it was those with the least education and seniority who were laid off first, 35% of the retrenched were women (Alderman et al. Reference Alderman, Canagarajah, Younger, Lindauer and Nunberg1996: 218). Still, most of the retrenched civil servants were men. In addition, thousands of workers in formal sector industries were retrenched. According to one estimate, total employment in the large- and medium-scale formal sector fell by almost 60%, from 464,000 in 1985 to 186,000 in 1991 (Hilson & Potter Reference Hilson and Potter2005: 106). Again these were mostly men, since only one-tenth of those employed were women (Date-Bah Reference Date-Bah, Anker and Hein1986: 237). Apart from ‘sitting in the house’ (often said about those who do not work), or resorting to agriculture or artisanal gold mining (Hilson & Potter Reference Hilson and Potter2005), the job-losers had no alternative than to find themselves something to do in the urban informal economy.
Informalisation of the labour market has gendered consequences (see Elson Reference Elson1999). It has been pointed out that in Africa ‘under structural adjustment declining real wages and high unemployment in the formal sector force wives and daughters into the informal sector to supplement, or even earn, the household income’ (Meagher Reference Meagher1995: 270). African labour markets are differently gendered in different places and regions, however. The gendered consequences of structural adjustment and informalisation thus also vary. For example, whereas women in many countries in eastern and southern Africa have been expected to be provided for by their husbands (i.e. Hansen Reference Hansen1997; Lange Reference Lange2003), women in Ghana have traditionally and increasingly over the last century gained importance as breadwinners (Akyeampong Reference Akyeampong, Anderson and Rathbone2000; Robertson Reference Robertson, House-Midamba and Ekechi1995). Moreover, many women in Ghana have enjoyed high status in their occupation as food traders, since women have been not only petty traders, but also wealthy and politically influential and large-scale traders.
In Ghana one can observe four main gendered consequences of informalisation. First, the definition of the food trade as a feminine activity is becoming more blurred as unemployed young men, lacking other opportunities, mingle with female hawkers in the streets, and even (though, as we shall see, only rarely) appear in the marketplaces (Clark & Manuh Reference Clark, Manuh and Gladwin1991: 228). Second, since the barriers against women's entry into formal employment are higher than ever (Manuh Reference Manuh and Sparr1994: 69), female traders face competition not only from men but also from the women who previously either earned their own wages or were provided for by wage-earning husbands. Third, the consequent overcrowding in women's informal economic domains is combined with their customers' reduced purchasing power, which means that their profit potential is reduced. And, finally, when husbands are unemployed or underemployed, a high proportion of women's earnings are spent on household expenses instead of being accumulated and used as investment and working capital. Unlike in many other African countries, the consequence of structural adjustment is thus not primarily that Ghanaian women are forced to enter the informal labour market (since they were already highly present there), but that their incomes are reduced and that they can rely on male support to an even lesser degree than before.
This article provides insight into what happens when occupations defined as ‘female’ are perceived as alternative activities for a growing number of men. It argues that norms regarding gender-appropriateness of occupations are negotiable in response to changes in the politico-economic environment. The following section describes the historical process through which certain types of trade became naturalised as ‘female’ in Ghana. Against this backdrop, the third section analyses a survey of the working and living conditions of 100 informally employed women and men in Accra. In the fourth section, women and men's adaptation of strategies within current socio-cultural boundaries and economic constraints is discussed, forming the basis for the conclusion in the last section.
THE GENDERING OF GHANA'S INFORMAL ECONOMY
Informality
The anthropologist Keith Hart (Reference Hart1973) studied economic strategies among slum dwellers in Nima in Accra in the 1960s and coined the term ‘informal economy’, identified as ‘the mass of economic transactions that takes place beyond effective state control’ (Hart Reference Hart2000: 98). There has been much debate about the content of this concept, which covers a range of various types and scales of activities. According to Hansen & Vaa (Reference Hansen, Vaa, Hansen and Vaa2004) informal economic activities, regardless of form, have in common that they are unregulated and largely untaxed. Here, the concept is widely defined, and is not limited to include only small-scale and marginal activities. In Ghana today, it is difficult to distinguish between formal and informal activities, and relations between the state and informal enterprises are full of paradoxes.Footnote 3 Self-employed people may register their enterprises without paying taxes. Conversely, unregistered traders in marketplaces have often been heavily taxed, and even untaxed activities are usually under some kind of government influence through payment of fees, police control and exclusion from particular areas. Most of the activities of the self-employed thus take place at the formal–informal interface (ibid.). For Ghanaians, the categories of formal and informal sectors are rather abstract, as they have always combined incomes from both sectors according to their needs.
In 1990, the informal sector's share of total employment in Ghana was estimated to be 45% (Ninsin Reference Ninsin1998: 28). In 1997, a survey found that the proportion had increased to 89% (Yankson et al. Reference Yankson, Lareya, Aryeetey and Sawyer2001: 30). It is not clear whether these surveys have used the same definition of informality, but all studies indicate that informal employment escalated in the 1990s. When it comes to female employment, women are generally economically active (80·7% compared to 84·0% of men), and about 80% are informally employed, primarily in sales/services (ISSER 2002: 110, see also Bortei-Doku Aryeetey Reference Bortei-Doku Aryeetey and Aryeetey2000). Thus, the most common occupation for a woman is to be a self-employed trader.
In Ghana, the interplay between cultural norms promoting women's duty as mothers and food-providers on the one hand, and the interest of foreign capital, colonial powers and governments in women's participation in the economy on the other, have helped to create gender ideologies where certain types of trade are regarded as appropriate occupations for women. This dynamic process is examined next.
The social and economic construction of women's trader role
The important role of women in trade in Ghana is rooted in a cultural construction of gender where ‘men's and women's economic functions were separate but complementary’ (Robertson Reference Robertson1984: 13). Kalu (Reference Kalu1996) refers to this principle, found in many West African societies, as a ‘gender duality discourse’, resulting for example in a tendency to have parallel female and male political institutions (Moran Reference Moran1990; Okonjo Reference Okonjo, Hafkin and Bay1976). Gender duality also legitimises a division of labour where men are in charge of food cultivation (though often delegating the labour to women), while women are responsible for the sale of surplus production in order to fulfil their nurturing maternal role (Clark Reference Clark2000; Overå Reference Overå1998).
Early European reports from the Guinea coast describe women's centrality in local trade. In 1602, a Dutch trader wrote about coastal women carrying fish ‘at least an hundred or two hundred miles up into the land, for a great present … so that oftentimes, they come as heavily laden from the market as they went thither’ (Pieter de Marees, quoted in Nypan Reference Nypan1960: 2). Clearly, women were not inhibited from travelling without male guardians outside their communities to carry out economic transactions. Nevertheless, it was primarily men who carried out long-distance caravan trade between the interior and the coast in expensive commodities such as gold, ivory, slaves, kola nuts and kente cloth (Mikell Reference Mikell1989: 26). Only occasionally did women of privileged status participate in this lucrative trade. In urban centres on the coast, such as Elmina, Cape Coast, Accra and Keta, quite a few women accumulated wealth through marriage or concubinage with European traders (Akyeampong Reference Akyeampong, Anderson and Rathbone2000). They gained access to capital to set up their own trade or were intermediaries in international trade, including the slave trade (Greene Reference Greene1996: 74).
In 1874, the British colony of the Gold Coast was established. Colonial intervention in the markets was limited, but policies affecting the whole structure of the economy led to dramatic changes in employment and accumulation patterns (Clark Reference Clark1994: 114). The colonial system was geared towards extracting and exporting natural resources out of, and importing British manufactured goods into, the colonial territory. The European trading houses found a cheap way of distributing imported goods through the ‘passbook system’, whereby women were supplied with manufactures on credit (Robertson Reference Robertson1984: 99). Men, on the other hand, who had previously been involved in the export of slaves and gold, became agents for British firms exporting palm oil, rubber and minerals. Furthermore, many men were educated by missionaries and in British schools, and were given white-collar jobs in the colonial administration. Very few women had access to education, and those who did were ‘turned into ladies’ in line with Victorian ideas (Mikell Reference Mikell1989: 66). Women thus did not acquire the qualifications necessary to enter the expanding bureaucracy, nor were they seen as fit for physically demanding waged work in the mines. From its beginning, then, the ‘formal sector’ emerged as a career avenue for men, whereas the ‘informal’ trade in food and imports became a female arena.
By 1910 the Gold Coast had become the world's largest producer of cocoa (Berry Reference Berry1993: 71), produced largely by individual male farmers aided by family labour and hired migrant labourers.Footnote 4 Though women were seldom remunerated for labour carried out on their husbands' cocoa farms, they often produced food for family consumption and for sale (Mikell Reference Mikell1989: 92). During this period, increasing amounts of cash circulated among cocoa farmers and the growing urban populations. This boosted women's opportunity for trade. Trading was a culturally legitimate way for women to earn money and corresponded to colonial capitalist interests. Gradually women became involved in long-distance trade, as the construction of paved roads after 1901, of railways in the mid-1920s, and of the first artificial harbour in Takoradi in 1926, revolutionised the transportation system (see Ninsin Reference Ninsin1991).
As women became more numerous and ‘professional’ as traders, they also became more organised. For example, the present organisation of the marketplaces with a ‘commodity queen’ for each commodity group emerged in the early 1900s, and gradually became institutionalised between the 1930s and 1950s (Clark Reference Clark1994: 251). However, ‘the increasing female predominance in marketplaces corresponded to an accelerating marginalization of market traders and of women, in a mutually reinforcing pattern’ (ibid.: 325). Thus while quite a few female traders became rich, and some of them also politically influential, the large majority remained petty traders. Nevertheless, as men's real wages gradually declined in the 1930s, women's financial help was increasingly needed (Akyeampong Reference Akyeampong, Anderson and Rathbone2000: 227).
Ghana gained independence in 1957, with industrialisation high on the agenda (Ninsin Reference Ninsin1991). Because of women's lack of education, parastatal industries mostly employed men. Despite this, the female economic participation rate in urban areas increased from 56% in 1960 to 77% in 1984, which means that almost every woman became a full- or part-time trader (Yeboah Reference Yeboah1998). In 1970, 84·6% of those employed in the commercial sector were women, and 98·5% of these were traders (Ewusi Reference Ewusi1987: 14). Between 1966 and 1981, Ghana went through ten changes of government, including four military coups d'état, and the economy deteriorated (see Hilson & Potter Reference Hilson and Potter2005). Food trade largely remained a female domain, but the class differences between the top and the bottom of the ‘female trading hierarchy’ increased (Robertson Reference Robertson1984: 121). During the early 1980s, the economic situation was so bad that people starved, and the crisis culminated in 1983, when crops failed due to drought and one million Ghanaians illegally living in Nigeria were deported back into Ghana's crisis-ridden economy (Pellow & Chazan Reference Pellow and Chazan1986: 81). It was at this stage that Ghana turned to the International Monetary Fund (IMF) and eventually initiated SAP.
Our survey was undertaken twenty years and three Economic Recovery Programmes (ERPs) after this crisis. In the following section, women and men's informal livelihood strategies in Ghana's still harsh economic climate are examined.
THE ACCRA SURVEY
Methodology
In February 2003 in Accra, 100 informally employed women (66) and men (34) were interviewed. The interviews were carried out either by the author in collaboration with a research assistant/interpreter from the University of Ghana (46 interviews), by the research assistant alone (38 interviews), or by the author alone (16 interviews). Some of the interviews (23, with 18 women and 5 men) were conducted in more formalised marketplaces (Makola, Agbobloshie, Kantamanto, Kaneshie, Nima and Madina), whereas the rest were conducted in semi-formal small shops, in roadside markets, kiosks and stalls, on pavements, and among hawkers.
The survey included questions on occupational biography, migration history, education, start-up capital, income, household composition, living conditions, perception of gender roles and occupations, taxation and relations with municipal authorities. It also included some open-ended questions where discussion was encouraged, and sometimes people in the vicinity of the informant took part in these. In order not to disturb the informants' work, there were often breaks during the interviews, which allowed for observation of activities, behaviour and relations. Short summaries of each day's interviews, capturing impressions and observations supplementing information recorded in the questionnaires, were written out in the evenings.
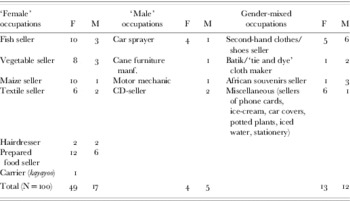
The informants were purposely selected to incorporate different categories of occupations, selling locations and income groups.Footnote 5 The relatively small sample therefore provides insight into the many-faceted nature of the informal economy. In order to focus on changes in the gendering of informal economic activities, a great deal of searching was done to find informants in gender-atypical occupations (see Table 1). Our knowledge about such occupations was gradually accumulated as this was asked for in the questionnaire, and as we observed persons in such occupations on our rounds in the city. We also interviewed key informants, such as marketplace administrators and tax collectors.
Informants’ gender and occupation according to gendered occupational categories

Source: Survey conducted by author, 2003.
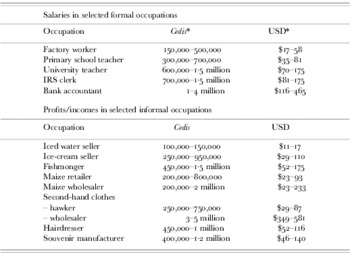
Table 2 gives an impression of the informants' range of income levels in different occupations, and compares them with salaries in the formal sector at the time. It also shows the substantial income differences between small- and large-scale traders.
Comparison of monthly incomes in formal and informal sectors

Source: Survey and fieldwork, 2003. * US$1 was 8,600 cedis in February 2003.
Gender differentiated findings
More than half of the informants (46·9% of the women and 67·6% of the men) had migrated to Accra as teenagers or adults.Footnote 6 The average number of years in business was 12·4 for the women and 5·6 for the men, and a high proportion of the informants had operated their present business for less than 5 years (34·8% of the women and 52·9% of the men). Most of these were in the 20–29 years age group. The average age was 35·6 years for women (ranging from 17 to 75 years) and 34·8 years for men (ranging from 22 to 76 years). The men had slightly more education than the women (Table 3). The sample thus concurs with the picture described in the introduction of an urban economy in which many young people seek employment, in particular young male migrants and so-called school-leavers.
Educational level (in percentages, number of informants in brackets)

Source: Survey, 2003.
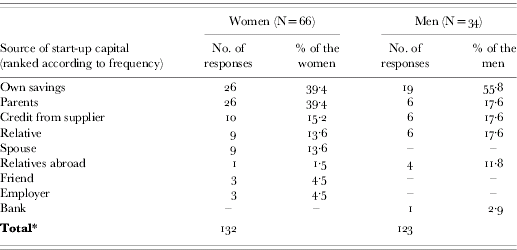
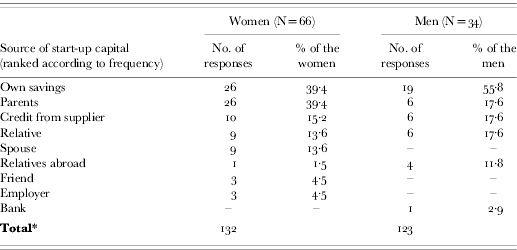
For both male and female informants, their own savings were the most important source of start-up capital (Table 4). For women, parental support was equally important. The amounts were often not more than the sum required to buy some cooking utensils or a bag of maize, but they helped a daughter ‘start her own’ through training and some initial funding. Another common strategy was to obtain inputs on credit from a supplier, for example fish or cloth, which was repaid when the goods were sold.Footnote 7 Loans from relatives were common for both men and women. Some women reported receiving start-up capital from their husbands, whereas no male informant admitted to having received such money from his wife. Very few informants had heard about micro-credit schemes, and none had obtained loans from such sources. Only one informant had obtained a bank loan (a fire officer supplementing his wages by selling of batik cloth). For most informally employed people, loans from formal institutions are out of reach.
Sources of start-up capital
Source: Survey, 2003.
* Since many informants mentioned more than one source of capital, the total numbers of responses and percentages exceed 100.
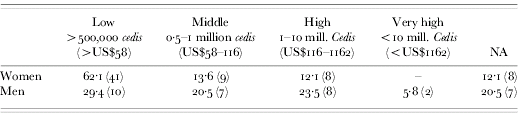
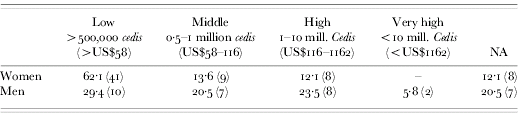
As Elson (Reference Elson1999) points out, women's lack of access to credit limits the size of their enterprises and therefore their profit potential. Our findings indicate that men often started with more capital than women (Table 5), and that they earned higher incomes (Table 6). Men also diversified their businesses more than women. Among the women in the sample, 58 (87·9%) operated one business and the rest (12·9%) operated two, whereas 22 (64·7%) of the men operated one business, 10 (29·9%) operated two, and two (5·8%) operated three. Lack of capital among the women can be one factor explaining this gender difference in business diversification, but time constraints due to family responsibilities are probably equally important.
Level of start-up capital (in percentages, number of informants in brackets)
Source: Survey, 2003.
Average daily profit (in percentages, number of informants in brackets)

Source: Survey, 2003.
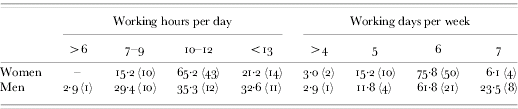
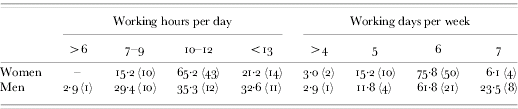
Table 7 shows that most of the women work 10–12 hours a day and have one day off per week. Men work both shorter and longer hours than women, and more men work late into the night and seven days per week. Thus, even if men do not necessarily earn more per hour than women, they have more flexibility than women in how to dispose of their time, and thus are able to compensate for low turnover and profits by working longer hours.
Time spent at work (in percentages, number of informants in brackets)
Source: Survey, 2003.
It is mainly child care and cooking duties that limit how much of the day, night and week women can work away from home. More than half of both women and men in the sample were married; 36 of the informants were monogamously married with an average of three children; 16 were polygynously married with five or six children. Of those not married, a large proportion of the men were single (41·2%). Of the unmarried women, only 18·2% were never-married, whereas (unlike any of the men) 15·2% were widowed and 7·5% were divorced. Of the women, 53 (80·3%) had children and 23 (43·4%) of these had children below school age in need of day care. Nearly half of these (11 or 47·8%) had female relatives looking after their children; five had hired help at home; four took the children along while working; two were helped by neighbours and one by a 20-year-old son. In comparison, 24 (70·6%) of the men had children, of whom most (21 or 87·5%) had small children. In 15 cases (71·4%), the wife (or the mother of the child) looked after the children; three were helped by female relatives; one by a neighbour; and one man's child was in a crèche. None of the men looked after their children themselves while at work. Clearly, whereas having small children does not prevent men from working, women (unless they get help from relatives or can afford to pay for childcare) either do not work outside the home, or do so with the extra burden of taking their children along.
With regard to dependants, 25 (37·9%) of the women and 18 (52·9%) of the men supported their parents, usually by sending money home. Six (9·1%) of the women and none of the men supported grandchildren, while six (9·1%) of the women and five (14·7%) of the men supported siblings. Six (9·1%) of the women and six (17·6%) of the men supported nephews/nieces, and seven (10·6%) of the women and one (2·9%) of the men supported ‘other relatives’ (such as in-laws). Four women (6·1%) put their husbands in the category of dependant (e.g. unemployed or retired), whereas nine (26%) of the men categorised their wives as dependant (e.g. housewife). Interestingly, except for one Ga man, who was married to a Muslim woman from northern Ghana, all the other eight men categorising their wives as dependants were Muslims.
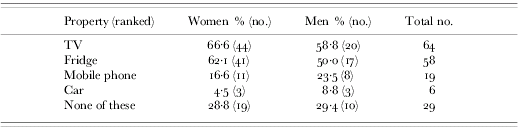
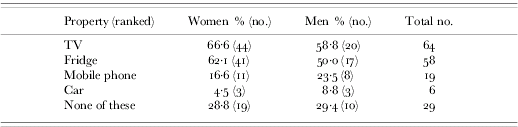
So how do women and men spend their money? There were no dramatic gender differences in possession of ‘luxury items’ discernable in our survey (Table 8). Very many mentioned food as a large expense; 35 of the 100 informants say that food is their biggest expense (often used as a poverty indicator). Though approximately the same proportion of women and men had little to spend on anything other than food, there was a gender difference, in that many of the men in this category were single, while the women were either married with children or supported children alone. School fees, water/electricity bills and rent came next after food. Men were expected to pay school fees and rent, whereas spouses expected to share food expenses. The husband usually gave the wife ‘chop money’ (housekeeping money) that she ‘topped up’ with her own income. Most married women said that they received ‘chop money’, but most of them also admitted that they contributed substantially to school fees and rent. In other words, their husbands' contributions were inadequate. Divorced and widowed women paid all expenses themselves, though some informants in this category also received child support from the fathers of their children. It is common to share residence with relatives, and many of the single mothers in the sample lived free of charge in ‘family houses’. But, apart from teenagers and apprentices supported by parents, the informants noted that even if they lived within an extended family context, they were still expected to cater for themselves.
Possession of ‘luxury items’
Source: Survey, 2003.
One-third of the women and 17·6% of the men saved money in rotating saving-rings or susu clubs (Bortei-Doku & Aryeetey Reference Bortei-Doku, Aryeetey, Ardener and Burman1995), usually not more than 5,000–10,000 cedis (US$0·6–1·2) per day, so for most people susu is a way of ‘storing’ money rather than saving up capital. This is however important for those whose incomes are too small to establish a bank account.
Nearly one-third of those in our sample (28·8% of the women, 32·4% of the men) were members of location-based occupational associations. These are interest organisations but they also have important social functions, and provide the members with informal insurance and social security mechanisms (see Chamlee-Wright Reference Chamlee-Wright1997). They contribute to bereaved members' funeral expenses and make donations when colleagues give birth. The associations also discuss and define the ‘rules of conduct’ which traders in an area are expected to follow. They thus protect the interests of those who are already established in an occupation or an area. For newcomers in the informal economy, it is important to follow these rules in order to be accepted. Another way of acquiring business contacts and social security is through so-called ethnic or hometown associations. None of the women but six (16·6%) of the men were members of such associations.
To sum up the survey findings, it appears that many of those who work in the informal economy earn better incomes than, for example, civil servants. The scale of operations is decisive for the profit potential, which largely depends on access to capital. The survey indicates that when men have similar levels of start-up capital to women, operate at the same scale, and work the same number of hours, they earn about the same as women. However, since women start with less capital, have heavier dependency burdens and experience more time constraints due to household duties than men, their incomes tend to be smaller. As divorcees, widows, single mothers, and even as ‘properly’ married wives, women's incomes are crucial for the well-being of their families. Under current economic circumstances in Ghana, men's inability to contribute their full share to household expenses and their simultaneous entry into women's economic domains, result in a double burden of increasing expenses and diminishing incomes for women. In the following section, selected cases of individual women's and men's career paths within this context are examined.
HOW WOMEN AND MEN GET BY
Female careers
A woman's personal strategies are important for the direction her career takes, but her prescribed and achieved support network of kinship, conjugal and collegial relations are equally important for whether she is able to create a good business. An example of a typical trader's career is that of ‘Abla’, an Ewe-speaking woman from Sogakope, born in 1948. She moved to Accra in the 1960s when she was 17 years old. She started as a yam trader and ‘earned heavy money’. Abla married a man who earned a good salary in an insurance company, and gave birth to five children. The couple lived according to the ‘ideal’ gender division of labour, whereby Abla complemented her husband's salary with her income from food trade. In the early 1980s, Abla combined her savings with a ‘gift’ from her husband and started as a maize wholesaler. At the age of 55, Abla still does the laborious work of travelling to the Brong-Ahafo and Upper Volta regions to buy maize from farmers, which gives her an average weekly income of 50–200,000 cedis. She sells her maize at the Agbobloshie market in Accra, employing one woman in her rented stall. She loves her profession, ‘especially the travelling and making of good money’.
However, Abla recalls some years that were extremely hard. In 1991, her husband lost his job. He resorted to selling car tyres for some years, but soon ‘sat down’. The male and female balance in the contribution to the household was broken. The husband was not able to make as good an income in the informal economy as Abla and, in practice, she became the only breadwinner in the house. She struggled hard, and managed to provide the family with food and clothes, and paid the school fees. As the children are now grown up (three live abroad, one studies at the University of Ghana and one lives at home), Abla regularly receives money from them, as ‘thanks for all the hard work’. This is Abla's greatest pride, and the children's contributions will also provide some security in the future.
When a support network is lacking, surviving in the informal economy is hard. ‘Agnes’, a Krobo from Odumase, had to leave Senior Secondary School because she became pregnant. In 1997, at the age of 22, she and her son moved to Accra together with her mother to help her sister in the vegetable trade. With 500,000 cedis from her parents as start-up capital, Agnes established a vegetable stand of her own outside the Madina market. After some years her mother died. Unfortunately, Agnes (now 28 years old) is not on very good terms with her sister, even though they live in the same house. Thus she has no one to rely on. Together with her now 10-year-old son, she lives with a taxi driver with whom she has a one-year-old son. The taxi driver's income is irregular as the vehicle often breaks down.
Agnes works every day of the week and takes the toddler with her. Her day starts at 3 a.m., travelling by bus about 20 kilometres to the Akwapim Hills to buy vegetables (on credit from farmers). She sells these at her stand in Madina, often until 10 p.m. The little son sleeps, eats and plays there. During school holidays her oldest son helps in buying and selling the vegetables. Agnes earns 10–20,000 cedis per day, just enough to buy food, and sometimes she saves 5,000 cedis with a susu collector. The taxi driver pays the rent but his other contributions are minimal. Agnes struggles to pay her son's school fees, and lacks capital to expand her trade. She normally does not have time to cook, so both she and the children mostly eat ‘street food’. The toddler looks malnourished, and unsurprisingly Agnes often suffers from ‘fatigue’. This case illustrates a very typical situation for women in the lower echelons of the informal economy: they work long hours and, especially those who have migrated, often lack a supportive kinship network. Agnes employs the ‘female’ strategy of combining motherhood with food trade. However, when her income is not supplemented with a complementary ‘male’ income, and relatives are not around to take care of the baby, it is hard to cope.
Many women moving to the city experience ‘downward career spirals’. ‘Lucy’ is a strong 36-year-old Krobo-speaking woman from Somanya, where she owned a kiosk selling various items. When her husband left her for another woman in 1999, Lucy moved with their two children to Accra. She started working as a helper in a ‘chop bar’ (a place where cooked food is served). However, after being bitten by a dog she was unable to work for a while. Later she obtained cloth on credit, which she attempted to sell. But, after losing money on selling cloth to customers on credit, she started selling meat pies instead. That did not work very well either, so she started hawking hard-boiled eggs with pepper (a popular snack). Lucy had no capital to invest and found it hard to earn money. Gradually the items she sold were less and less capital intensive and less and less profitable. Finally she ended up hawking iced water at a taxi stand at a roundabout. At first, only two women were selling water there but when competition hardened, Lucy and the other hawkers formed an association and decided that those who have traded the longest in this location are allowed to operate before 3 p.m., whereas ‘newcomers’ only have access to the location afterwards. They also enforce a rule that everyone takes turns sweeping up rubbish. Apart from defining their rights in relation to each other, the hawkers also try to strengthen their position in relation to the Accra Metropolitan Authority (AMA) officials known as the aabae (meaning ‘they are coming’ in Ga), who regularly chase them from the roundabout.
Lucy's daily income is only 5–10,000 cedis but she saves 4,000 cedis (US$ 0·5) per day with a susu collector. Her ex-husband pays her children's school fees; otherwise, she supports them alone. Since she has no money to rent a room, Lucy and the two children sleep in a small kiosk she has managed to build from her meagre savings. She hopes to be able gradually to start selling provisions from this kiosk. With hard work and her children becoming less dependent as they grow up, Lucy may improve her situation through her energetic though exhausting efforts. But, lacking access to capital and other forms of support, she is working against extreme odds, and is in a vulnerable position should she fall ill or meet other problems.
Male careers
Start-up capital, personal effort and a supportive network are also crucial for men. However, although quite a few men have dependants to support, a major difference from women is that they do not experience the same immediate burden of taking care of children. If they are not able to support them, they do not. Women do not have that choice.
‘Johnny’ is a 30-year-old Akyem, who after Middle School in the early 1990s could not find a job and therefore moved to Accra to help his brother selling second-hand shoes. Trade in imported second-hand clothing and shoes are amongst the most common ways the unemployed try to make a living. Johnny was trained by and worked for his brother until he had saved 100,000 cedis to start his own business. He sells second-hand women's shoes on the pavement outside the Kantamanto market in partnership with two friends, with whom he also rents a room. Sharing a daily profit of 50–150,000 cedis, the three men are not able to save any money, for as Johnny explains: ‘We make just enough money to feed and clothe ourselves. We can't even marry! We have girlfriends, but no wives.’ Johnny has two children (3 and 10 years old) by two former girlfriends. He pays the school fees of the oldest. He also supports his parents a bit. However, without access to a loan, and the pavement flooded with second-hand shoe sellers, Johnny's chances of expanding his business and supporting his dependants properly appear small. This case illustrates quite well the situation for many young men in Accra. They are not in an economic position to get married, and when they nonetheless, almost without exception, do become fathers, they are not able to support their children.
The aim of moving to Accra is of course to improve one's standard of living, and some of those who start on a small scale in the informal economy do make astonishing careers. ‘David’ (48) has made a great fortune importing second-hand clothes. Having finished Middle School, he moved from Kwahu to Accra in the late 1970s, and started selling bags and belts in the streets. He gradually expanded his business, and obtained his own kiosk from which he sold shirts. With his ‘natural skills’, as David calls his entrepreneurial spirit, he did well but his business remained on a small scale until 1988, when he received a US$10,000 loan from a brother working in Canada. This coincided with Ghana's liberalisation policies that opened up the country to foreign textiles and garment products. He registered an import company, and became one of the most influential second-hand clothes importers in Ghana. His wife has been working as a cashier in his company. He built a large house in Accra in 1996, and in 1999 he built a mansion in his home town where he spends the weekends. David's children go to college in Toronto. He is the patron of many associations.
It is a long time since David was an informal trader. He realised the ‘Ghanaian dream’ of great economic success and political influence. Paradoxically, his business has been closely linked to the informalisation process and the strategies of the many job-seekers who seek their fortunes in Accra. The economic constraints that people face in the era of liberalisation mean that cheap clothes are in high demand, while at the same time the number of those selling them also is very large. David's success has been based on new opportunities brought along by globalisation and liberalisation policies, as well as on rising unemployment and poverty caused by the very same reforms.
Thus, a more common destiny is that of ice-cream seller ‘Kofi’ (33). Kofi's parents are poor vegetable farmers in Somanya, but an uncle provided Kofi with Middle School education. However, when the uncle died the parents could not afford an apprenticeship for him. He could find no job apart from helping his parents, so in 2001 he moved to Accra where he stays with another uncle. He had saved up 200,000 cedis from vegetable sales at home, which he deposited with FanIce, the main ice-cream producing company in Ghana. They provide their distributors with bicycles with coolers on credit, and some training in keeping accounts. The bicycle sellers are mostly men (cycling is regarded as ‘too tedious’ for women). To supplement the meagre incomes from ice-cream sales, Kofi sells small meat pies and tarts, which he buys on credit from a woman who makes them at home. Kofi works from 7 a.m. to 7 p.m. and sometimes 11 p.m., but makes only 30–50,000 cedis daily. Out of this he is able to deposit 5,000 cedis into his FanIce credit account. He also sends a little home to his parents. He sees this as a temporary job, hoping – like thousands of other young men on Accra's streets – that he is on his way to something better.
CROSSING GENDER BARRIERS
Today's meagre formal job market forces men to cross gender barriers and enter female domains. Women, on the other hand, continue to have few opportunities in male domains. A small number of women cross gender barriers by doing ‘men's work’ like carrying cement and water on construction sites. But such strategies within the informal economy are mostly poverty-driven. Very few women manage to break through gender barriers motivated by personal aspirations. These are women who enter male dominated occupations in the formal sector that require higher education, such as doctor, engineer, manager and accountant, or vocational training in crafts such as blacksmith, plumbing, motor mechanics, car spraying or carpentry. Some women also go into professional sports, commercial popular music and farming for export. The crossing of gender barriers from female to male domains (in the formal and informal economy alike) remains rare, in comparison with the increasingly common strategy among men to cross over from ‘male’ (both formal and informal) employment into ‘female’ informal economic activities. Men who engage in gender-atypical occupations seldom appear to be motivated by personal aspirations towards doing ‘women's work’; they do it for lack of alternatives.
One male strategy is to recreate previously female dominated areas within service provision as new ‘male’ niches. One example is ‘check-check’, which is the popular name for fast-food stands (sometimes with seats) serving rice, spaghetti, chicken and salad, and other more ‘modern’ types of food. Young (often well-educated) men usually operate (but do not necessarily own) these stands. One reason is that the ‘check-check’ stands operate late into the night, which is considered risky for women. When new niches emerge, the association of activities with a particular gender may be less clear-cut, as for example in the trade in second-hand clothing and African souvenirs. A few men also appear among the increasing numbers of hair-braiders, expressing a personal preference for this particular profession. But, more commonly, men resort to activities within the ‘female’ food sector: retailing vegetables, hawking prepared food like meat pies or cakes, selling fried rice and stew, putting snacks like cut sugar-cane or pawpaw in small polythene bags for sale, and helping to cook in ‘chop bars’. Even in the fish trade, which on the coast is strongly associated with and dominated by women (Overå Reference Overå1998), a few young men have started retailing fresh fish on trays in the commercial city centre.
Men usually sell their wares from a basket on the ground or carry them with their hands but, as mentioned earlier, some ‘go to the extreme’ of carrying food on their heads. This is considered female, and the men who adopt this behaviour are jokingly called ‘Kojo Besia’, which means ‘a man who behaves or looks like a woman’. Some men actually make a sales gimmick out of the inappropriateness of their assumed gender role when they engage in food vending, and go so far as to dress up and act as women, in a caricature performance meant to attract customers. This is not very common, but the fact that men play with gender roles as an economic strategy can be seen as an expression of a flexible attitude towards the gendering of activities.
This pragmatism is also expressed in our informants' attitudes towards men doing women's work. Unemployment and poverty are viewed as acceptable and respectable reasons for men's performance of ‘female’ activities. A typical answer to the question of how men who do women's work are regarded is: ‘everyone has to eat’ or ‘money answers all things’. It is commonly regarded as better for unemployed men to do ‘women's work’ than to engage in criminality. When asking a man how he felt about working for his sister, selling second-hand women's underwear (of all things), he said: ‘money has no name’ (meaning ‘money has no gender’). In other words, even if men may feel embarrassed when they have to engage in ‘female’ activities and also may occasionally be looked down upon, the severity of the situation in the ‘male’ job market justifies their choice and enables men to redefine their masculinity within the norms of the local gender ideology. Another important factor is that the majority of the men who enter ‘female’ domains in the informal economy have migrated, and therefore perform their new roles out of sight of kin, mates and elders of their home towns.
When it comes to women doing ‘men's work’, people say that they ‘admire them’, that ‘they are bold and modern’, and that ‘they are respected for their hard work’. Nevertheless, many suggest that, for example, taxi driving is dangerous work for women because they risk being robbed, raped and killed, or even that they are afraid to be passengers when women drive. Women who do physically hard work and develop muscles are often called ‘macho’. Many male construction workers reportedly dislike having female colleagues, claiming that women do not work as hard as men, but still receive the same pay. Sexual harassment is also mentioned as a problem among women who work in male dominated milieus like motor workshops. There is thus a clear perception of many ‘male’ jobs being dangerous and inappropriate for women. Socio-cultural boundaries therefore appear to be narrower and less flexible when women attempt to enter male domains than vice versa.
Informalisation and overcrowding in women's economic domains is not only a gender issue: it is closely linked with class and power. In the more formalised and still female dominated marketplaces, it is difficult for newcomers to gain access. But whereas poor or recently established female traders may compensate for lack of financial capital with favourable personal connections, it is practically impossible for men to get access to a stall in the ‘female’ section of the marketplace. Gender is thus used as an exclusion mechanism to maintain the positions of the established ‘insider’ market women. As one male fish seller on High Street said: ‘My wife sells smoked fish in the market, but the women would not allow me to sell inside the market at all.’ Some men also travel to rural areas as food crop wholesalers. A female maize wholesaler complained about men paying the farmers too high prices and underbidding the market women in Accra; an eggplant wholesaler made her point clear: ‘We don't like competition from men!’. In other words, the women cannot but accept that men are wholesalers ‘on the road’ or petty traders ‘in the street’. But inside the female domain of the marketplace, the market leaders and their associations are able to maintain their stronghold.
Unlike in the 1970s and early 1980s, when Claire Robertson (Reference Robertson1984) described a polarisation between the few rich women and the majority of poor women trading on a small scale, the measureless echelon of petty traders and hawkers is now increasingly gender-mixed. Huge numbers of young and unemployed men are willing to engage in ‘female’ low-profit informal activities. Thus a process of polarisation now occurs between the ‘insiders’, who are large-scale and predominantly female traders operating from stalls in marketplaces or shops, and the ‘outsiders’, who are the increasing number of both male and female small-scale traders who lack capital, connections and legitimate locations from which to operate.
* * *
This article started by arguing that structural adjustment and informalisation have altered the way in which the urban informal economy in Ghana is gendered. The historical analysis of the gendering of Ghana's political economy showed that gender is situational: both women and men have adapted their economic participation to changing economic and political conditions. In the early 1900s trade was naturalised as a female activity space, which benefited the households of female traders as well as European colonial and capitalist interests. As a result of the informalisation of the labour market in recent decades this female space – unlike many other places, where informalisation leads to a feminisation of the labour force – is de-feminised.
In today's constrained economic circumstances when most households struggle to subsist, the ideal gender model, in which men and women perform complementary tasks, can no longer be sustained. Increasingly large numbers of women in Ghana, as elsewhere in Africa, conclude that they manage better without having to support a man or enduring the constant disappointment of not receiving the expected ‘chop money’. Perhaps one could talk about ‘failed masculinities’ and ‘strained femininities’ to describe this situation, where women's dependency burdens increase as a result of men's inability to provide their share. In the emerging gender literature on African masculinities (e.g. Miescher & Lindsay Reference Miescher, Lindsay, Lindsay and Miescher2003), men's failure to realise these expectations is often looked upon as a ‘masculinity crisis’ (see Reid & Walker Reference Reid, Walker, Reid and Walker2005: 10). In Ghana, one can definitely talk about a loss of social position among the men who are ‘sitting in the house’, and the ‘feminisation’ of poor young men who do ‘women's work’ also involves a certain loss of status. However, the gendering of economic activities is fluid. The socio-cultural boundaries that define what women and men can, should, or ought to do for a living have been and are being renegotiated as constraints – or new opportunities – appear. Our analysis of men's performance of ‘female’ occupations, and the response of the surrounding society to their behaviour, indicates that a naturalisation process similar to what happened when trade was feminised a hundred years ago is now occurring. Besides, since it is recognised in Ghana that women have accumulated wealth and power through trade and other informal economic activities, men's loss of status when doing this type of work may be smaller than in many other African countries where women's work has generally had low status.
Though men's failure to fulfil their duties is hard felt at both personal and household levels, the re-gendering of the informal economy is both a class and a gender issue. Our informants understand the links between gender and class, and view their problems through a political lens. Even though women have effectively taken over the role of maintaining their families, they do not speak of this as a gain in gender equality. Rather, they undertake a micro-macro analysis, and point out that the problems they experience at the household level, and the competition and diminishing profits they experience as traders, are related to the high rates of unemployment in the country. Women thus call for political changes that would result in better income opportunities, not least for men, so that both men and women can again fulfil their obligations in accordance with the gender duality model. This would also reverse the erosion of women's economic domains.