The victimization of women at the hands of men, in nearly every society, has been of interest to academics and researchers for many years.
The issue of sexual harassment has become highly important in contemporary societies, especially from an organizational standpoint, as women are increasingly part of workplace environments (Cunningham & Benavides-Espinoza, 2008). The potential impact of sexual harassment research is two-fold: sexual harassment has serious consequences for victims psychologically, physically, and socially; and it negatively influences organizational climate (employee satisfaction, organizational commitment, and productivity are seriously diminished by sexual harassment experiences) (Stockdale, Logan, & Weston, Reference Stockdale, Logan and Weston2009).
Although there are various approaches to defining sexual harassment, most agree that it is a psychological experience of undesired, offensive, and threatening sexual behavior in the workplace (Topa, Morales, & Depolo, Reference Topa, Morales and Depolo2008). Furthermore, all definitions have these two aspects in common: a) it involves behavior that is in some way sexual, and b) it trespasses on the dignity of the victim of the behavior. The conceptual diversity surrounding sexual harassment partly explains the difficulty of studying it. A study by the Spanish Ministry of Equality points out that sexual harassment refers not to a single behavior, but to a variety of situations: jokes about a female employee’s physical appearance or sexuality; sexually explicit images or photographs; communication of sexual and offensive content (via telephone, email, etc.); deliberate, unsolicited physical contact; persistent invitations to take part in social activities; inviting or requesting sexual favors, directly or indirectly related to one’s career trajectory, improvement in working conditions, or keeping one’s job; and behavior that seeks to abuse or humiliate a female employee on the basis of her sexuality (Ministerio de Igualdad, 2010).
Sexual harassment takes place in a “hostile work environment” (Fitzgerald, Reference Fitzgerald and Paludi1996). That is the workplace climate generated by harassing, sexual behaviors (physical or verbal) that are neither well-received nor desired by the victim, that are therefore unreciprocated, that interfere with the victim’s career, and that create an intimidating, hostile, or offensive work environment for him or her. Within a hostile work environment, the most common form of sexual harassment is that the aggressor blackmails or coerces the victim by offering professional rewards in exchange for sexual favors, or threatens possible repercussions if the victim does not give in to such demands. In the body of literature, this type of harassment has been labeled in different ways, including quid pro quo harassment, sexual coercion, sexual blackmail, and compensatory harassment (Expósito & Moya, Reference Expósito, Moya, Expósito and Moya2005).
While both men and women can be victims of sexual harassment, research findings suggest the victims of this phenomenon are overwhelmingly women, and the harassers are mostly men (Berdahl, Reference Berdahl2007). In Spain, for example, a total of 6,573 sexual crimes against women were reported in 2009. Of those, 330 involved sexual harassment behavior, according to a report by the Instituto de la Mujer [Women’s Institute] that same year on “known cases of sexual abuse, harassment, and assault.” That rate would indicate that every day in Spain, 18 sexual crimes are perpetrated against women, and of those, 0.90 are cases of sexual harassment. The situation is similar in other countries in the region. According to a study conducted by Pina, Gannon, and Saunders (Reference Pina, Gannon and Saunders2009), one in two women experience some form of sexual harassment or unwanted sexual advances in her lifetime, and according to the study by Ilies, Hauserman, Schwochau, and Stibal (Reference Ilies, Hauserman, Schwochau and Stibal2003), 58% of women reported having experienced sexual harassment.
The above findings are a testament to the fact that sexual harassment is among the most prevalent forms of sexual aggression (Pina et al., Reference Pina, Gannon and Saunders2009). However, its true incidence is hard to estimate because it is one of the least often reported crimes (Temkin & Krahé, Reference Temkin and Krahé2008). Women are frequently resistant to admitting that they have experienced sexual harassment, especially when explicitly asked (Alemany, Reference Alemany1998).
One possible cause for sexual harassment’s lack of visibility could be the attitudes people hold toward the victims, perpetrators, and aggression itself. For example, research findings have shown that tolerance of sexual harassment and proclivity toward it are positively correlated with sexist ideology, hostility toward women, acceptance of interpersonal violence, adversarial sexual beliefs, and rape myth acceptance (Walker, Rowe, & Quinsey, Reference Walker, Rowe and Quinsey1993). Generally speaking, it could be said that the more people adhere to traditional gender roles, men as well as women, the more inclined they will be to consider sexual harassment behaviors acceptable or normal. Furthermore, the more one normalizes these behaviors, the more likely he or she will be to deny their negative consequences (Quinn, Reference Quinn2002). Sakallı-Uğurlu, Salman, and Turgut (Reference Sakallı-Uğurlu, Salman and Turgut2010) found that hostile sexism predicted tolerant attitudes toward sexual harassment, and the belief that women provoke it. Hostile sexism’s role in perceptions of sexual harassment and how people evaluate it has been widely documented in the body of psychosocial literature (Wiener et al., Reference Wiener, Reiter-Palmon, Winter, Richter, Humke and Maeder2010).
With regards to attitudes toward sexual harassment, the “linkage among all of these acts of violence is the commonality of the numerous myths attached to them” (Leidig, Reference Leidig and Cox1981, p.199). Examples of such myths include believing victimization is inherent to the female gender, that women enjoy violent acts, that violent acts are only committed by male deviants, and that women exaggerate their claims. These myths’ very existence poses a serious obstacle to the visibility of the issue, and can impede behaviors that help victims (Lonsway, Cortina, & Magley, Reference Lonsway, Cortina and Magley2008).
To date, numerous authors have created instruments assessing specific aspects of sexual harassment, especially attitudes, beliefs, and tolerance toward it. The psychometric adaptations of said instruments vary; one study, for example, gauged women’s attitudes toward sexual harassment, its perpetrators, and its victims (Cowan, Reference Cowan2000). Most of these revised scales include items to tap sexual harassment myths, like the notion that women exaggerate or falsely accuse, that they enjoy and feel flattered by sexual harassment, and that harassers have little impact on their victims. That being said, these instruments have proven inconsistent, and lack specificity and clarity (Lonsway et al., Reference Lonsway, Cortina and Magley2008). Two of the most commonly used scales are the Tolerance for Sexual Harassment Inventory (TSHI) (Reilly, Lott, & Gallogly, Reference Reilly, Lott and Gallogly1986) and the Sexual Harassment Attitudes Scale (SHAS) (Mazer & Percival, Reference Mazer and Percival1989 ). The first consists of 10 items that measure attitudes toward harassment, such as: normalizing flirtatious and sexual behavior in the workplace, women’s responsibilities in heterosexual relationships, considering sex a commonly used tool to obtain positive outcomes in academic or professional contexts, and the idea that sexual intimidation is unimportant. The coefficient of internal consistency for the total scale was .78.
The SHAS (Mazer & Percival, Reference Mazer and Percival1989), meanwhile, consists of 19 items that measure respondents’ level of agreement or disagreement with statements that reflect certain attitudes toward sexual harassment. Ten of its items were taken from the TSHI (Reilly et al., Reference Reilly, Lott and Gallogly1986); of the remaining 9, 3 were created by its authors, and the other 6 by Beauvais (Reference Beauvais1986). Those 9 items measure contemporary feminist conceptualizations of sexual harassment (e.g. “Sexual harassment has little to do with power”), and other definitions of harassment (e.g. “A lot of people call normal flirtation between men and women sexual harassment”). The higher people score on this scale, the greater their acceptance and tolerance of sexual harassment, and the less they agree with feminist conceptions of what causes it. The SHAS has shown good internal consistency, with a Cronbach´s alpha coefficient of .84.
In response to certain limitations of the instruments designed to assess attitudes and tolerance toward Sexual Harassment, the Illinois Sexual Harassment Myth Acceptance (ISHMA) (Lonsway et al., Reference Lonsway, Cortina and Magley2008) was created. Its authors define sexual harassment myths as “attitudes and beliefs that are generally false but are widely and persistently held, and that serve to deny and justify male sexual aggression against women” (Lonsway et al., Reference Lonsway, Cortina and Magley2008, p. 600).
It was created using Rape Myths (Fitzgerald, Reference Fitzgerald, Koss, Goodman, Browne, Fitzgerald, Keita and Russo1994) as a framework because of similarities between the constructs of Sexual Harassment and Rape that are widely reflected in the literature. Along those lines, MacKinnon (Reference MacKinnon1979) pointed out that “economic power is to sexual harassment as physical force is to rape” (pp. 217–218). For years, several researchers have argued that behaviors like rape and sexual harassment fall onto a single continuum of male sexual aggression against women (Koss et al., Reference Koss, Goodman, Browne, Fitzgerald, Keita and Russo1994). In fact, there are many parallels between the two forms of sexual violence. Most aggressors, whether rapists or harassers, tend to be men, and the victims are usually women (Koss et al., Reference Koss, Goodman, Browne, Fitzgerald, Keita and Russo1994). This distribution reflects the underlying dynamics of the constructs of gender and power, their significance in Spanish culture, and how the two interact across different types of interpersonal (and intergroup) relationships. Analyses by Payne, Lonsway, and Fitzgerald (Reference Payne, Lonsway and Fitzgerald1999) using the Illinois Rape Myth Acceptance also drew similarities between rape and sexual harassment, suggesting these seven dimensions of rape mythology: she asked for it, it wasn’t really rape, he didn’t mean to, she wanted it, she lied, rape is a trivial event, and rape is a deviant event. Rape myths were defined by Lonsway and Fitzgerald (1994, p.134) as “attitudes and generally false beliefs about rape that are widely and persistently held, and that serve to deny and justify male sexual aggression against women.” With that in mind, and building on past research on rape myths, the Illinois Sexual Harassment Myth Acceptance was created (Lonsway et al., Reference Lonsway, Cortina and Magley2008). It is made up of 20 items with a 7-point Likert-type response format (1 = strongly disagree, 7 = strongly agree). High scores on the scale reflect greater acceptance of myths about sexual harassment. The original study reported the scale’s reliability, in the form of an internal consistency coefficient, to be .91.
The scale covers four dimensions:
Fabrication/exaggeration: This taps the belief that women make up, exaggerate, and/or invite sexual harassment. It includes 8 items, for example, “As long as a woman doesn’t lose her job, her claim of sexual harassment shouldn’t be taken too seriously.” This subscale’s internal consistency was .86.
Ulterior Motives: This measures beliefs about women’s motives for filing sexual harassment claims. It includes 5 items, like “Sometimes women make up allegations of sexual harassment to extort money from their employer.” This dimension had an internal consistency of .83.
Natural Heterosexuality: This evaluates the belief that sexual harassment is simply romantic behavior that comes naturally to men, and that women enjoy. It consists of 4 items, such as “Most women are flattered when they get sexual attention from men with whom they work.” This dimension had an internal consistency of .81.
Women’s Responsibility: This refers to the belief that the responsibility for controlling sexual harassment lies with the woman being targeted. It includes 3 items, for example, “Women can usually stop unwanted sexual attention by simply telling the man that his behavior is not appreciated.” This dimension’s internal consistency was .71.
The original study’s results revealed that the ISHMA has adequate internal consistency and showed ample evidence of external validity. Acceptance of sexual harassment myths was also positively, significantly correlated with measures of sexism, hostility toward women, and traditional attitudes about women, and significantly, negatively correlated with ideological support of the feminist movement. In other words, the more participants accepted myths about sexual harassment, the more they adhered to certain other beliefs (Lonsway et al., Reference Lonsway, Cortina and Magley2008). Numerous studies have found that sexual harassment myth acceptance is positively correlated with acceptance of interpersonal violence (Bartling & Eisenman, Reference Bartling and Eisenman1993); rape myth acceptance and hostility toward women (Cowan, Reference Cowan2000); negative attitudes toward gender equality and traditional attitudes about men, women, and their respective gender roles (Wade & Brittan-Powell, Reference Wade and Brittan-Powell2001).
In Spain, there is no instrument available, original or adapted, to measure sexual harassment myth acceptance, so it would be prudent to adapt the Illinois Sexual Harassment Myth Acceptance (ISHMA) (Lonsway et al., Reference Lonsway, Cortina and Magley2008), and then ascertain the adapted instrument’s validity. The adaptation process would also serve to expand the pool of data on the original version’s psychometric properties.
To adapt the instrument and assess the original scale’s validity, three studies were conducted. A total of 665 students and adults from the general population participated in this study, whose overarching objective was to determine the psychometric properties of the Spanish version of the ISHMA. In the first study, following a process of item translation and back-translation, data were collected on the items’ content validity, those data were statistically analyzed, the test’s dimensional structure was examined, and its reliability was analyzed in terms of α coefficient. The second study used confirmatory procedures to assess the scale’s structure in the general population. The third study generated pertinent indices of convergent validity.
STUDY 1: Psychometric Study of the ISHMA in a College Student Population
Method
Participants
A total of 339 college students (84 male and 255 female) participated in this study. They ranged in age from 18 to 51 years-old (M = 21.57; SD = 4.10), the women’s average age being 21.49 years-old (SD = 4.08) and the men’s being 21.88 (SD = 4.17).
Instruments
The Illinois Sexual Harassment Myth Acceptance (ISHMA; Lonsway et al., Reference Lonsway, Cortina and Magley2008). This scale consists of 20 items with a 7-point Likert-type response format (1= strongly disagree, 7= strongly agree). High scores reflect greater acceptance of sexual harassment myths.
Steps Taken Before Adapting the Spanish ISHMA
Item translation
Items were translated through a back-translation process (Hambleton, Reference Hambleton, Hambleton, Merenda and Spielberger2005). First, a bilingual person translated items from the source language (English) into the target language (Spanish). Next, the resulting version was back-translated (from the target language back into the source language) by a different bilingual, native speaker of both the target and source languages, with extensive knowledge of both, who was in no way involved in the first translation process. The translation’s quality was judged by how closely the end product fit the original instrument (Hambleton, Reference Hambleton, Hambleton, Merenda and Spielberger2005), and modifications were made to items where necessary.
Content validity evaluation by expert panel
To explore the questionnaire’s content validity, an expert panel was formed (Balluerka, Gorostiaga, Alonso-Arbiol, & Aramburu, Reference Balluerka, Gorostiaga, Alonso-Arbiol and Aranburu2007). The panel included six experts (three experts on scale construction and three familiar with the construct being assessed). Each was given a table of item specifications (Spaan, Reference Spaan2006) listing the semantic definition of the construct being evaluated, and those of its various components. Next, judges were presented with a list of items designed to tap each component. Their task was to judge each item’s wording per the following criteria: Belonging (which component of the construct they believed the item pertained to) and Comprehension (whether or not the item could be adequately understood: 1 = incomprehensible, 4 = easily understood). Last, the experts were provided with space to make general observations about the items and propose alternate wordings if they saw fit. Items were revised if their average scores fell below 3 on the Comprehension criterion.
In terms of items’ classification into the different theoretical dimensions (Fabrication/exaggeration, Ulterior Motives, Natural Heterosexuality, and Women’s Responsibility), if at least 4 out of 6 judges did not classify it into the same dimension, the authors revised the item in question, analyzed its possible problems, and proposed an alternate wording to better and more clearly capture the theoretical dimension. The version of the ISHMA derived from the above analyses was used throughout this research. It consisted of a total of 20 items: 8 from the Fabrication/Exaggeration dimension, 5 from the Ulterior Motives dimension, 4 from the Natural Heterosexuality dimension, and 3 from the Women’s Responsibility dimension.
Procedure
The student sample completed the questionnaire in their normal classroom, which took approximately 20 minutes. Both the verbal and written instructions guaranteed the anonymity and confidentiality of their responses. All participants voluntarily agreed to fill out the questionnaire and were rewarded with an extra 0.1 on their final course grades.
Results
Analysis of the Items themselves, their Internal Structure, and their Internal Consistency
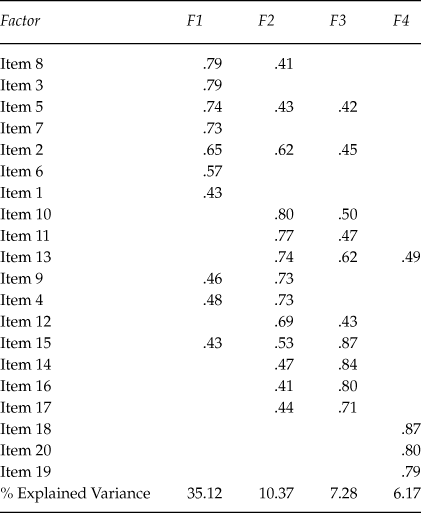
To identify the empirical factor structure of the Spanish version of the ISHMA, exploratory factor analysis was applied to its 20 items. As our method of factor extraction, we chose principal component analysis with Promax rotation, forcing the four-dimensional structure proposed by the original scale’s authors (see Table 1). Before carrying out this analysis, we computed the Kaiser-Meyer-Olkin (KMO) measure of sampling adequacy, and conducted Bartlett’s test of sphericity. This yielded a KMO index of .88 and statistically significant results on Bartlett’s test (χ2 190 = 2828.72; p < .001), leading us to conclude that factor analysis would be prudent.
Rotated Factor Structure and Portion of Variance Explained by Each ISHMA Factor (Factor Loadings Below .4 not Included)

The first factor explained 35.12% of variance. Made up of seven items, its coefficient of internal consistency was .77. Items from the original Fabrication/exaggeration theoretical dimension loaded onto this factor. The second factor, meanwhile, was made up of six items and its internal consistency was .84. It accounted for 10.37% of total variance and items from the original, Ulterior Motives dimension loaded onto it. Four items fell into the third factor, which had an alpha coefficient of .82. It explained 7.28% of variance and contained items from the original, Natural Heterosexuality theoretical dimension. The fourth factor consisted of three items. It explained 6.17% of variance, had an internal consistency of .79, and included items belonging to the Women’s Responsibility theoretical dimension.
The items’ distribution across the different factors almost perfectly fit the structure proposed by the original scale’s authors. However, there were two possible divergences from that original structure: items 2 and 4. Item 2 had very similar factor loadings on the first (Fabrication/exaggeration) and second dimensions (Ulterior Motives) (see Table 1). We decided it was best left in the first dimension because the expert judges, as well as the original test’s authors, considered it a measure of that factor. In the case of item 4, however, the authors thought it tapped Fabrication/exaggeration, but our exploratory factor analysis grouped it together with the items designed to measure Ulterior Motives, with a factor loading of .72 on that dimension compared to .48 on the first.
In the interest of clarity, factor loadings below .40 were eliminated from Table 1. That being said, some items possessed high factor loadings on dimensions other than the ones they were designed to assess. Among other things, that implied high correlations between the questionnaire’s respective dimensions (the highest were .52 between the first and second dimensions, and .57 between the second and third). That was to be expected, though, considering some of the dimensions’ conceptual similarity, and was implicitly accepted by the inventory’s authors when they reported a global internal consistency coefficient for the total scale.
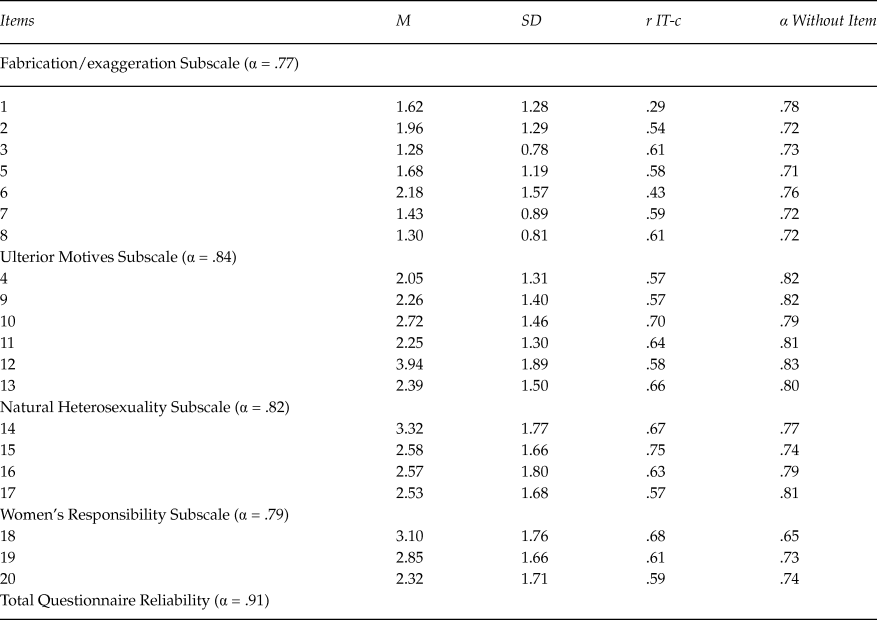
Subsequently, we evaluated each item’s discrimination index within its corresponding dimension, as well as whether or not eliminating it would increase its factor’s internal consistency (see Table 2).
Mean (M), Standard Deviation (SD), Corrected Item-total Correlation (r IT-c), Each Dimension’s Alpha, and Alpha if the Item Were Eliminated (α Without Item) (n = 339)

As Table 2 suggests, only item 1’s discrimination index fell below .30, at which point items are considered to possess good discriminating power (Ebel, Reference Ebel1965). Its discrimination index was .29, but since eliminating it scarcely boosted the dimension’s internal consistency (from .77 to .78), we decided to retain it. Thus, all the original items were retained, along with the information provided by each one. All other items had discrimination indices over .43, beyond the .40 cut-off point beyond which an item is said to have very good discriminating power. Table 2 also displays each item’s mean and standard deviation within its corresponding dimension.
STUDY 2: Confirmatory Factor Analysis in the General Population
The original scale’s authors limited its use to college students. With this study, we aimed to determine whether or not its factor structure would hold up in the general population. If so, researchers would be totally justified in using this instrument to assess sexual harassment myths in the general population.
Method
Participants
This study had 326 adult participants from the general population (148 men and 178 women). The sample ranged in age from 18 to 83 years-old (M = 41.90; SD = 12.83), the women’s average age was 40.76 (SD = 12.19) and the men’s was 43.27 (SD = 13.46). Of those, 54.6 % had attended college, 18.7% had completed more than 2 years of high school, 12.6% had received professional training, 7.1% had attended secondary school, 4.9% elementary school, and 9% had received no formal education.
Instrument
Illinois Sexual Harassment Myth Acceptance (ISHMA). The version derived from Study 1 was utilized in this study (see Appendix 1).
Procedure
The sample was collected using non-probability, convenience sampling (Manzano, Reference Manzano, Rojas, Fernández Prados and Pérez1998) in the city of Granada, Spain. A researcher from the team went to various public establishments recruiting adults who were willing to take part in the study. He approached passersby, identifying himself as a researcher at the University of Granada and asked them to collaborate in the study. Their task was to fill out a questionnaire, then and there, that would take approximately 20 minutes of their time. Those who did not choose to collaborate were thanked for their time. Those who agreed to fill out the questionnaire were given instructions, both verbal and written, guaranteeing the anonymity and confidentiality of their responses. Participants first answered a series of sociodemographic questions (age, sex, education), then completed the Spanish version of the ISHMA.
Results
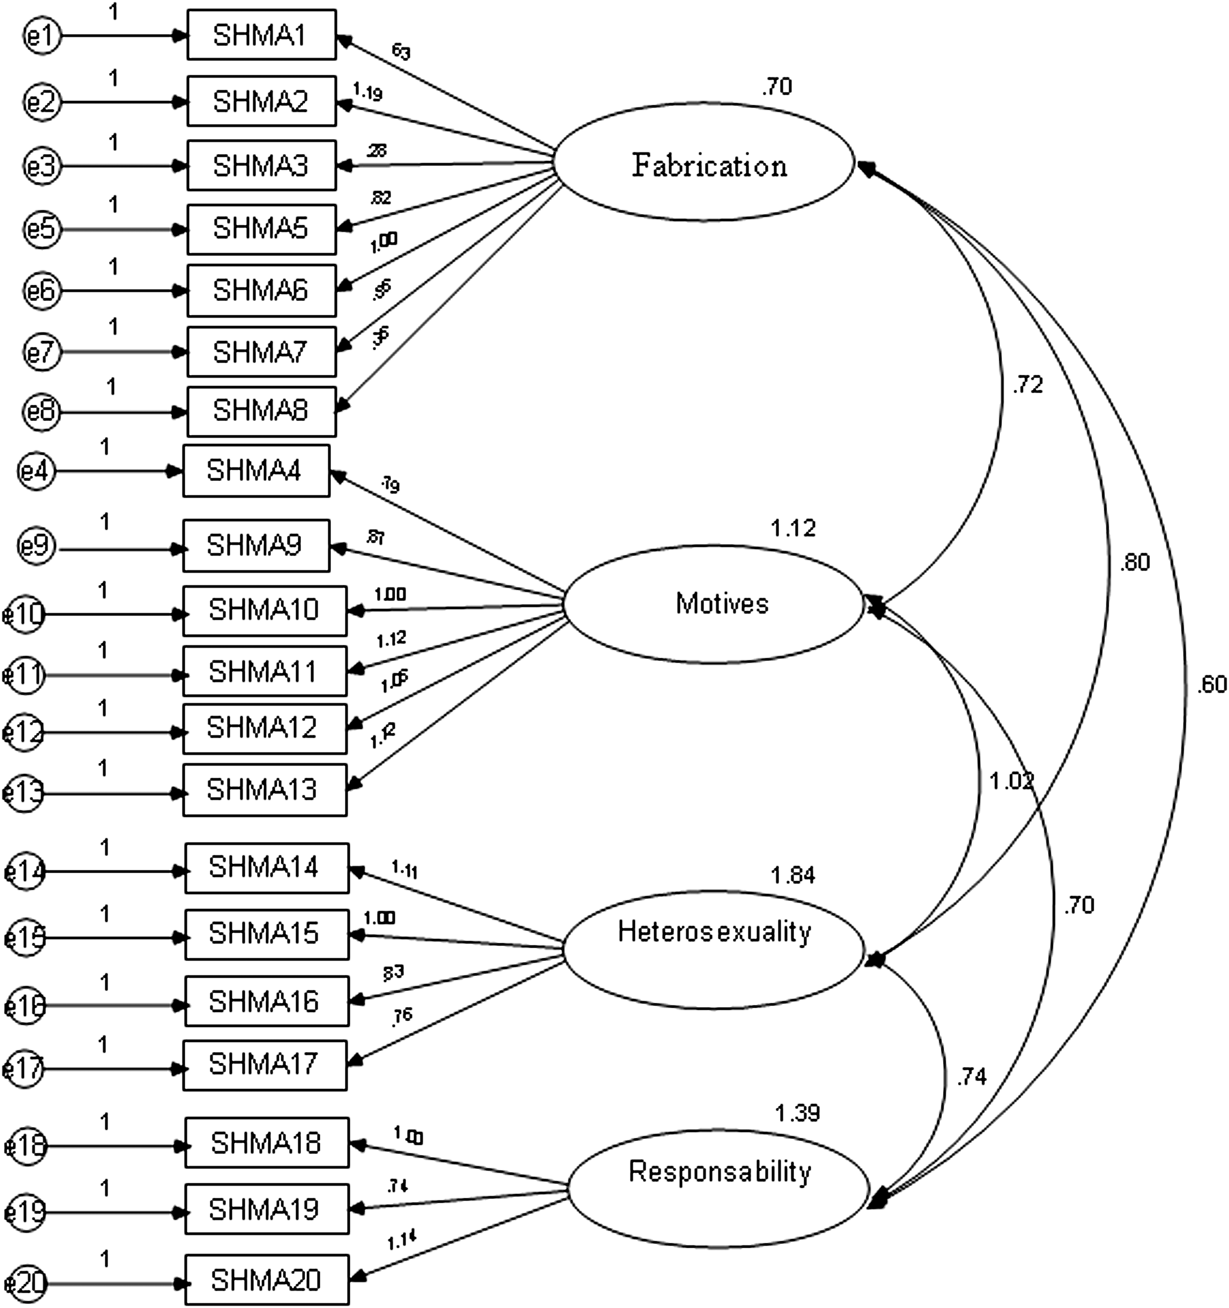
Confirmatory factor analysis was conducted using the program AMOS 16.0, which demonstrated the test’s four-dimensional factor structure in the general population (see Figure 1). Since the assumption of multivariate normality was not met, the non-linear least squares method of estimation was employed. Prior to this analysis, we carried out 2,000 Bollen-Stine bootstrappings to establish the proposed model’s goodness of fit (p = .307). After confirming the proposed model’s data fit, estimations were made using 250 bootstrappings.
Confirmatory Factor Analysis on the ISHMA in the General Population.

The goodness of fit indices for the aforementioned model were: χ2 143 = 244.860, p < .001; GFI = .952; CFI = .958; RMSEA = .034 (with a 90% Confidence Interval of .026 on the lower limit and .041 on the higher limit). All indices reflected good data fit to a four-factor structure.
In U.S. samples, item 4 fell into the Fabrication/exaggeration dimension. To determine whether, in the Spanish case, it belongs there or in the Ulterior Motives dimension, two different models were created. In the first, it was included in the Ulterior Motives dimension, and in the second, it fell under Fabrication/exaggeration. Based on the two models’ AIC (Akaike, Reference Akaike1987) and BIC indices, we determined that the first yielded values of 390.16 and 412.59, respectively; the second, meanwhile, yielded values of 674.07 and 696.5, respectively. This means including item 4 in the Ulterior Motives dimension (as exploratory factor analysis in Study 1 suggested) made the model better capture the Spanish sample’s data (Raykov & Marcoulides, Reference Raykov and Marcoulides2000).
In light of the high correlations between the ISHMA’s different dimensions, data fit to a four-dimensional model was compared to that of a one-dimensional model. To do so, a hierarchical chi-squared test was used. The resulting value of χ2 6 = 54.71 (p < .001) showed that the four-dimensional model fit the data better than the one-dimensional model. Probably because of this high correlation some of the standardized regression coeffiecients are over 1 in magnitude (Jöreskog, Reference Jörekog1999). This result might suggest that there are a high degree of multicollinearity in the data.
STUDY 3: Evidence of Convergent Validity
To produce convergent validity evidence, we had to determine how this instrument correlates with other instruments of previously demonstrated validity and reliability.
This study’s objective was to ascertain to what extent the ISHMA is empirically aligned with other, similar measures that are often utilized.
Method
Participants
In pursuit of the above objective, and since Study 2 established that the underlying factor structure of the Illinois Sexual Harassment Myth Acceptance was the same in college students as in the general population, we decided to combine the samples from Studies 1 (college students) and 2 (general population).
A total of 665 people participated in this study (232 men and 433 women). The sample ranged in age from 18 to 83 years-old (M = 31.53; SD = 13.87). Of those, 62.4% had attended college, 21.9% had completed more than 2 years of high school, 7.6% had received professional training, 4.6% had attended secondary school, 2.4% elementary school, and 0.4% had received no formal education.
Instruments
The following questionnaires were administered:
Sociodemographic data
Age, sex, and education.
Illinois Sexual Harassment Myth Acceptance (ISHMA)
The version derived from Study 1 was utilized (see Appendix 1). The total sample’s internal consistency on the dimension Fabrication/exaggeration was .80, on Ulterior Motives .85, on Natural Heterosexuality .82, and on Women’s Responsibility .77. Those values are quite close to those obtained by the original scale’s authors.
Acceptance of Modern Myths about Sexual Aggression (AMMSA; Gerger, Kley, Bohner, & Siebler, Reference Gerger, Kley, Bohner and Siebler2007)
The Spanish version validated by Megías, Romero-Sánchez, Durán, Moya, and Bohner (Reference Megías, Romero-Sánchez, Durán, Moya and Bohner2011) was utilized. It consists of 30 items that measure acceptance of modern myths about sexual aggression on a 7-point Likert-type scale (1 = strongly disagree, 7 = strongly agree). Its internal consistency in the present study was .92, which is in line with what the cited authors reported.
The Ambivalent Sexism Inventory (ASI; Glick & Fiske, Reference Glick and Fiske1996; adapted for the Spanish context by Expósito, Moya, & Glick, Reference Expósito, Moya and Glick1998)
This consists of 22 items with a 6-point Likert-type response format (0 = strongly disagree, 5 = strongly agree). The inventory measures two types of sexism: hostile and benevolent, each made up of 11 items. The global scale had an alpha coefficient of .93; the hostile sexism subscale’s alpha was .93, and the benevolent sexism subscale’s was .85. These values are similar to what other studies have reported.
Gender Ideology Scale (GIS; Moya, Expósito, & Padilla, Reference Moya, Expósito and Padilla2006)
Comprised of 12 items with a 100-point response format (1 = strongly agree, 100 = strongly disagree), this was designed to measure people’s beliefs about the roles and behaviors men and women ought to have, and how the two sexes should interact with one another. As such, it measures traditional sexism. The higher one’s score is, the lower his or her traditional sexism. Its alpha coefficient was .92, which is similar to what other authors have reported (Moya et al., Reference Moya, Expósito and Padilla2006).
Neosexism Scale (Tougas, Brown, Beaton, & Joly, Reference Tougas, Brown, Beaton and Joly1995; Spanish version by Moya & Expósito, Reference Moya and Expósito2001)
Consisting of 11 items with a 7-point response format (1 = strongly disagree, 7 = strongly agree), this measures neosexism, which its authors define as “the manifestation of a conflict between egalitarian values and residual negative feelings toward women.” Higher scores convey more sexist attitudes. The scale’s alpha coefficient in this study was .72, which is in line with other authors’ findings (Moya & Expósito, Reference Moya and Expósito2001).
Procedure
The same procedure was used as in the two studies above, except that here, every scale participants had completed was used, along with the Spanish ISHMA, as described in Studies 1 and 2.
Results
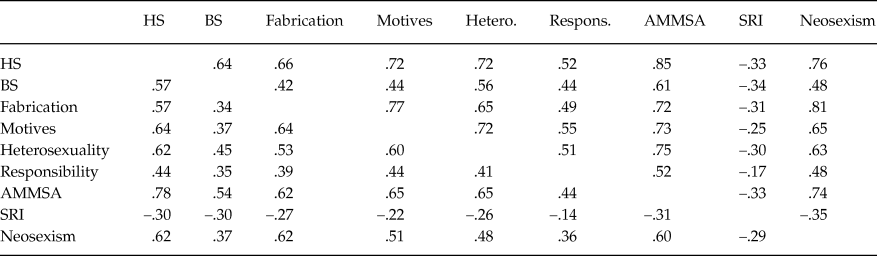
Correlations were computed between each of the ISHMA’s different dimensions and total scores on the AMMSA, scores on the ASI’s two dimensions (Hostile Sexism and Benevolent Sexism), and total GIS and Neosexism scores. Next, following the recommendations of the AERA, APA, and NCME (1999), the above correlations were corrected for attenuation to eliminate the negative effect of random measurement error using the pertinent formulas.
This paper (see Table 3) presents the original bivariate correlations (values below the table’s main diagonal), as well as corrected correlations (values above that diagonal).
Matrix of Correlations between Scores on Different Measures

Note1: HS = Hostile Sexism; BS = Benevolent Sexism; Fabrication = Fabrication/exaggeration; Motives = Ulterior Motives; Heterosexuality/Hetero. = Natural Heterosexuality; Responsibility/Respons. = Women’s Responsibility.
Note2: Values over the main diagonal are corrected correlations. All correlations are such that p < .001.
The results pointed to a high correlation in the expected direction between the ISHMA’s dimensions and scores on the various scales. Accordingly, high ISHMA scores were significantly correlated with high Hostile Sexism, Benevolent Sexism, Modern Myths about Sexual Aggression, and Neosexism scores. Conversely, the ISHMA’s different dimensions were significantly, inversely correlated with Gender Ideology Scale scores.
These results fulfilled our expectations in that on all the scales employed, scoring high meant considering gender inequality more legitimate. Meanwhile, high Gender Ideology scores indicated lower levels of traditional sexism.
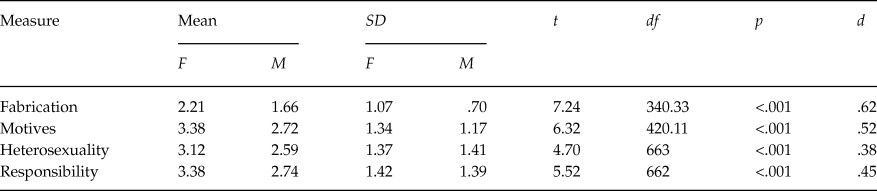
To detect potential gender differences on ISHMA scores, we carried out an independent samples t-test. Beforehand, the assumption of homoscedacity was tested using Levene’s test. We did not test for normality, however, because t-tests are sufficiently robust even when that assumption is not met. Equality of variances was observed between men and women on the dimensions Natural Heterosexuality (p = .913) and Women’s Responsibility (p = .797). On the Fabrication/exaggeration and Ulterior Motives dimensions, probabilities associated with the p < .001 and p = .023 statistics, respectively, were taken, correcting for different variances on those dimensions. Additionally, effect size was calculated using Cohen’s d. The results indicated that all differences were of a medium effect size. They also highlighted significant differences on all dimensions, the men averaging consistently higher than the women (see Table 4).
Participant Scores on the ISHMA Dimensions as a Function of Sex

Note: Fabrication = Fabrication/exaggeration; Motives = Ulterior Motives; Heterosexuality = Natural Heterosexuality; Responsibility = Women’s Responsibility. SD: standard deviation; t: t-test value; df: degrees of freedom; d: Cohen’s delta. F = female; M = male.
Discussion
The present research objective was to examine the psychometric properties of the Spanish adaptation of the Illinois Sexual Harassment Myth Acceptance (ISHMA), keeping in mind what the original authors proposed.
First, we tested the factor structure proposed by those authors. Notably, only one item (Las mujeres a menudo presentan denuncias de acoso sexual de forma frívola [Women often file frivolous charges of sexual harassment]) ended up belonging to the Ulterior Motives dimension, rather than Fabrication/exaggeration as the original authors argued. The reason that modification was needed (the expert judges agreed) had to do with the meaning of the word frívola [frivolous] in Spanish culture (inconsequential, trivial, etc.).
Next, the results revealed that the ISHMA’s various dimensions possess adequate reliability in terms of its Cronbach’s alpha coefficient, with values very similar to those Lonsway et al. reported (2008). The item discrimination indices were also more than adequate, reflecting good and very good discrimination (Ebel, Reference Ebel1965).
Confirmatory factor analysis indicated goodness of fit to the four-factor structure proposed by the original authors and obtained in previous analyses. Furthermore, applying confirmatory factor analysis in the general population allowed us to draw two distinct conclusions. Firstly, a cross-validation was carried out; we chose to conduct exploratory analysis in college students, and then confirm the findings in a sample from the general population. That provided unequivocal evidence of construct validity. Secondly, we were justified in generalizing the scale’s use to the general population (Study 2), because the structure observed in college students replicated (Study 1) the dimensional structure the original measure.
The findings described above are evidence for the ISHMA’s convergent validity, as required by the various councils on proper questionnaire use (AERA, APA, & NCME, 1999). Specifically, we demonstrated the link between Sexual Harassment Myth Acceptance and the variables Ambivalent Sexism (Hostile Sexism and Benevolent Sexism), Acceptance of Modern Myths about Sexual Aggression, Gender Ideology, and Neosexism, such that high scores on these variables – except for Gender Ideology, where higher scores meant less traditional sexism – were associated with greater acceptance of myths about sexual harassment, to which previous researchers have attested (Cowan, Reference Cowan2000; Sakallı-Uğurlu et al., Reference Sakallı-Uğurlu, Salman and Turgut2010; Wiener et al., Reference Wiener, Reiter-Palmon, Winter, Richter, Humke and Maeder2010). In other words, the correlations found between ISHMA dimensions and HS (which measures hostile attitudes toward women), Acceptance of Modern Myths about Sexual Aggression (AMMSA) (a measure of rape myth acceptance), and Neosexism (which measures new forms of sexism) were higher than the correlations between ISHMA dimensions and BS, and between those dimensions and GI. These results may be due to the fact that the ISHMA and Neosexism scales contextualize male-female relations within the occupational sphere, while BS and GI address the interpersonal sphere. Furthermore, those last measures involve apparently subtler, more positive attitudes toward women than those the ISHMA and HS cover. Then again, that could also be explained by the fact that the disparity between ISHMA and ASI scores, and between AMMSA and Neosexism scores, is greater than the disparity between ISHMA and BS scores, and ISHMA and SRI scores, implying higher correlations between the first set than the second. Similar results were reported in other scale validations, including the AMMSA (Megías et al.; 2011). Therefore, similar correlations between the ISHMA and various measures were to be expected, considering the high correlation observed in the present study between ISHMA and AMMSA scores. This study’s results reinforced past research findings on the original scale by indicating that sexual harassment myth acceptance is positively correlated with measures of sexism (Lonsway et al., Reference Lonsway, Cortina and Magley2008), rape myth acceptance (Cowan, Reference Cowan2000), negative attitudes toward gender equality, and traditional attitudes toward men, women, and their respective gender roles (Wade & Brittan-Powell, Reference Wade and Brittan-Powell2001).
Gender differences in terms of sexual harassment myths were also confirmed. Bearing in mind the definition of harassment behavior, which specifies that it be perpetrated against women by men, such that gender is a necessary condition, we were interested in exploring the views of men and women in the sample. Research findings have shown that people differ in how they perceive and evaluate situations affecting their gender that may or may not have negative connotations (discrimination, sexism, violence against women). Generally speaking, when it comes to gender violence, men have more tolerant attitudes toward it than women, less negatively appraise the consequences of such violent acts (Ferrer, Bosch, Ramis, Torres, & Navarro, Reference Ferrer, Bosch, Ramis, Torres and Navarro2006), and tend to blame the victims (women) more (Herrera & Expósito, Reference Herrera and Expósito2009; Valor-Segura, Expósito, & Moya, Reference Valor-Segura, Expósito and Moya2008). That last finding has to do with common belief in certain myths that serve to perpetuate and normalize the acceptability of behavior that discriminates against women.
Men’s and women’s responses to the ISHMA’s different dimensions confirmed that men, more so than women, sustain these myths. They scored higher on all dimensions, as comparable studies of rape myths have also reported (Megías et al., Reference Megías, Romero-Sánchez, Durán, Moya and Bohner2011).
On the whole, these results provided more than enough evidence of the ISHMA’s reliability and validity at evaluating overall acceptance of sexual harassment myths in the Spanish population.
One limitation of this research is that the samples employed were not representative. That limitation, which is practically constant in questionnaire adaptation studies, should be corrected in future studies by increasing sample size, and by sampling other regions of Spain.
Adapting the ISHMA for use in different populations could be of tremendous social import since stereotypical attitudes and beliefs about an issue often influence people’s tolerance and acceptance of it, and since that would help correctly define the issue and influence intervention guidelines, which could be adopted to resolve it.
An obvious implication of this research is that the study of sexual harassment could have positive outcomes in the organizational sector. Developing and implementing policies that promote sensitivity, prevention, and detection of potential sexual harassment situations could increase personnel’s awareness of the issue’s severity; could better protect real and potential victims, above all women, who are unprotected as long as the problem remains ill-defined; and could increase the rate at which it gets reported. All together, that could reduce the gender inequality in the workplace that precipitates undesirable situations like sexual harassment.
The availability of an instrument with these characteristics to assess sexual harassment myth acceptance, in both men and women and in several contexts, will be of great use. It enables researchers to recognize, and then modify certain, biased attitudes about sexual harassment, its causes, and its consequences.
Appendix Spanish Version of the Illinois Sexual Harassment Myth Acceptance

Las frases que aparecen a continuación tienen que ver con los hombres, las mujeres y su relación en el contexto de trabajo. Por favor lea cada frase con detenimiento y de la respuesta que mejor refleje su opinión personal en cada frase.

Dimensions: Fabrication/exaggeration: items 1, 2, 3, 5, 6, 7, and 8; Ulterior Motives: items 4, 9, 10, 11, 12, and 13; Natural Heterosexuality: items 14, 15, 16, and 17; Women’s Responsibility: items 18, 19, and 20.