

Introduction
Phytases have received significant focus from researchers for decades, and have been used commercially since the early 1990s (Cowieson et al., Reference Cowieson, Wilcock and Bedford2011). Phytate is the main storage form of phosphate in plant material. It has anti-nutritive effects in poultry, because it binds P and other nutrients and decreases their availability (Cabahug et al., Reference Cabahug, Ravindran, Bryden and Selle1999; Cowieson et al., Reference Cowieson, Acamovic and Bedford2004; Cowieson and Bedford, Reference Cowieson and Bedford2009; Beeson et al., Reference Beeson, Walk, Bedford and Olukosi2017). Ravindran et al. (Reference Ravindran, Carbahug, Ravindran, Selle and Bryden2000) were one of the first to conclude that the adverse effect of phytic acid could be overcome by supplemental phytase, resulting in improved performance of broilers. In plant-derived feed ingredients, phytate can normally be found in concentrations ranging from 5 to 25 g/kg (CVB, 2018).
The phytase enzyme hydrolyses phytic acid to inositol and inorganic P, which results in improved P utilisation (Singh et al., Reference Singh, Khatta, Thakur, Dey and Sangwan2003b). The four possible sources of phytase are intestinal, microbial (from either microflora in the digestive tract or exogenous sources) and endogenous (from plant materials). Research has shown that, although cereals and their by-products can be used in diets as exogenous sources of phytase (Barrier-Gillot et al., Reference Barrier-Gillot, Casado, Jondreville and Gatel1996), the efficacy of their use is highly variable, as poor heat stability of the enzyme restricts their use, particularly in pelleted diets (Eeckhout and De Paepe, Reference Eeckhout, De Paepe, Coelho and Kornegay1996). Additionally, it has been shown that plant phytases have a lower efficacy when compared with microbial phytases from yeast and fungi (Eeckhout and De Paepe, Reference Eeckhout and De Paepe1994), which are more heat stable and active over a wider pH range, retaining their activity within the gizzard and proventriculus (Simons et al., Reference Simons, Versteegh, Jongbloed, Kemme, Slump, Bos, Wolters, Beudeker and Verschooor1990). Consequently, microbial phytases are now more commonly used in commercial feeds. The first commercially available phytase was an Aspergillus niger 3-phytase, but in the last two decades newer 6-phytase originating from E. coli, Peniophora, Citrobacter or Buttiauxella spp. have entered the market.
Multiple studies have reported that microbial phytase improves chicken growth performance (Simons et al, Reference Simons, Versteegh, Jongbloed, Kemme, Slump, Bos, Wolters, Beudeker and Verschooor1990; Sebastian et al., Reference Sebastian, Touchburn, Chavez and Lague1996; Singh et al., Reference Singh, Khatta and Thakur2003a; Kozłowski et al., Reference Kozłowski, Jankowski and Jeroch2010; Rutherfurd et al., Reference Rutherfurd, Chung, Thomas, Zou and Moughan2012; Beeson et al., Reference Beeson, Walk, Bedford and Olukosi2017; Dersjant-Li et al., Reference Dersjant-Li, Evans and Kumarb2018), promotes the digestibility and availability of phytate-bound P, Ca, Cu and Zn and increases ileal crude protein, amino acid digestibility (Ravindran et al., Reference Ravindran, Carbahug, Ravindran, Selle and Bryden2000; Singh, Reference Singh2008; Rutherfurd et al., Reference Rutherfurd, Chung, Thomas, Zou and Moughan2012) and bone ash (Kozłowski et al., Reference Kozłowski, Jankowski and Jeroch2009; Leyva-Jimenez et al., Reference Leyva-Jimenez, Alsadwi, Gardner, Voltura and Bailey2019). Phytase supplementation has been demonstrated to allow complete, safe and economic replacement of dietary inorganic phosphorus, reducing feed costs by improving FCR (Singh et al., Reference Singh, Khatta and Thakur2003a, Reference Singh, Khatta, Thakur, Dey and Sangwanb). The effect of supplementing microbial phytase does, however, depend on its inclusion rate, form of the diet, bird age and genotype, and nutrient content of the diet (Singh, Reference Singh2008). However, it has been acknowledged that the source and level of the phytase in feed can influence the magnitude of responses in poultry, both on performance and bone development (Walk et al., Reference Walk, Bedford and Olukosi2018; Leyva-Jimenez et al., Reference Leyva-Jimenez, Alsadwi, Gardner, Voltura and Bailey2019; Walk et al., Reference Walk, Venkata and Rama2019). However, the effect of level, source and granulometry of Ca sources has been shown to have a negative impact on phytase activity (Amerah et al., Reference Amerah, Plumstead, Barnard and Kumar2014; Delezie et al., Reference Delezie, Bierman, Nollet and Maertens2015; Dersjant-Li et al., Reference Dersjant-Li, Evans and Kumarb2018; Kim et al., Reference Kim, Li, Angel and Proszkowiec-Weglarz2018).
Acceptance of new phytases by the animal industry depends on many factors (Lei and Stahl, Reference Lei and Stahl2001). Based on the AppA2 gene from E. coli, several novel phytase variants with highly improved thermal stability have been obtained via protein engineering and analysed in a series of preliminary in vitro experiments to determine their intrinsic heat stability. Of these, three were selected for future evaluation in vivo.
The aim of the current study was to evaluate the performance in vivo of these three novel phytases on growth parameters, digestibility and bone mineralisation in broiler chickens in order to select the most promising variant for further development.
Materials and Methods
Birds
A total of 1056, one-day-old male Ross 308 broilers obtained from a commercial hatchery in Mońki, Poland were used in the study conducted at an experimental farm near Olsztyn, Poland. The trial was carried out in a commercial poultry house with an artificial lighting program, automated gas heating and forced ventilation. The lighting and heating program were conducted following the recommendations given in the Ross Production Manual (Aviagen, 2014). Temperature from d 1 to d 3 was 29-30°C which was lowered to reach 21°C at d 21 and then maintained at this temperature until the end of the trial. Chickens were housed in 96 floor pens (measuring 0.7 m2), with 11 birds in each pen. Chickens were given ad libitum access to water and feed for the duration of the trial (35 days).
Diets and treatments
Upon arrival at the farm, chickens were randomly allocated to treatments and replicates. There were eight treatment groups, each having 12 pens of 11 birds and providing a total 132 birds per treatment.
Three different phytases were produced by Huvepharma (3a Nikolay Haytov Str., 1113 Sofia, Bulgaria) and named AppAT1, AppAT2 and AppAT3. They were developed from the AppA2 gene derived from E. coli, as described in Rodriguez et al. (Reference Rodriguez, Han and Lei1999) and inserted and expressed in Komatagaella phaffii (formerly known as Pichia pastoris). For each phytase, two premixes were prepared using wheat flour as a diluent, to achieve a concentration of either 250 FTU/kg feed or 500 FTU/kg feed when the premixes were added to the feed at an inclusion level of 500 g/tonne. The eight treatment groups included a positive control (PC - sufficient in Ca and P), a negative control (NC; formulated in the same way as the PC but reduced in Ca and P), AppAT1-250 (NC + AppAT1 at 250 FTU/kg), AppAT1-500 (NC + AppAT1 at 500 FTU/kg), AppAT2-250 (NC + AppAT2 at 250 FTU/kg), AppAT3-500 (NC + AppAT2 at 500 FTU/kg), AppAT3-250 (NC + AppAT3 at 250 FTU/kg) and AppAT3-500 (NC + AppAT3 at 500 FTU/kg).
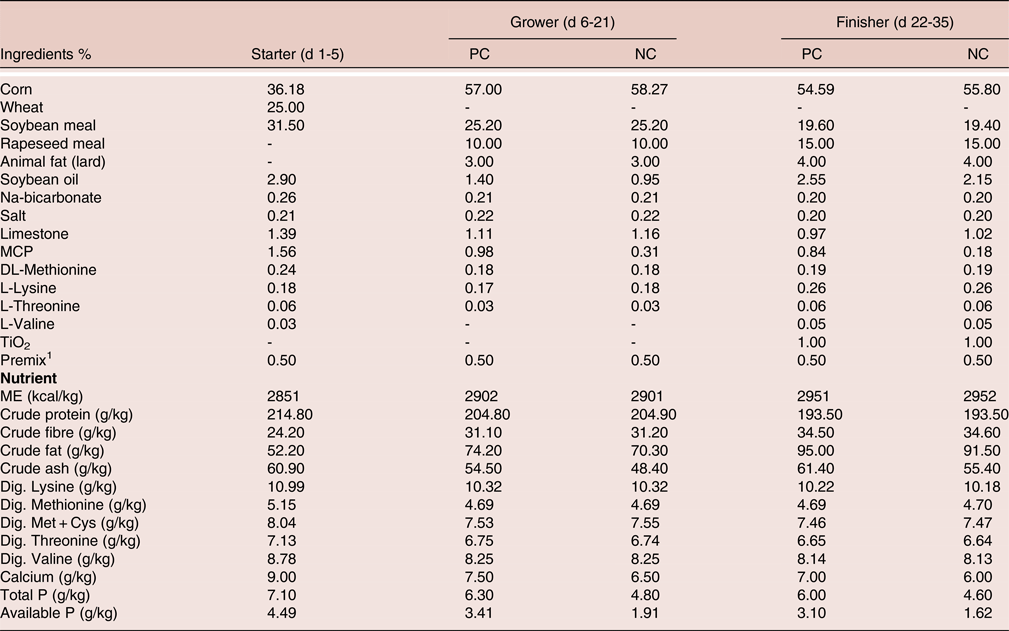
The composition and nutritional values of the basal diets, fed in pelleted form, are shown in Table 1. All diets met the nutritional requirements for broiler chicks (NRC, 1994) except for Ca and P in the NC in grower and finisher. The birds from all treatment groups received the same starter diet until d 5 to avoid early health problems in the NC group which would be expected to occur due to insufficient P intake. Following this, treatments were imposed as above during the grower and finisher phases. These diets were formulated to differ by approximately 1.5 g/kg in available P between the negative and positive control diets. Grower diets were used from d 6 to 21 and finisher diets from d 22 to 35 (end of the trial).
Composition and nutrient density of the experimental diets

PC - positive control, NC - negative control, dig - digestible, ME - metabolizable energy
1Contents per kg diet: 4800 IU vit. A; 480 IU vit. D3; 96 mg vit. E (α-tocopherol acetate); 3.6 mg vit. K3; 3 mg vit. B1; 3 mg vit. B2; 30 mg nicotinic acid; 4.8 mg vit. B6; 24 µg vit. B12; 300 µg biotin; 12 mg calcium pantothenic acid; 1.2 mg folic acid; 960 mg choline chloride; 60 mg Zn (zinc oxide); 24 mg Fe (iron carbonate); 72 mg Mn (manganese oxide); 14.4 mg Cu (copper sulphate-pentahydrate); 0.54 mg I (calcium Iodate); 0.36 mg Co (cobalt- (II)-sulphate-heptahydrate); 0.42 mg Se (sodium selenite); 1.56 g Na (sodium chloride); 0.66 g Mg (magnesium oxide)
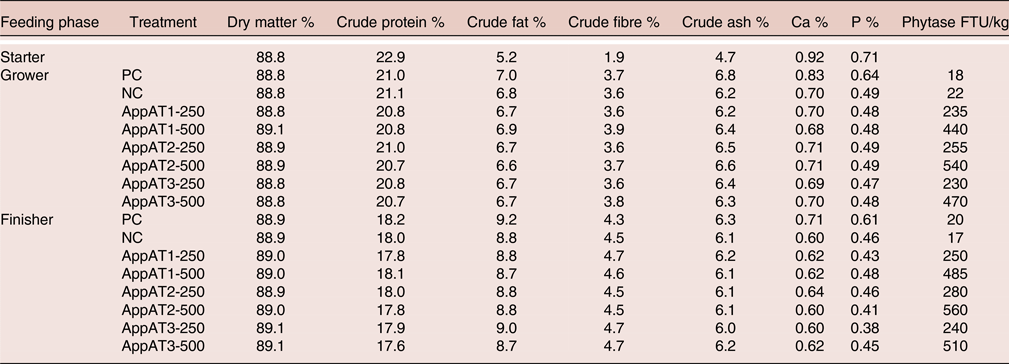
Proximate analysis was conducted using official methods (AOAC, 2012). Phytase activity was spectrophotometrically conducted by Biovet (Bulgaria) according to phytase assay EN ISO 30024 (2009). Results are indicated in Table 2.
Composition analysis and phytase activity levels in the experimental diets

Measurements
The BW of the birds was recorded per pen at d 1, 5, 21 and 35 of age and ADG was calculated. Average daily feed intake (ADFI) for the starter (d 1-5), grower (d 6-21) and finisher (d 22-35) periods were recorded and used to calculate the FCR. Bird mortality, culls or removals for other reasons were recorded. The BW of dead, culled or removed birds was used to correct the FCR.
On day 21, two birds from each pen, which were closest to the average weight, were euthanised by cervical dislocation. Their right tibias were removed, cleaned and analysed for ash (AOAC, 2012). The tibia samples from the two birds from each pen were pooled before analysis. During the finisher phase of the experiment (d 31 to 33) in the morning and afternoon, clean excreta (free from feathers, litter and feed) were collected using plastic liners placed in the excreta collection trays (trays measuring 0.6 x 0.4 m) underneath each pen. Excreta samples were immediately frozen until further analysis. For analysis, extra samples were freeze dried, ground and analysed for the indigestible marker (TiO2), dry matter, ash, Ca and P. Performing similar analysis on the finisher feeds, the apparent total tract digestibility (ATTD) of these nutrients was calculated as:
100 – (1 – (nutrient in faeces/(nutrient in feed x marker in feed/marker in excreta))) according to the method of Short et al. (Reference Short, Gorton, Wiseman and Boorman1996). All the experiments complied with the guidelines of the Local Ethics Commission (Poland) with respect to animal experimentation and the care of animals under study.
Statistical Analysis
BW (as pen means), ADG, ADFI and FCR were analysed separately by ANOVA using a randomised block to compare the eight treatment groups. Analysis of variance was performed using ANOVA and means were compared using the Tukey's test (Statistica for Windows, version 13.1). Results were considered significant at P≤0.05, and levels of significance between P>0.05 and P≤0.10 were considered strong trends.
Results
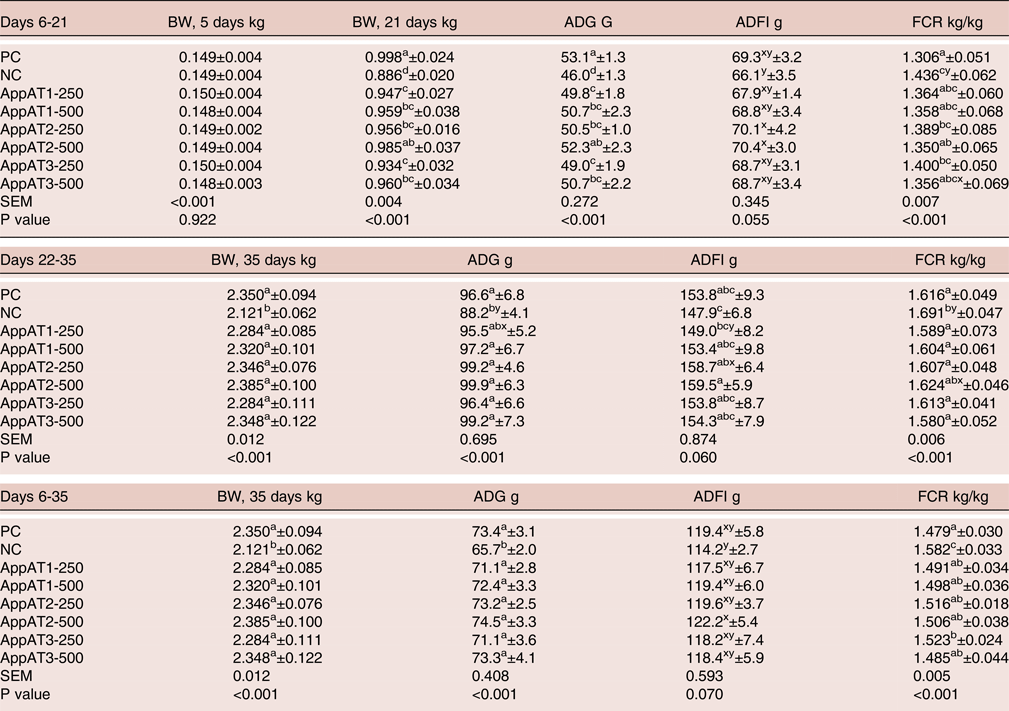
The effects of the experimental diets on performance are shown in Table 3. During the study, a total of 29 birds died. No significant differences (P>0.05) in mortality were seen between the treatment groups, which was less than 5% and mainly due to Sudden Death Syndrome and cachexia (data not shown).
Performance of broiler chickens aged 5, 6-21, 22-35 and 6-35 days old, fed diets varying in Ca and P levels, phytase variant and inclusion level

No. replicates = 96 (12 replicates of 11 birds/treatment); SEM = Standard Error Mean; BW = body weight; ADG = mean daily gain; ADFI = mean daily feed intake; FCR = feed/gain. Values in same columns with no common superscript (a, b, c, d) are significantly different (P<0.05), and with x, y, z 0.05<P≤0.10 are considered as a near-significant trend. * SEM and P value after arcsine transformation of liveability percentages
Body weight and average daily gain
There were significant (P<0.05) differences in BW at d 21, with birds in the PC group being heavier (0.998 kg) than those in the NC group (0.886 kg) and in five out of the six phytase supplemented groups (AppAT1-250, AppAT1-500, AppAT2-250, AppAT3-250 and AppAT3-500; Table 3). The AppAT2-500 group had similar body weights to the PC group (0.985 kg versus 0.998 kg). Both BW and ADG were significantly (P<0.05) improved in all phytase-supplemented diet groups compared to the NC group by the end of the grower period (d 21).
During the finisher period, the ADG for the PC-fed birds and for five of the six phytase supplemented groups (all except AppAT1-250) was significantly (P<0.05) higher than the ADG of the NC group. At the end of the experiment, at d 35, the BW and ADG over the entire study period (d 6-35) were significantly (P<0.05) higher in the PC group and in all phytase fed birds compared to those in the NC group.
In early phytase feeding trials, Nelson et al. (Reference Nelson, Shieh, Wodzinski and Ware1971) recorded a 33.3% improvement in body weight gain when they added 0.4% crude phytase (from A. ficcum NRRL 3135) to a corn and soybean meal-based broiler diets containing 0.24% phytate phosphorus. Closer in response to the current data, Sebastian et al. (Reference Sebastian, Touchburn, Chavez and Lague1996) showed that 600 phytase units/kg in a low P feed increased (P≤0.05) body weight by 13.2% in males and 5.8% in females at 21 d of age, which was comparable to performance in the birds fed the normal P diet. Similar observations for increased body weight with phytase supplementation have been reported abundantly in trials with broiler chickens using different sources of phytases, at both low and high inclusion levels (Gautier et al., Reference Gautier, Walk and Dilger2018; Leyva-Jimenez et al., Reference Leyva-Jimenez, Alsadwi, Gardner, Voltura and Bailey2019).
Beeson and associates (2017) reported that body weight gain increased (P<0.01) linearly with phytase inclusion level (0, 500 or 1500 FTU/kg) in birds fed a nutritionally adequate positive control group and increased quadratically with phytase inclusion level in birds fed a negative control diet which was marginally deficient in dietary available P and Ca. Similarly, Dersjant-Li et al. (Reference Dersjant-Li, Evans and Kumarb2018) reported greater body weight gain and lower FCR (P<0.05) when phytase was supplemented at a higher dose of 1000 FTU/kg, compared to 500 FTU/kg feed, during both the starter and grower phases.
In contrast, Scholey et al. (Reference Scholey, Morgan, Riemensperger, Hardy and Burton2018) concluded that relying on phytase alone could not be recommended in grower diets unless phytase was supplied at doses of 1000 FTU/kg or more. Their results illustrated that birds fed a control diet containing no phytase had significantly higher body weight gain (P=0.001) compared to those fed diets containing 500 or 750 FTU/kg of phytase, which were low in inorganic P.
Average daily feed intake
All phytases at all inclusion levels increased ADFI in all feeding phases versus the NC. ADFI differed numerically with near-significant trends seen between treatments during the grower period (d 6-21; P=0.055), the finisher period (d 22-35, P=0.06) and the entire trial period (d 6-35; P=0.07; Table 3). The birds given AppAT2-250 and AppAT2-500 diets consumed significantly more feed than those in the NC group during the grower (d 6-21), which was, on average, more than those in the other phytase treatments. Birds from the AppAT2-500 group consumed more feed than the AppAT1-250 group, which led to better gain (2.385 kg final BW) compared to the birds fed AppAT1-250 (2.284 kg final BW). Over the entire trial period the AppAT2-500 birds consumed more feed than the NC bird, and hence the final body weight of birds of NC was the lowest for all dietary treatment groups (2.121 kg). Rutherfurd et al. (Reference Rutherfurd, Chung, Thomas, Zou and Moughan2012) reported that, over a three-week feeding trial, feed intake and corresponding weight gain was lower (P<0.05) for birds fed an unsupplemented low P diet compared to an adequate P diet. Sebastian et al. (Reference Sebastian, Touchburn, Chavez and Lague1996) reported that phytase supplementation overcame (P≤0.05) decreases in feed intake seen when feeding a low P diet. There was an increase in feed intake and corresponding weight gain (P<0.01) but no effect (P>0.05) was seen for FCR in birds fed a phytase-supplemented low P diet compared to an unsupplemented low P diet, whereby performance in birds fed the former was equal to the birds fed an adequate P diet. Delezie et al. (Reference Delezie, Bierman, Nollet and Maertens2015) found that phytase tended to increase feed intake, mainly when high levels of Ca (range 8.6 to 6.5 g/kg from starter and finisher feed respectively) were applied in the feed. At lower Ca levels (range 7.5 to 4.9 g/kg from starter and finisher feed respectively) no such effect was observed.
Feed conversion ratio
Significant differences between treatments during the grower period (d 6-21) were seen for FCR, with the NC group exhibiting the worst FCR numerically, and the PC and AppAT2-500 groups having significantly (P<0.05) better FCR compared to the NC group (Table 3). During the finisher period (d 22-35) the FCR of the birds fed the PC and all of the phytase treatment groups (except AppAT2-500) were significantly (P<0.05) lower than the FCR for the NC group. Over the entire trial period, the FCR in the PC group was significantly (P<0.05) better compared to birds in the NC and AppAT3-250 groups. All phytase treatment groups had significant improved FCR vs. the NC fed birds.
In contrast with the current findings, Sebastian et al. (Reference Sebastian, Touchburn, Chavez and Lague1996) did not see any advantages in FCR in their phytase study. This agreed with data from Simons et al. (Reference Simons, Versteegh, Jongbloed, Kemme, Slump, Bos, Wolters, Beudeker and Verschooor1990) who did not find any significant improvements in FCR in broilers fed a corn-soya bean diet supplemented with phytase. However, Walk et al. (Reference Walk, Bedford and McElroy2012) showed that, although ADFI and BW gain were not affected by Ca or phytase addition, FCR improved (P<0.05) as dietary phytase inclusion increased. Recent studies, with the latest developed commercial phytases, reported inconclusive effects of phytase on FCR, which could be linked the fact that final BW of birds fed the phytase supplemented diets was higher than the negative control group (Delezie et al., Reference Delezie, Bierman, Nollet and Maertens2015; Beeson et al., Reference Beeson, Walk, Bedford and Olukosi2017; Scholey et al., Reference Scholey, Morgan, Riemensperger, Hardy and Burton2018; Leyva-Jimenez et al., Reference Leyva-Jimenez, Alsadwi, Gardner, Voltura and Bailey2019). Hence, the published data shows varying degrees or even lack of responses to phytase addition, which probably reflects source and efficacy of the enzymes used.
Bone parameters
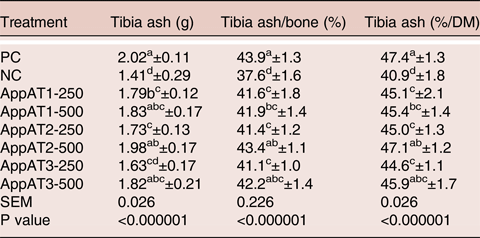
The reduced levels of Ca and P in the NC group resulted in significantly lower tibia ash content when expressed on dry matter basis (40.9%; P<0.05) compared with the PC group (47.4%; PC; Table 4). The birds fed the phytase supplemented diets had significantly (P<0.05) higher tibia ash compared to the NC birds. Those fed the AppAT2-500 and AppAT3-500 diets had statistically similar tibia ash contents to the PC birds.
Tibia ash, tibia ash per bone and tibia as percentage dry matter in broiler chickens aged 6-35 days old fed diets varying in Ca and P levels, phytase type and inclusion level

Notes: 12 replicates of two bones/treatment; SEM = Standard Error Mean; Values in same columns with no common superscript; (a,b,c,d) are significantly different (P<0.05), and with x,y,z - 0.05<P≤0.10 are considered as a near-significant trend
Walk et al. (Reference Walk, Bedford and McElroy2012) studied two levels of dietary Ca from limestone (1.03% and 0.64%) and three levels of phytase (0, 500 or 5000 FTU/kg) on broiler performance, bone ash, gastro-intestinal pH and apparent ileal digestibility of Ca, P and amino acids. They reported that tibia ash was reduced (P<0.05) from 41.4% to 40% as dietary Ca decreased but increased with phytase addition (P<0.05). Chung et al. (Reference Chung, Rutherfurd, Thomas and Moughan2013) reported that bone mineral density was increased in diets containing one of the two different phytases tested across varying inclusion levels, with an average of 9% improvement in the tibia and 13% in the femur. Cabahug et al. (Reference Cabahug, Ravindran, Bryden and Selle1999) supplemented microbial phytase in a wheat-sorghum-soya bean meal diet containing three concentrations of phytate P (2.9, 3.7 and 4.4 g/kg diet). Toe ash increased with phytase addition, but was best at the highest concentration of phytic acid, due to a significant phytic acid x phytase interaction. In addition, Gautier et al. (Reference Gautier, Walk and Dilger2018) reported increases in bone ash with the inclusion of phytase (P<0.01) at 1500 FTU/kg, as did Leyva-Jimenez et al. (Reference Leyva-Jimenez, Alsadwi, Gardner, Voltura and Bailey2019) who reported that all four of the phytase sources tested improved bone mineralisation (P<0.05) at 14 and 22 days of age. Dersjant-Li et al. (Reference Dersjant-Li, Evans and Kumarb2018) however reported that tibia ash was unaffected by the addition of phytase to a P-sufficient diet, which may have been due to a saturation of bone ash formation in the presence of adequate levels of Ca and P.
Total tract digestibility
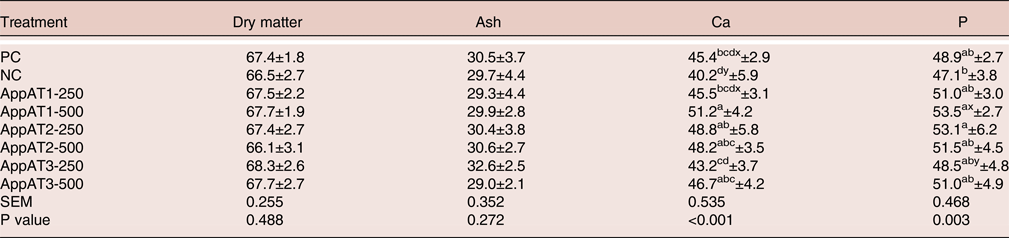
The phytase inclusion significantly (P<0.05) increased the Ca digestibility, versus the NC with the exception of the AppAT1-250 and AppAT3-250 groups (Table 5). The AppAT1-500 group showed significantly (P<0.05) higher Ca digestibility compared to birds fed the PC diet (51.2% versus 45.4%). Compared to the NC, P digestibility was improved for the AppAT1-500 and AppAT2-250 groups.
Apparent total tract digestibility coefficients in broiler chickens aged 6-35 days old fed diets varying in P levels, phytase type and inclusion level

Notes: n° replicates = 96 (12 replicates of 11 birds/treatment); SEM = Standard Error Mean; Values in same columns with no common superscript (a,b,c,d) are significantly different (P<0.05), and with x,y,z - 0.05<P≤0.10 are considered as a near-significant trend
Ravindran et al. (Reference Ravindran, Carbahug, Ravindran, Selle and Bryden2000) added phytase (400 or 800 phytase unit/kg) to wheat-sorghum-soybean-rice-pollard based broiler diets containing three levels of phytate-P (0.29, 0.37 or 0.44%). They reported improved (P<0.05) ileal digestibility of nitrogen ranging from 1.6 to 4.7% by phytase supplementation. In later work, Ravindran et al. (2008) reported increases in Ca or P digestibility when dietary phytase was supplemented into broiler diets. Sebastian et al. (Reference Sebastian, Touchburn, Chavez and Lague1996) reported improvements in P digestibility, but not Ca digestibility, when phytase was added to broiler diets. Chung et al. (Reference Chung, Rutherfurd, Thomas and Moughan2013) showed that the addition of dietary phytase increased the apparent retention of Ca, Na, Cu and ileal phytase P absorption from 32-44% across various inclusion levels. In a three-week broiler trial, Rutherfurd et al. (Reference Rutherfurd, Chung, Thomas, Zou and Moughan2012) used two levels of phytase (1000 and 2000 U/kg) in low P corn-soya bean meal diets and found that the ileal phytate-P absorption in the low P corn-soy meals was significantly (P<0.05) higher with the inclusion of phytase. Apparent ileal total P absorption and apparent total P retention were higher (P<0.05) in the phytase diets. There were no differences (P>0.05) across treatments for apparent or true ileal CP digestibility. However, there was a difference (P<0.05) across treatments in apparent ileal digestibility for all of the amino acids tested. Dersjant-Li et al. (Reference Dersjant-Li, Evans and Kumarb2018) determined that, compared to the positive control diet containing no phytase but meeting breeder's recommendations, phytase inclusion (500 or 1000 FTU/kg) generally enhanced ileal and total tract digestibility of P and to a lesser extent Ca. They reported that the ileal digestibility of P at d 10 and d 41 and of Ca at d 41 was higher in the 1000 FTU/kg phytase group compared to the diet supplemented with lower levels.
Differences in results between this study and other peer reviewed papers may be explained by the varying effects which are dependent on the inclusion rate, source of phytase, type of diet, bird characteristics and nutrient content of the diet used in the study (Singh, Reference Singh2008; Amerah et al., Reference Amerah, Plumstead, Barnard and Kumar2014).
Conclusions
Adding the three different thermostable phytase variants based on AppA2 gene from E. coli (AppAT1, AppAT2 and AppAT3) at 250 and 500 FTU/kg to the NC diet had significantly beneficial effects on BW and ADG, FCR and tibia ash content over the entire trial period (up to 35 d of age). Ca digestibility was improved in four of the six phytase supplemented groups (AppAT1-500, AppAT2-250, AppAT2-500 and AppAT3-500) and P digestibility was improved in the AppAT1-500 and AppAT2-250 groups. It can be concluded that adding the three phytase variants to a reduced Ca and P diet improved performance and bone mineralisation, bringing these parameters back to the same levels as a mineral sufficient diet. For all phytase variants, the inclusion rate of 500 FTU/kg feed gave better results on performance, tibia ash and digestibility compared to the 250 FTU/kg dose. Although differences between the three phytase variants on performance and digestibility parameters were not significant, the AppAT2 seems to be the most promising candidate for further evaluation.