Introduction
Global climate change and ever-evolving pathogens are major causes of the reduction in crop production (Meehl and Tebaldi, Reference Meehl and Tebaldi2004; Bebber et al., Reference Bebber, Ramotowski and Gurr2013; Hua, Reference Hua2013; Velásquez et al., Reference Velásquez, Castroverde and He2018; Dhillon et al., Reference Dhillon, Kaur, Das, Singh, Poland, Kaur and Chhuneja2020; Arora et al., Reference Arora, Kaur, Dhillon, Singh, Kaur, Sharma and Chhuneja2021). Temperature and rainfall fluctuations play a critical role in hindering successful crop cultivation (Dixon, Reference Dixon2012; Fischer and Knutti, Reference Fischer and Knutti2015; Hatfield and Prueger, Reference Hatfield and Prueger2015; Dubey et al., Reference Dubey, Pathak, Singh and Chakravarti2019, Reference Dubey, Pathak, Chakrabarti, Singh, Gupta and Harit2020; Sattar et al., Reference Sattar, Sher, Ijaz, Ul-Allah, Rizwan, Hussain, Jabran and Cheema2020). The extreme and unpredictable weather conditions affect crop development and do not allow present-day cultivars to achieve their yield potentials (Lesk et al., Reference Lesk, Rowhani and Ramankutty2016). The global annual temperature is increasing at a rate of 0.17°C per decade since 1970 (NCEI, 2019). This increase in temperature is assisted by a higher frequency of short-term heat shocks with an increase of ~5°C above the average temperature (Hansen et al., Reference Hansen, Sato and Ruedy2012; Hatfield and Prueger, Reference Hatfield and Prueger2015; Kaur et al., Reference Kaur, Singh and Behl2016; Balla et al., Reference Balla, Karsai, Bónis, Kiss, Berki, Horváth, Mayer, Bencze and Veisz2019; Bheemanahalli et al., Reference Bheemanahalli, Sunoj, Saripalli and Prasad2019; El Hassouni et al., Reference El Hassouni, Belkadi, Filali-maltouf, Tidiane-sall, Al-abdallat, Nachit and Bassi2019). More than 40% of the wheat yield fluctuations in temperate zones, contributing approximately 36 million ha of wheat, could be attributed to heat waves (>30°C) during grain-filling duration (GFD) (Zampieri et al., Reference Zampieri, Ceglar, Dentener and Toreti2017). The global wheat production is expected to decrease by 6 ± 2.9% with every 1°C increase in global temperature (Asseng et al., Reference Asseng, Ewert, Martre, Rötter, Lobell, Cammarano, Kimball, Ottman, Wall, White, Reynolds, Alderman, Prasad, Aggarwal, Anothai, Basso, Biernath, Challinor, De Sanctis, Doltra, Fereres, Garcia-Vila, Gayler, Hoogenboom, Hunt, Izaurralde, Jabloun, Jones, Kersebaum, Koehler, Müller, Naresh Kumar, Nendel, O'leary, Olesen, Palosuo, Priesack, Eyshi Rezaei, Ruane, Semenov, Shcherbak, Stöckle, Stratonovitch, Streck, Supit, Tao, Thorburn, Waha, Wang, Wallach, Wolf, Zhao and Zhu2015; Zhao et al., Reference Zhao, Liu, Piao, Wang, Lobell, Huang, Huang, Yao, Bassu, Ciais, Durand, Elliott, Ewert, Janssens, Li, Lin, Liu, Martre, Müller, Peng, Peñuelas, Ruane, Wallach, Wang, Wu, Liu, Zhu, Zhu and Asseng2017).
Heat stress affecting a large portion of the wheat-growing region of South Asia could reduce yields by 50% by 2050, which is 7% of the total predicted global reduction in the yield of the crop (Joshi et al., Reference Joshi, Mishra, Chatrath, Ortiz Ferrara and Singh2007; Kumar and Gautam, Reference Kumar and Gautam2014; Ali et al., Reference Ali, Liu, Ishaq, Shah, Abdullah and Din2017). Heat stress during grain-filling phase reduces the sink size causing early senescence, reduced accumulation of starch, shrivelled grains, reduced number of grains and grain weight with a yield loss of up to 40% (Sharma and Tandon, Reference Sharma and Tandon1997; Wollenweber et al., Reference Wollenweber, Porter and Schellberg2003; Balla et al., Reference Balla, Bedő and Veisz2007, Reference Balla, Karsai, Bencze and Veisz2012; Hays et al., Reference Hays, Do, Mason, Morgan and Finlayson2007; Singh et al., Reference Singh, Singh, Kang and Aggarwal2011). Yield losses of 33.6% have been reported in major Indian wheat cultivars under late sown conditions (Mishra et al., Reference Mishra, Singh, Patil, Bhusal, Malik, Sindhu and Shukla2014).
Aegilops tauschii Coss., the diploid donor to the D-genome of bread wheat, has a significant reservoir of genes related to environmental adaptability (Waines, Reference Waines1994; Valkoun, Reference Valkoun2001; Ogbonnaya et al., Reference Ogbonnaya, Halloran and Lagudah2005; Jia et al., Reference Jia, Zhao, Kong, Li, Zhao, He, Appels, Pfeifer, Tao, Zhang, Jing, Zhang, Ma, Gao, Gao, Spannagl, Mayer, Li, Pan, Zheng, Hu, Xia, Li, Liang, Chen, Wicker, Gou, Kuang, He, Luo, Keller, Xia, Lu, Wang, Zou, Zhang, Xu, Gao, Middleton, Quan, Liu, Wang, Yang, Liu, He, Mao and Wang2013; Khan et al., Reference Khan, Qazi, Rasheed and Mujeeb-Kazi2016; Kishii, Reference Kishii2019). The primary synthetic hexaploid wheats (SHWs) are extensively used as pre-breeding material. SHWs are freely crossable with wheat cultivars and have the potential to provide temperature stress tolerance. They can tolerate a temperature of up to 35–40°C during grain-filling stage (van Ginkel and Ogbonnaya, Reference van Ginkel and Ogbonnaya2007). SHW lines have a variable but better response for heat and drought stresses at the anthesis and grain-filling stages (Pradhan et al., Reference Pradhan, Prasad, Fritz, Kirkham and Gill2012).
Punjab Agricultural University, Ludhiana, India has been maintaining and evaluating a collection of Ae. tauschii accessions for various biotic stress, abiotic stress and different agronomic traits (Chhuneja et al., Reference Chhuneja, Dhaliwal, Bains and Singh2006, Reference Chhuneja, Kaur, Singh and Dhaliwal2008, Reference Chhuneja, Garg, Kumar, Kaur, Sharma, Ahuja, Dhaliwal, Characterization, Chhuneja, Garg, Kumar, Kaur, Sharma, Bains and Ahuja2010; Gupta et al., Reference Gupta, Kaur and Sehgal2010; Arora et al., Reference Arora, Cheema, Poland, Uauy and Chhuneja2019). Several SHW lines between Triticum durum Desf. and Ae. tauschii have been developed and were subjected to preliminary phenotyping, and seven high-performing SHW were selected for detailed analysis of heat stress tolerance. The present study explores the SHW lines developed at Punjab Agricultural University, Ludhiana as a pre-breeding material for heat stress tolerance.
Material and methods
Plant materials and experimental design
Punjab Agricultural University, Ludhiana harbours almost 250 accessions of Ae. tauschii which have been screened for different agro-morphological and quality characters. From this core set, seven Ae. tauschii (2n = 2x = 14) accessions, viz., pau3761, pau9809, pau14102, pau14128, pau14135, pau14170 and pau14576, with stay-green character, better grain size and cell membrane thermostability were selected to generate T. durum–Ae. tauschii synthetics by crossing with two T. durum (2n = 4x = 28) cultivars, PBW114 and PDW233 (online Supplementary Table S1). Using Ae. tauschii as the male parent, ~5000 T. durum florets were pollinated to produce triploid F1s. However, most of the triploid F1s were either male or female sterile and the F1s with normal fertility were subjected to selfing for five generations, and stable SHW lines with 2n = 42 originated from restitution nuclei were selected for the present study. In addition to this, three heat-susceptible advanced breeding lines (ABLs) of hexaploid elite wheat cultivars (2n = 6x = 42), viz., PBW343, DBW17 and HD2967 with different stripe rust and leaf rust resistance genes were used as checks to evaluate the performance of primary SHWs (online Supplementary Table S1). Each selected primary SHW and check cultivars were planted in a plot of four rows (1.5 × 0.7 m2) with the row-to-row distance of 23 cm and plant-to-plant distance of 10 cm with fertilizer and irrigation as per recommended agronomic practices. Aegilops tauschii accessions were not evaluated along with SHWs and cultivated wheat lines. The growing of wild crop germplasm requires special vernalization and photoperiod requirement. Thus, it cannot be compared with hexaploid/cultivated wheat/synthetic wheat lines. However, SHWs are similar to cultivated wheat lines and does not have vernalization and photoperiod requirement. All the wheat lines were planted in randomized block design with three replications under two regimes of sowing, i.e. timely sowing (mid-November, non-stress) and late sowing (mid-December, heat-stressed) for two consecutive years (2016–17, 2017–18) (online Supplementary Fig. S1). The two different sowing dates resulted in terminal heat stress for the late sown plants affecting flowering and majority of grain-filling period. Plants were scored for yield and associated traits namely chlorophyll content (SPAD), number of productive tillers per plant (pTN), number of spikelets per spike (SpS), days to 50% flowering (DF), GFD, plant height without awns (PH, cm), spike length without awns (SL, cm), grain length (GL, mm), grain width (GW, mm) and thousand kernel weight (TGW, g). GFD was calculated as the number of days from anthesis to physiological maturity. All the traits were recorded on five randomly selected plants from each genotype in each replication for two sowing regimes.
Statistical analysis
Best linear unbiased predictions (BLUPs), variability parameters and broad-sense heritability (h 2) for normal sown (NS), late sown (LS) environments, and combined for both the environments (NS and LS) were obtained using META-R software version 6.0 (Alvarado et al., Reference Alvarado, Rodríguez, Pacheco, Burgueño, Crossa, Vargas, Pérez-Rodríguez and Lopez-Cruz2020). The genotypic coefficient of variation (GCV), phenotypic coefficient of variation (PCV) and broad-sense heritability (h 2) for selected SHWs were estimated using the formula:
 $${\rm GCV\lpar }\percnt \rpar = \displaystyle{{\surd \delta ^2g} \over x} \times 100\comma \;$$
 $${\rm PCV}\,\lpar \percnt \rpar = \displaystyle{{\surd \delta ^2p} \over x} \times 100\comma \;$$
where δ 2g = genotypic variance, δ 2p = phenotypic variance and x = sample mean (Singh and Chaudhary, Reference Singh and Chaudhary1977). Broad sense heritability (h 2) estimate of each trait was computed according to the procedure outlined by Falconer and Mackay (Reference Falconer and Mackay1996) as:
 $$h^2 = \displaystyle{{\delta ^2g} \over {\delta ^2p}}\comma \;$$
where δ 2g = genotypic variance and δ 2p = phenotypic variance.
GCV and PCV were broadly classified in three categories, high (>20%), moderate (10–20%) and low (<10%) while h 2 is categorized in four groups, low (<40%), medium (40–59%), moderately high (60–79%) and very high (>80%) (Johnson et al., Reference Johnson, Robinson and Comstock1955; Sivasubramanian and Madhavamenon, Reference Sivasubramanian and Madhavamenon1973). The trait variation under different sowing regimes was plotted using ‘GGplot2’ version 3.2.1 and ‘GGpubr’ version 0.2.3 packages of RStudio (Wickham, Reference Wickham2016; Kassambara and Kassambara, Reference Kassambara and Kassambara2020). Pearson correlation coefficients (r) among different traits and sowing time were calculated using the cor() function in ‘stats’ version 3.6.1 package of RStudio (R Core Team, 2019) and the ‘corrplot’ version 0.84 package was used to plot the results (Wei and Simko, Reference Wei and Simko2017).
Tolerance index
Heat tolerance index (HTI) was calculated as per the formula given by Fernandez (Reference Fernandez and Kuo1992). The HTI was used to screen SHW tolerant to heat stress.
 $${\rm Heat}\;{\rm tolerance}\;{\rm index}\,{\rm \lpar HTI\rpar } = \left({\displaystyle{{Xp \times Xs} \over {Xp^2}}} \right)\times 100\comma \;$$
where Xs is the trait value of the genotype under late sown conditions, Xp is the trait value of the genotype under timely sown conditions, respectively.
Results
Among ~250 Ae. tauschii accessions maintained at Punjab Agricultural University, Ludhiana, several accessions have been found to have stay green character, a factor considered to impart heat tolerance in wheat (Kaur et al., Reference Kaur, Jindal, Kaur, Chhuneja, Gosal and Wani2018). Moreover, these accessions were also evaluated for cell membrane thermostability by Gupta et al. (Reference Gupta, Kaur and Sehgal2010) and for grain size and micronutrients by Arora et al. (Reference Arora, Cheema, Poland, Uauy and Chhuneja2019).
Analysis of variance
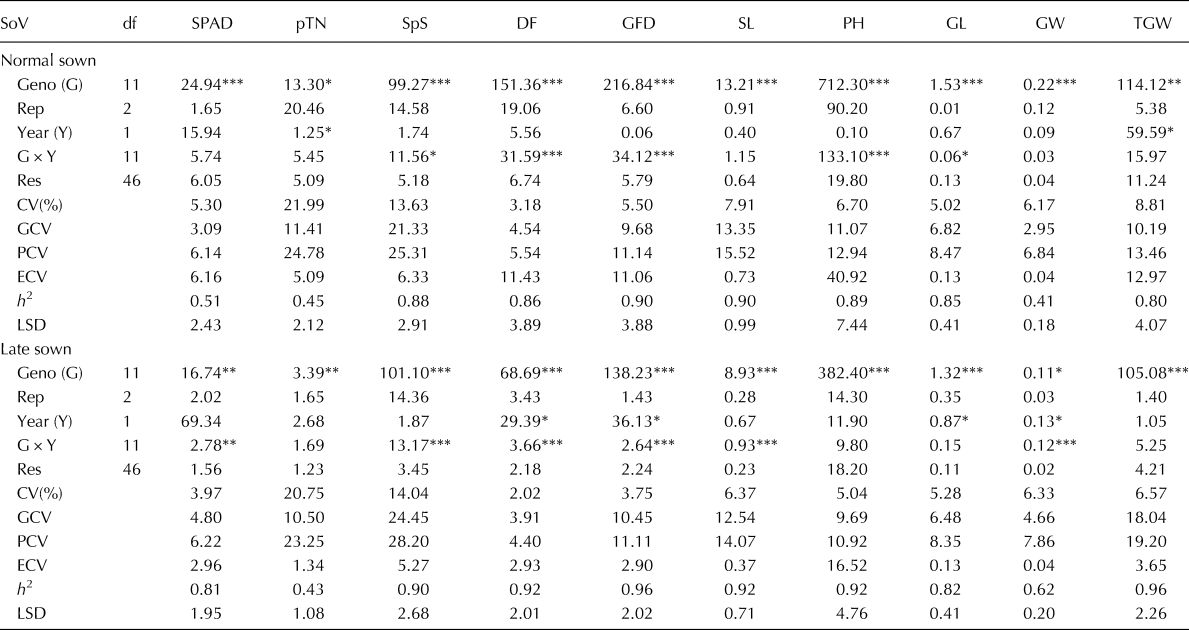
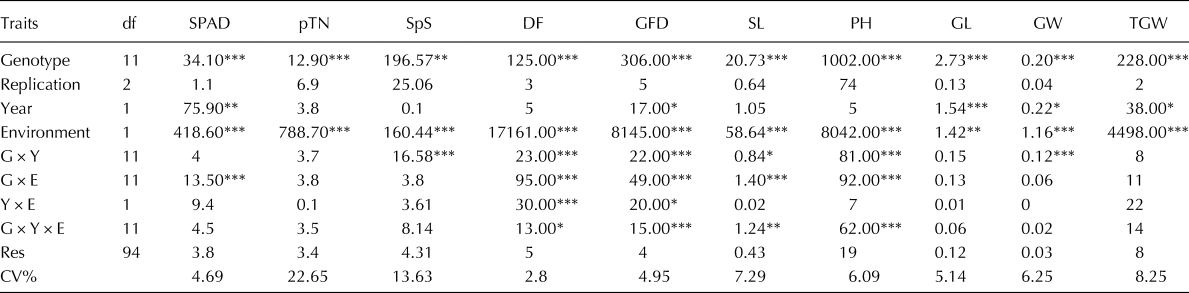
Individual (Table 1) and among different environments (Table 2), analysis of variance (ANOVA) for 10 agronomic traits contributing to yield was performed. There were highly significant genotypic differences for all traits investigated among selected lines under timely sown (NS) and late sown (LS) conditions over 2 years. However, significant seasonal differences were observed for pTN and TGW under NS condition and DF, GFD, GL and GW under LS condition (Table 1). The pooled ANOVA revealed statistically significant (P < 0.01) fixed effects (genotype (G), environment (E)) for all the traits (Table 2). The variance estimates of the different interaction (G × E, G × Y, G × Y × E) were also different (P < 0.01) from zero for most of the traits measured except for pTN, GL and GW, suggesting the presence of genetic as well as environmental variability among the selected lines for most of the traits. However, highest coefficient of variation (CV) was observed in pTN (21.99% NS, 20.75% LS) followed by the number of SpS (13.63% NS, 14.04% LS) indicating higher amounts of exploitable genetic variability among the studied SHW lines.
Analysis of variance and estimates of genetic parameters for genotypes under normal sown and late sown conditions evaluated over 2 years

G, genotype; Rep, replication; Y, year; Res, residuals; df, degrees of freedom; pTN, number of productive tillers per plant; SpS, number of spikelets per spike; SPAD, chlorophyll content; DF, days to flowering; GFD, grain-filling duration; TGW, thousand grain weight (g); SL, spike length (cm); PH, plant height (cm); GL, grain length (mm); GW, grain width (mm).
Significance codes: ‘***’ 0.001, ‘**’ 0.01, ‘*’ 0.05, ‘.’ 0.1, ‘ ’ 1.
Pooled analysis of variance for genotypes under normal sown and late sown conditions evaluated over two growing seasons

G, genotype; R, replication; Y, year; E, environment; Res, residuals; df, degrees of freedom; CV, coefficient of variation; pTN, number of productive tillers per plant; SpS, number of spikelets per spike; SPAD, chlorophyll content; DF, days to flowering; GFD, grain-filling duration; TGW, thousand grain weight (g); SL, spike length (cm); PH, plant height (cm); GL, grain length (mm); GW, grain width (mm).
Significance codes: ‘***’ 0.001, ‘**’ 0.01, ‘*’ 0.05, ‘.’ 0.1, ‘ ’ 1.
Estimation of genetic parameters
The PCV was higher than the GCV for all the traits under both NS and LS conditions (Table 1). pTN had high PCV (11.41, 10.50%) and medium GCV (24.78, 23.25%) under both NS and LS conditions, respectively. Similarly, SpS had high GCV (21.33, 24.45%) and high PCV (25.31, 28.20%) under both NS and LS conditions, respectively. SL, PH and TGW had medium GCV (10–20%) and medium PCV (<10%) under both sowing regimes. Low GCV (<10%) and PCV (<10%) was recorded for SPAD, DF, GL and GW under both sowing times.
Very high heritability (>80%) was observed for SpS (0.88), DF (0.86), GFD (0.90), SL (0.90), PH (0.89), GL (0.85) and TGW (0.80) under NS conditions (Table 1). However, under LS conditions, SPAD (0.81) also indicated high heritability. pTN reported medium heritability under both NS (0.45) and LS (0.43) conditions. However, GW had medium heritability under NS (0.41) condition but moderately high heritability under LS (0.62) condition (Table 1).
Mean performance of synthetics and elite cultivars
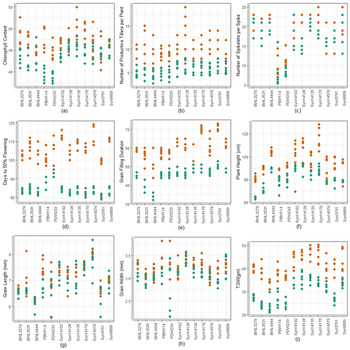
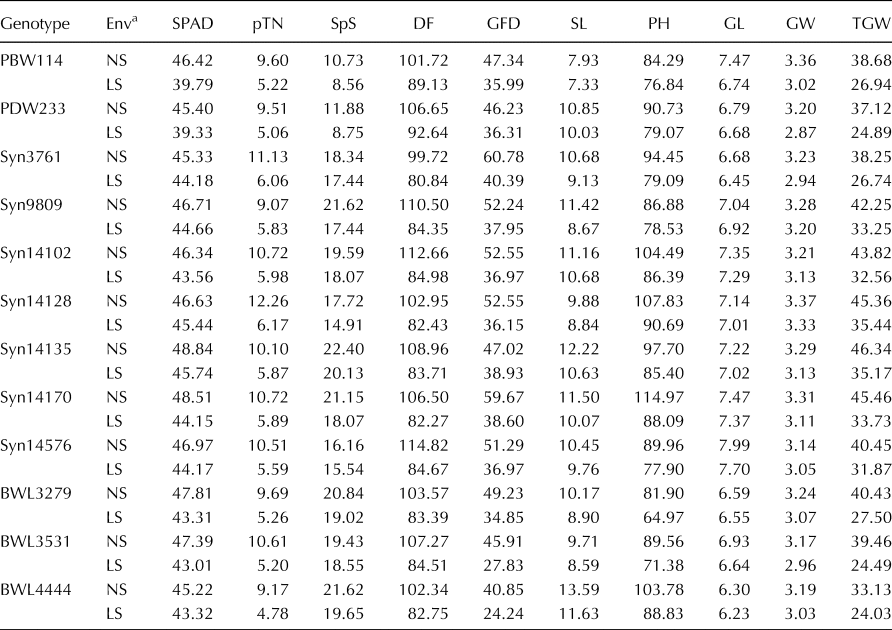
BLUPs under both timely and late sown conditions are summarized in Table 3. Overall a repressing effect of delayed planting was observed on yield and associated parameters. The average SPAD value under two environments fell into a very narrow range, with a general trend of comparatively higher SPAD value under NS than the LS condition (Table 3, Fig. 1(a)). Under NS condition, syn14135 (48.84) had the highest chlorophyll content among the SHW lines, and BWL3279 (47.81) had the highest total chlorophyll content among selected ABLs. In addition to syn14135 (48.84), syn14170 (48.51) also had higher chlorophyll content than any selected ABLs. The minimum decrease in chlorophyll content among SHW due to LS condition was observed in syn3761 (2.53%) followed by syn14128 (2.56%) and syn9809 (4.41%) which was significantly lower than the reduction in hexaploid ABLs (~9%) and durum wheat cultivars (~14%) (online Supplementary Table S2).
Variation in (a) chlorophyll content, (b) number of productive tillers per plant, (c) number of spikelets per spike, (d) days to 50% flowering, (e) grain-filling duration, (f) plant height, (g) grain length, (h) grain width and (i) thousand grain weight for synthetic wheats and ABLs under timely sown (red) and late sown (blue) conditions represented as means of observations of particular replicate.

Phenotypic performance of genotypes under normal sown and late sown conditions evaluated over two growing seasons

a NS, normal sown condition; LS, late sown condition, values represented as BLUPs.
pTN, number of productive tillers per plant; SpS, number of spikelets per spike; SPAD, chlorophyll content; DF, days to flowering; GFD, grain-filling duration; TGW, thousand grain weight (g); SL, spike length (cm); PH, plant height (cm); GL, grain length (mm); GW, grain width (mm).
The number of productive tillers per plant or spikes per plant is an essential factor determining the yield. The average number of productive tillers per plant was higher in SHWs than the selected ABLs under NS conditions (Table 3, Fig. 1(b)). Syn14128 had the maximum number of productive tillers under both NS (12.26) and LS (6.17, 49.7% reduction) conditions. Syn9809 had the lowest pTN under NS (9.07) and also recorded the minimum decrease in pTN (35.68%) under LS condition followed by syn14135 (41.84%). Among the ABLs, pTN was the least affected in BWL3279 (45.72%) under LS conditions, while the maximum reduction in spike number was observed in BWL3531 (51.03%) (online Supplementary Table S2). The average SpS ranged from 16.16 to 22.40 in SHWs under NS conditions. However, the range varied from 14.91 to 20.13 under LS conditions (Table 3, Fig. 1(c)). The maximum number of SpS was recorded in syn14135 under both NS (22.40) and LS (20.13) conditions. However, selected ABLs reported 4.57% (BWL3531) to 9% (BWL4444) reduction in the SpS. The reduction ranged from 20 to 26%, and SHWs reported a 3.79–19.33% decrease in durum wheat cultivars. Syn14576 and syn3761 experienced the least decrease in SpS (3.79 and 4.91%, respectively) under LS conditions (online Supplementary Table S2).
Further, SHWs showed an average of 18–30 d reduction in DF and 8–21 d reduction of GFD under LS conditions due to delayed sowing (Table 3, Fig. 1(d) and (e)). Syn3761 was observed to be an early flowering SHW taking the minimum number of days to reach 50% flowering stage under NS (100 d) as well as LS (81 d) conditions (Fig. 1(d)). Syn3761 along with all the other selected lines were categorized as late-flowering lines taking more than 100 d for heading under NS conditions. Under LS conditions, the selected lines took 81–85 d to reach 50% flowering stage except for PDW233, a durum wheat cultivar, which took about 93 d (Table 3). Overall, GFD in ABLs was decreased by 14 d (BWL3279) to 18 d (BWL3531) under LS conditions. In case of durum wheat, there was a reduction of ~10 d in GFD. Syn3761 also had maximum GFD both under NS (61 d) and LS (40 d) conditions with a decrease of 20.39% (Fig. 1(e), online Supplementary Table S2). Overall, minimum reduction in GFD due to heat stress under LS condition was observed in syn14135 (8.09) followed by syn14576 (14.32).
SL in SHWs varied from 9.88 cm (syn14128) to 12.22 cm (syn14135) under NS conditions and 8.84 cm (syn14128) to 10.63 cm (syn14135) under LS conditions (Table 3). However, among the selected ABLs, maximum SL was of BWL4444 under both NS (13.59 cm) and LS (11.63 cm) conditions. PBW114 had minimum SL among the selected lines under both NS (7.93 cm) and LS (7.33 cm) conditions. On an average, ~12% reduction in spike length was observed in the ABLs. But in case of SHWs, the reduction in SL was 4–24%, with minimum reduction observed in syn14102 (4.36%) followed by syn14576 (6.59%) and maximum reduction for syn9809 (24.10%) (online Supplementary Table S2).
Synthetic wheats are usually found to be tall, but only three of the SHWs, viz., syn14170 (114.97 cm), syn14128 (107.87 cm) and syn14102 (104.49 cm), were categorized as tall along with BWL4444 (103.78 cm) (Table 3, Fig. 1(f)). In contrast, rest of the SHWs (86.88–97.70 cm) along with BWL3531 (89.56 cm) and BWL3279 (81.90 cm) fell under the semi-dwarf category. However, under LS conditions, all the SHWs, durum wheats and BWL4444, showed a reduction in PH ranging from 77.90 to 90.69 cm. The maximum decrease in PH under LS conditions was observed in syn14170 (23.37%), followed by BWL3531 (20.30%) and BWL3279 (20.67%). The reduction in PH in the SHWs under LS condition ranged from 9.61% (syn9809) to 23.37% (syn14170) (online Supplementary Table S2).
Crop wild germplasm of wheat possesses a considerable variation for the GL and all the SHWs used in the present study, except syn3761, had longer grains compared to the ABLs, a character from Ae. tauschii parent. Among the selected SHW lines, syn14576 had the longest grain both under the NS (7.99 mm) sown as well as LS (7.70 mm, 3.63% reduction) condition followed by syn14170 (7.47, 7.37 mm, for NS and LS, respectively, with 1.35% reduction) (Table 3, Fig. 1(g), online Supplementary Table S2). However, a minimum decrease in GL under late sown condition was observed in syn14102 (0.82%). On the other hand, GL in selected lines varied from 6.30 mm (BWL4444) to 6.93 mm (BWL3531) under timely sown and from 6.23 mm (BWL4444, 1.14% reduction) to 6.64 mm (BWL3531, 4.19% reduction) under late sown conditions (online Supplementary Table S2). PBW114 experienced the most severe decrease in GL under LS condition (9.78%) with a decrease in GL from 7.47 mm (NS) to 6.74 mm (LS). On a similar note, durum wheats also faced a severe decrease in grain width (~10%) along with one SHW, syn3761 (9.90%) under LS condition. Among the ABLs, 4–6% reduction in GW was seen under LS condition. While most of the SHWs had better grain width than elite cultivars and durum wheat under NS and LS conditions (Table 3, Fig. 1(h)). GW in SHWs ranged from 3.14 mm (syn14576) to 3.37 mm (syn14128) under timely sown and reported a reduction of 1.07% (syn14128) to 9.09% (syn3761) under late sown conditions (online Supplementary Table S2).
The number of spikes, spikelets and grain size are the main components contributing towards thousand grain weight (TGW) and yield. TGW in selected ABLs ranged from 33.13 g (BWL4444) to 40.43 g (BWL3279) under NS condition while under LS condition it ranged from 23.93 g (BWL4444, 27.78% reduction) to 27.45 g (BWL3279, 32.09% reduction) (Table 3, Fig. 1(i), online Supplementary Table S2). However, BWL3531 experienced the maximum reduction in TGW under late sown condition (38.16%) along with the maximum reduction in pTN (51.03%), DF (21.22%) and grain size (4.19% reduction in length and 6.60% reduction in width). Durum wheat experienced an overall maximum reduction in TGW (~41%) with maximum reduction in SPAD (~14%), SpS (~25%) and grain size (~10% reduction in GL and GW). Compared to the elite cultivars and durum wheat, all the SHWs had higher TGW under normal and late sown conditions inferring that all the SHWs were better adapted under terminal heat stress. For SHWs, the minimum TGW was observed for syn3761 under both NS (38.25 g) and LS (26.69 g) conditions with a reduction of 30.23% due to delayed sowing. However, syn14135 reported a maximum TGW under NS conditions (46.34 g), while under LS conditions, it reported a TGW of 23.97 g with a reduction of 24%. Syn14128 reported a maximum TGW (35.51 g) with 21.72% reduction under LS conditions (online Supplementary Table S2).
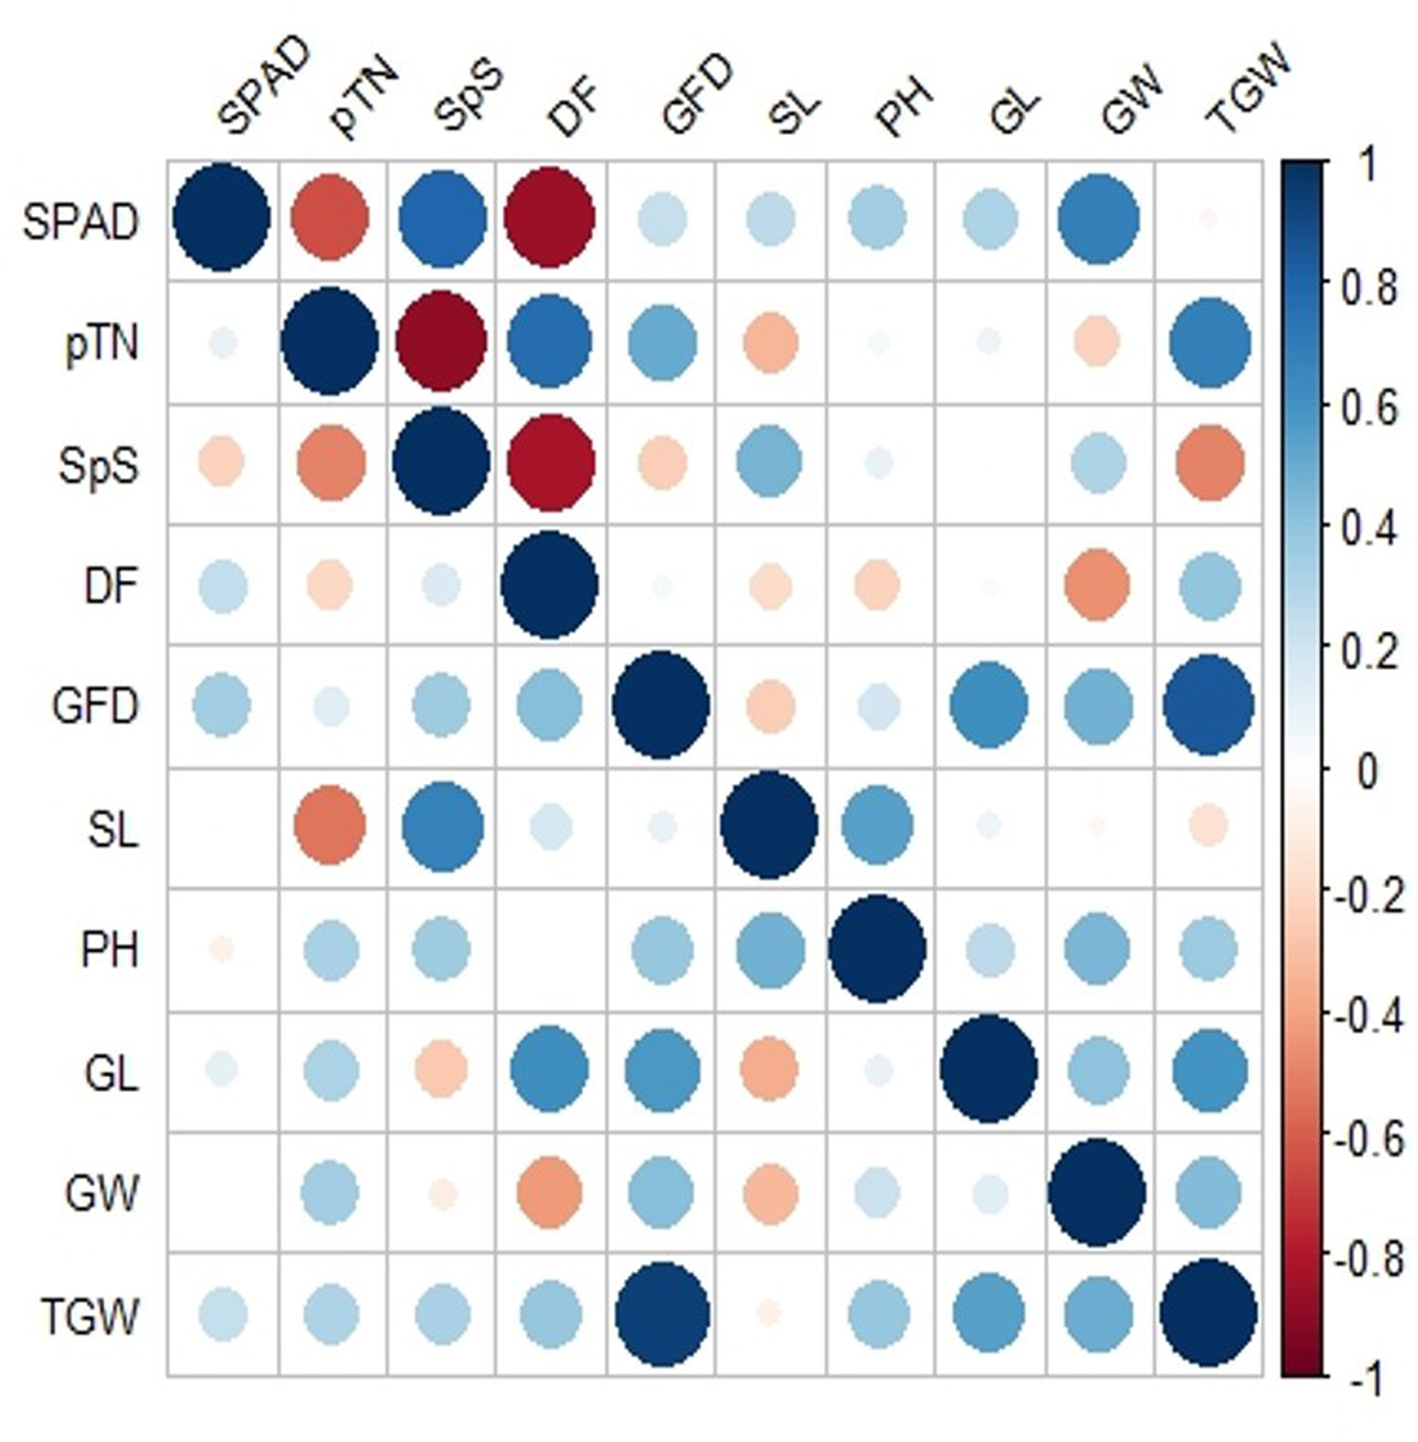
Correlation analysis
Phenotypic correlation estimates among selected traits under NS (below diagonal) and LS (above diagonal) conditions are presented in Fig. 2. TGW showed a significant positive correlation with pTN, GFD and GL under NS as well as LS condition. TGW showed a negative correlation with SpS under LS conditions. Further pTN showed a significant negative correlation with SpS under both NS and LS conditions. DF was found significantly positively correlated with pTN while negatively correlated with SpS and SPAD under LS condition. However, it was positively correlated with GL under NS condition. Under LS conditions, it showed a negative correlation with DF and positive correlation with GFD.
Correlation for different traits in ABLs and synthetics under normal sown (below diagonal) and under late sown (above diagonal) condition.

Heat tolerance index (HTI)
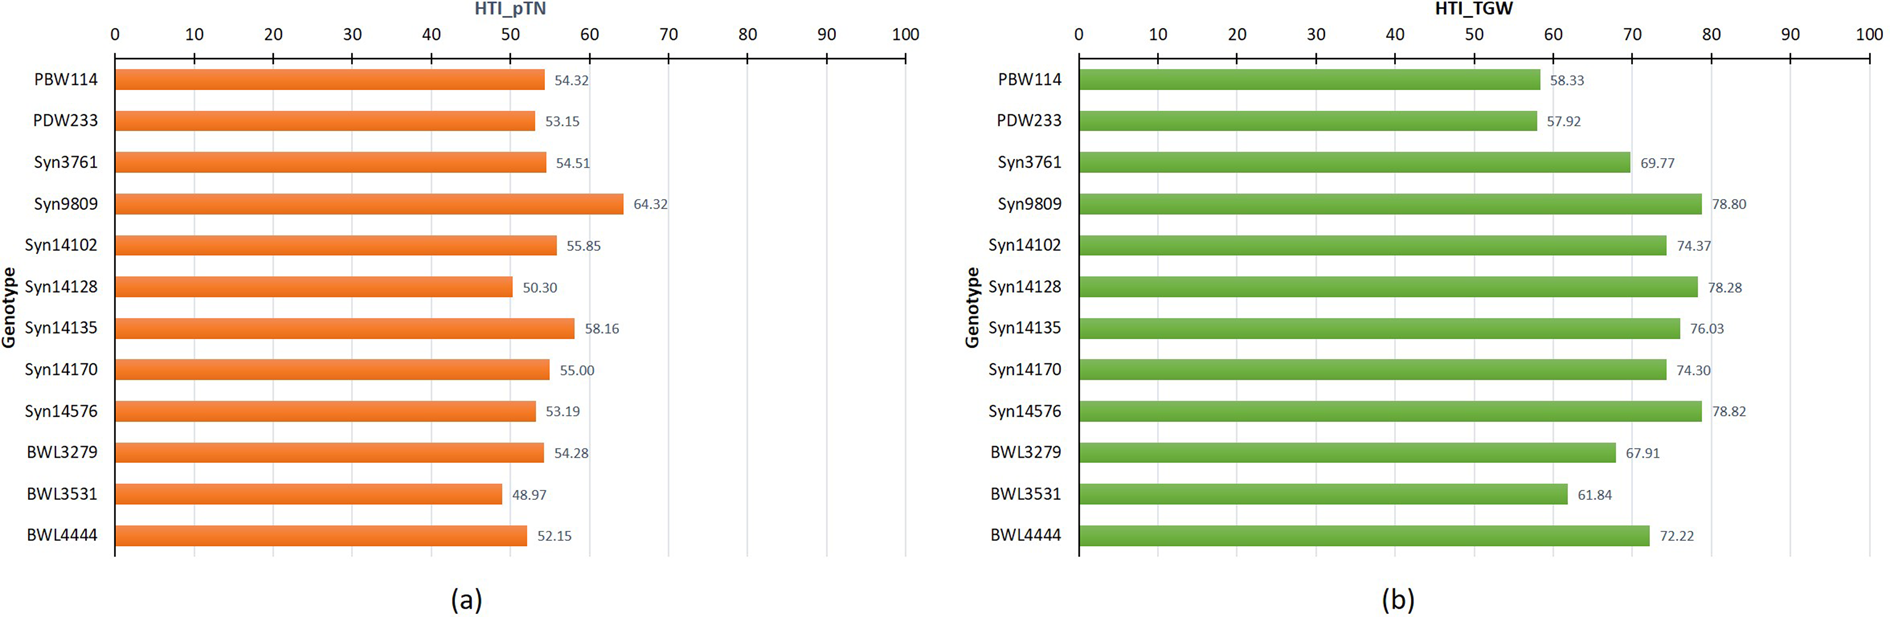
HTI of the selected genotypes was estimated from the productive tillers per plant and TGW to assess the effect of late sowing (online Supplementary Table S3, Fig. 3). HTI in ABLs based on productive tillers per plant (HTI-pTN) ranged from 48.97 to 54.3, and both the durum wheats along with two SHWs, viz., syn14576 (53.19) and syn14128 (50.30) had HTI within this range (Fig. 3(a)). These three SHWs fall in medium heat-tolerant synthetics based on the trait spike number. Further, syn3761 (54.51), syn14170 (55.00) and syn14102 (55.85) had a slightly better HTI than the ABLs but also categorized as the moderate heat-tolerant SHWs. Syn14135 and syn9809 were having the maximum HTI based on pTN with 58.16 and 64.32% reduction in the number of productive tillers per plant under LS conditions and were heat-tolerant SHWs. TGW-based HTI (HTI-TGW) ranged from 57.92 (PDW233) to 72.2 (BWL4444) in durum wheats and ABLs and only one synthetic, syn3761 (69.77), belonged within this range (Fig. 3(b)). Except syn3761, all of the synthetics had more HTI-TGW than ABLs and durum wheat. Syn14576 (78.82), syn14128 (78.28) and syn9809 (78.80) had maximum HTI-TGW and minimum reduction in TGW under late sown condition, indicating the better performance of these SHWs under terminal heat stress. None of the SHWs had HTI lower than the ABLs, suggesting these can be used to improve heat stress tolerance in wheat.
Heat tolerance index for selected lines based on (a) the number of productive tillers per plant (pTN), and (b) thousand grain weight (TGW).

Discussion
Indian wheat is produced dominantly in Indo-Gangetic Plains (IGP), mainly covering the provinces of Punjab and Haryana and wheat yields in these areas have shown a decline in the rate of production and yield (Mukherjee and Wang, Reference Mukherjee and Wang2019). Based on the weather records of 2006–2015, Sandhu et al. (Reference Sandhu, Kaur, Gill and Vashisth2020) suggested that the current optimum sowing window for wheat sowing in IGP lies from the last week of October to the first week of November. The delay in sowing from this optimum sowing window by each day can cause a productivity loss of up to 70.80 kg/ha/d. However, late harvesting of traditional rice varieties used in the rice–wheat cropping system of this region compels the farmers to delay the sowing of wheat until late December and early January (Sharma, Reference Sharma, Sadras and Calderini2009). Delayed sowing reduces the vegetative period and exposes the crop to high temperatures during the grain-filling period, thereby significantly reducing the grain yield and other yield components (Wheeler et al., Reference Wheeler, Craufurd, Ellis, Porter and Vara Prasad2000; Singh and Paul, Reference Singh and Paul2003; Rane et al., Reference Rane, Pannu, Sohu, Saini, Mishra, Shoran, Crossa, Vargas and Joshi2007; Tubiello et al., Reference Tubiello, Soussana and Howden2007; Luo, Reference Luo2011; Moshatati et al., Reference Moshatati, Siadat, Kh, Bakhshandeh and Kamali2012; Liu et al., Reference Liu, Asseng, Liu, Tang, Cao and Zhu2016; Singh and Yadav, Reference Singh and Yadav2019). Therefore, with the changing weather conditions and decreased available genetic diversity in the present wheat germplasm, there is an urgent need to explore new sources which can adapt to these changing environments and can maintain a better yield under such conditions.
SHW can provide an excellent option to introduce new allelic combinations originating from progenitor species to the present-day cultivars. SHW used in the present study reported sufficient genetic variability and G × E interaction among selected lines for different targeted traits under heat stress. This genetic variability can help to identify the better performing lines targeting a particular environment (Kumar et al., Reference Kumar, Dwivedi and Tyagi2003, Reference Kumar, Kumar, Singh, Kumar and Kumar2017; Singh et al., Reference Singh, Kumar, Ahmad, Swati and Jaiswal2012, Reference Singh, Sharma, Tyagi and Singh2013, Reference Singh, Kumar, Kumar and Gangwar2018; Bhushan et al., Reference Bhushan, Bharti, Ojha, Pandey, Gourav, Tyagi and Singh2013; Singh and Sharma, Reference Singh and Sharma2014; Jafarzadeh et al., Reference Jafarzadeh, Bonnett, Jannink, Akdemir, Dreisigacker and Sorrells2016; Dabi et al., Reference Dabi, Mekbib and Desalegn2019). Due to highly significant G × E interactions in selected lines, an indirect selection will help understand the plant responses under heat stress (Kumar et al., Reference Kumar, Dwivedi and Tyagi2003; Shankarrao et al., Reference Shankarrao, Mukherjee, Pal and De2010; Sareen et al., Reference Sareen, Tyagi, Tiwari and Sharma2012). Further, lower values of CV% indicated the reliability of the collected data. In the present study, PCV and GCV range from 5.54 to 25.31% and 2.95 to 21.33%, respectively, under NS condition. While under LS conditions, a range of 4.40–28.30% for PCV and 3.91–24.95% for GCV was observed. The range was as per the studies already reported targeting heat stress tolerance in wheat (Dwivedi et al., Reference Dwivedi, Pawar, Shashi and Madan2002; Tripathi et al., Reference Tripathi, Marker, Pandey, Jaiswal and Tiwari2011; Singh et al., Reference Singh, Sharma, Tyagi and Singh2013; Verma et al., Reference Verma, Singh, Singh, Singh and Setter2014; Kumar et al., Reference Kumar, Kumar, Singh, Kumar and Kumar2017). Higher values of PCV and GCV in case of pTN and SpS under both NS and LS conditions indicated an opportunity for improvement in these traits through selection. Several groups have reported high GCV and PCV for TGW and pTN at different locations of India and under NS and LS conditions (Singh et al., Reference Singh, Kumar, Ahmad, Swati and Jaiswal2012, Reference Singh, Kulshreshtha, Singh, Setter, Singh, Saharan, Tyagi, Verma and Sharma2014; Kumar et al., Reference Kumar, Singh, Kumar, Kumar and Ojha2016; Sapi et al., Reference Sapi, Marker and Bhattacharjee2017; Bhanu et al., Reference Bhanu, Arun and Mishra2018; Raaj et al., Reference Raaj, Singh, Kumar and Kumar2018). The moderate values of variation coefficients were observed for PH and TGW under NS and GFD, SL and TGW under LS conditions, indicating that the phenotypic expression of these characters can represent a good indication of their genotypic potential and can represent an effective criterion for selection (Abinasa et al., Reference Abinasa, Ayana and Bultosa2011; Dabi et al., Reference Dabi, Mekbib and Desalegn2019). The values of variability coefficients (GCV, PCV) alone are not helpful in determining the heritable portion of variation transmitted from generation to generation and are reflected by broad sense heritability (Lush, Reference Lush1949). The high heritability in broad sense is estimated for SpS, DF, GFD, SL, PH, GL and TGW under NS as well as LS conditions indicating higher contribution of genotypic components (Panwar and Singh, Reference Panwar and Singh2000, Reference Panwar and Singh2017; Joshi and Mahal, Reference Joshi and Mahal2004; Molla and Thomas, Reference Molla and Thomas2009; Tripathi et al., Reference Tripathi, Marker, Pandey, Jaiswal and Tiwari2011; Kumar et al., Reference Kumar, Kumar, Singh, Kumar and Kumar2017). High heritability coupled with high GCV indicated that the lines may be evaluated in multi-location trials and can be isolated as donors for these characters or used as parents in hybrid development programme (Kumar et al., Reference Kumar, Sharma, Kumar and Gupta2014). However, SPAD was reported to have medium heritability (51%) under NS condition but very high heritability (90%) under LS condition, an ability to maintain chlorophyll content under heat stress. As stay green character was used to select the Ae. tauschii accessions to develop the synthetics, it is well represented in the synthetics helping them to perform better under LS conditions. Similarly, a better grain size, another selection criterion used to shortlist the Ae. tauschii accessions, was also well represented in the synthetics evaluated in the present study as GW also had moderately high heritability (62%) under LS conditions compared to low heritability (41%) under NS conditions. Better heritability of GW under terminal heat stress could be a probable reason for the improvement of TGW under LS conditions. pTN had moderate heritability under both NS (45%) and LS (43%) conditions but had high PCV and GCV indicating a major role of environment effect for this trait.
A timely planted crop experienced more time with suitable temperature for tillering, has better leaf area index and ultimately recorded more fertile tillers resulting in higher yield returns (Donaldson et al., Reference Donaldson, Schillinger and Dofing2001; Shahzad et al., Reference Shahzad, Bakhat, Shafi, Shah and Jabeen2002). Further, longer spikes observed in timely sown crop might be due to higher leaf area and longer duration experienced by the crop, resulting in more dry matter accumulation and better grain weight. These large-sized spikes, coupled with more dry matter accumulation might be responsible for more spikelets per spike in timely sown crop (Miralles et al., Reference Miralles, Ferro and Slafer2001; Hussain et al., Reference Hussain, Frooq, Shabir, Khan, Zia and Lee2012). The major effect of temperature stress due to delayed sowing causes the decrease in chlorophyll content resulted from damaged thylakoid membranes (Ristic et al., Reference Ristic, Bukovnik and Prasad2007) or lipid peroxidation of chloroplast membranes (Djanaguiraman et al., Reference Djanaguiraman, Boyle, Welti, Jagadish and Prasad2018). High chlorophyll concentrations have been found associated with improved crop yield in tolerant genotypes as reported by Verma et al. (Reference Verma, Foulkes, Worland, Sylvester-Bradley, Caligari and Snape2004). The ability of wild crop progenitors to maintain its membrane integrity has helped the synthetics to possess better chlorophyll content under heat as well as drought conditions (Pradhan et al., Reference Pradhan, Prasad, Fritz, Kirkham and Gill2012). Crops with ‘stay-green’ phenotype have increased yield potential because they can keep their stalk transporting system functioning even under adverse conditions. In general, all cultivars studied showed a consistent decline in chlorophyll content under delayed sowing suggesting structural damage to the chloroplast in wheat leaves due to the high ambient temperature. But the maximum effect was observed on durum wheats, PBW233 and PDW114 with ~14% reduction in SPAD value. However, reduction in synthetic wheat lines was relatively less (2.99–8.99%) as compared to elite cultivars, and durum wheats. Similar results were reported by Pradhan et al. (Reference Pradhan, Prasad, Fritz, Kirkham and Gill2012) on four synthetics, and a higher level of total chlorophyll content under late sown condition is considered an indicator of heat tolerance.
Synthetics also reported fewer reductions in the number of productive tillers, number of spikelets per spike, spike length and plant height as compared to durum parents and ABL checks. The better yield potentials of primary synthetics under delayed sowing have been associated with a significantly high number of fertile tillers earlier by Ghasemi et al. (Reference Ghasemi, Zaefizadeh, Azimi and Jamaati-e-Somarin2010). In the present study, the productive tiller number in synthetics was reduced to 35–45% in late sown condition compared to up to 51% reduction in the case of elite and durum checks. But even after a similar decrease in the number of productive tillers, synthetics were better able to maintain the TGW under terminal heat stress, probably because the decline in auxiliary tiller number has resulted in better spike length in synthetics.
Spike contributes to the grain dry weight by the accumulation of photosynthates and assimilates. Maintaining a longer spike under heat stress can result in a significant number of grains per spike. Therefore, it can offer a new avenue for enhancing heat tolerance in wheat (Elbashier et al., Reference Elbashier, Elbashier, Idris, Tadesse, Tahir, Ibrahim, Elhashimi, Saad, Idris and Mustfa2019). However, spike length appears to be less sensitive (10.8–27.05% reduction) due to heat stress as compared with the decrease in the number of grains per spike (21.95–47.03%) (Acevedo et al., Reference Acevedo, Silva, Fraga, Pagas and Mujeeb-Kazi1999; Jaiswal et al., Reference Jaiswal, Prasad, Rani, Singh, Kumar, Kumar and Yadav2018). The synthetics used for evaluation reported a 4.26–24.10% reduction due to delayed sowing indicating that few synthetics, viz., syn14012, syn14576 and syn14128, could be used to improve spike length in wheat. Ghasemi et al. (Reference Ghasemi, Zaefizadeh, Azimi and Jamaati-e-Somarin2010) also reported a similar observation while studying the adaption of synthetic lines in Iran. The association of spike length with grain yield under heat stress has been reported by Okuyama et al. (Reference Okuyama, Federizzi and Fernandez2005), Mohamed et al. (Reference Mohamed, Omara, El-rawy and Hassan2019) and Kumar et al. (Reference Kumar, Kulwal, Balyan and Gupta2007) who emphasized the importance of selecting this character for enhancing heat tolerance. As pointed out by Tambussi et al. (Reference Tambussi, Abort, Guamet, Nogue and Araus2007), Maydup et al. (Reference Maydup, Guiamet, Granciano, Lopez and Tambussi2010) and Wang et al. (Reference Wang, Xi, Wang, Wang, Xu and Han2016), spike photosynthesis is a major source of assimilates for enhancing grain yield under environmental stresses. Therefore, selection for increasing spike length would contribute to greater grain yield under heat stress. The large-sized spikes coupled with more dry matter accumulation might be responsible for more spikelets per spike in timely sown and late sown crops and affect the number of grains per spikes (Miralles et al., Reference Miralles, Ferro and Slafer2001; Bala and Sikder, Reference Bala and Sikder2018). The present study reported a decrease of 3.79–19.33% reduction in spikelet number compared to a 26% reduction in durum wheats, indicating that the Ae. tauschii portion of the genome might have contributed to the ability to maintain better spikelet number even after the delayed sowing.
Most of the modern wheat varieties belong to the dwarf and semi-dwarf category. They can produce greater grain yield than tall varieties under adverse conditions as the earlier ones have higher harvest index (Begum et al., Reference Begum, Ahmad and Khan1994). A reduction in plant height is usually observed under delayed sowing caused due to fast phasic change, shortening the vegetative phase and early onset of the reproductive stage (Vollenweider and Günthardt-Goerg, Reference Vollenweider and Günthardt-Goerg2005). SHWs and SHW-derived cultivars are classified as tall-to-medium height wheat and have reported an 85–92% reduction in height due to delayed sowing (Mishra et al., Reference Mishra, Khan and Baghel2000; Irfan et al., Reference Irfan, Muhammad, Amin and Jabbar2005; Elbashir et al., Reference Elbashir, Gorafi, Tahir, Kim and Tsujimoto2017; Tang et al., Reference Tang, Wu, Li, Yang, Huang, Ma and Li2017; Bala and Sikder, Reference Bala and Sikder2018). Synthetics evaluated in the present study reflected 9.61–23.37% reduction in PH, which was relatively less compared to earlier reports, indicating that the synthetics were able to maintain its vegetative growth under delayed sowing.
The acceleration in the developmental phases of wheat crop due to heat stress is ultimately reflected in the shortening of DF and GFD, the most critical stages for crop yield. High temperature (>30°C) during the early onset of spike development and grain growth can increase the rate of grain filling in wheat but with lower GFD and thus, lower deposition of assimilates affecting grain yield (Al-Khatib and Paulsen, Reference Al-Khatib and Paulsen1984; Randall and Moss, Reference Randall and Moss1990; Stone and Nicolas, Reference Stone and Nicolas1995; Wardlaw and Moncur, Reference Wardlaw and Moncur1995). However, crop tends to avoid the terminal heat stress by an early onset of flowering, preventing the heat stress during the grain filling. Synthetics have reported a reduction of 5–24 d for 50% days to flowering and 9–14 d reduction in the GFD under late sowing indicating that these lines are capable of escaping the impact of high temperature by shortening the heading time (Elbashir et al., Reference Elbashir, Gorafi, Tahir, Kim and Tsujimoto2017). However, in the present study, reduction in DF and GFD in synthetic lines ranged from 18 to 30 and 10 to 21 d, respectively, higher than the earlier reports. However, SHW and derived cultivars have shorter but broader flag leaves with small basal angles from anthesis to mid-late grain fill, than that of the non-synthetic cultivars, leading to a shortened DF and GFD without having much effect on the TGW and yield (Tang et al., Reference Tang, Wu, Li, Yang, Huang, Ma and Li2017).
The increased temperature during the grain development decreases grain size due to high respiration rate, shorter GFD and low grain-filling rate, which ultimately reduces the grain weight because of forced grain development (Tashiro and Wardlaw, Reference Tashiro and Wardlaw1990; Stone and Nicolas, Reference Stone and Nicolas1995; Gibson and Paulsen, Reference Gibson and Paulsen1999; Hasan and Ahmed, Reference Hasan and Ahmed2005). Consequently, maintaining an optimum kernel size and weight under heat stress is a crucial measure of heat stress tolerance directly effecting the yield (Kuchel et al., Reference Kuchel, Williams, Langridge, Eagles and Jefferies2007; Pandey et al., Reference Pandey, Sareen, Siwach and Tiwari2014). The sensitivity of individual grain mass in wheat to longer exposure to heat stress has been reported previously by others (Wardlaw and Wrigley, Reference Wardlaw and Wrigley1994; Ugarte et al., Reference Ugarte, Calderini and Slafer2007). It has been suggested that pre-anthesis heat stress may reduce the growth of ovaries, which may, in turn, impose an upper limit for potential grain weight (Calderini et al., Reference Calderini, Abeledo, Savin and Slafer1999). Crop wild germplasm of wheat has large diversity for grain size variation, and all the synthetics had long grain, a probable character of the wild parent (Chhuneja et al., Reference Chhuneja, Garg, Kumar, Kaur, Sharma, Ahuja, Dhaliwal, Characterization, Chhuneja, Garg, Kumar, Kaur, Sharma, Bains and Ahuja2010). In a 5-year study of synthetic-derived cultivars in China, Tang et al. (Reference Tang, Wu, Li, Yang, Huang, Ma and Li2017) reported a 13.5% higher average yield of the SHW-derived cultivars than that of the non-synthetic cultivars under various environmental conditions. In the present study, synthetics had better grain length and width compared to elite and durum parents and were also better able to maintain these under heat stress. In general, grain width was more affected due to heat as compared to the grain length. However, the capacity to maintain higher chlorophyll content, better productive tiller number and spike length combined with better grain size in synthetics has been reflected as better TGW in synthetics under delayed sowing indicating a good scope of utilizing these synthetics in breeding programmes.
Correlation analysis reveals the relationship of dependent variable yield with its independent variables. Thus, the association of various traits would determine their relative significance to improve yield. Nukasani et al. (Reference Nukasani, Ramchandra Potdukhe, Bharad, Deshmukh and Shinde2013) reported similar results for tillers per meter and grain weight per spike. Yang et al. (Reference Yang, Sears, Gill and Paulsen2002) compared primary synthetics at 30/25°C (day/night temperature regime) with adapted cultivars. They reported that chlorophyll content, GFD, grain yield and kernel weight were negatively correlated with a heat-susceptibility index. Still, that grain yield was positively correlated at the 20/15°C regime. In the present study, TGW showed a positive and significant correlation with GFD, grain length, grain width and number of productive tillers per plant under both NS and LS conditions. Thus, suggesting that with the increase in the number of spikes, grain size and GFD, there would be a subsequent increase in grain weight. A similar positive correlation of TGW with these characters has also been reported in several studies (Radmehr, Reference Radmehr1997; del Blanco et al., Reference del Blanco, Rajaram and Kronstad2001; Dwivedi et al., Reference Dwivedi, Pawar, Shashi and Madan2002; Tripathi et al., Reference Tripathi, Marker, Pandey, Jaiswal and Tiwari2011). While under LS condition, TGW was negatively correlated with SpS (Bhushan et al., Reference Bhushan, Bharti, Ojha, Pandey, Gourav, Tyagi and Singh2013). A positive correlation (non-significant) was found between grain length and width, indicating that as grain width increases, grain length increases under both NS and LS conditions. However, a negative correlation between GL and GB was reported by Arora et al. (Reference Arora, Cheema, Poland, Uauy and Chhuneja2019) in wheat and Agrama et al. (Reference Agrama, Eizenga and Yan2007) in rice.
The concept of HTI is used to measure the total effect of terminal heat stress in terms of minimizing the reduction in yield caused by unfavourable versus favourable environment. HTI is extensively used as a selection criterion for the improvement of heat tolerance in wheat breeding. As heat tolerance is usually quantified by grain yield of a line under stress and under non-stress conditions, the selection is further complicated due to genotype × environment (G × E) interaction (Fischer and Maurer, Reference Fischer and Maurer1978; Dhanda and Munjal, Reference Dhanda and Munjal2012). In the present study, the HTI was estimated using pTN (HTI-pTN) and TGW (HTI-TGW). It was observed that the magnitude of HTI-TGW was higher as compared to HTI-pTN. pTN had higher GCV and PCV under NS and LS conditions, indicating a higher role of environment in estimating HTI. However, HTI-TGW might have been a more reliable index due to lower interference of environment. Among the selected lines, durum had the minimum HTI, indicating that susceptible lines are followed by elite cultivars. However, most of the synthetics had better HTI than either durum or elite wheat cultivars, showing more tolerance towards heat stress. Based on HTI, three synthetics, viz., syn9809, syn14128 and syn14135, were identified as heat-tolerant SHWs, and nested association mapping populations targeting thermal stress have been generated (by our group) and are under evaluation at Punjab Agricultural University, Ludhiana. Use of these potential SHWs with inherent resistance potential can also help pyramid the stress resilience. As yield under heat stress is significantly affected and causes a threat to the global food security, synthetic wheat may impart the heat stress tolerance due to the introgression of D-genome progenitor minimizing the losses due to heat stress.
Supplementary material
The supplementary material for this article can be found at https://doi.org/10.1017/S1479262121000113
Acknowledgements
Funding received from University Grants Commission, Govt. of India in the form of Rajiv Gandhi National Fellowship, Department of Science, Govt. of India and BBSRC, UK in the form of project no. BT/IN/Indo-UK/CGAT/16/SK/2014-15 is highly acknowledged.
Author contributions
SK conceived and designed the research. AK conducted the experiments and collected the data. SK, PC, PS and AK produced the final draft of the manuscript. SK, KS and PC reviewed the experiments and manuscript.
Conflict of interest
None.
Ethics approval
Not applicable.