I. INTRODUCTION
Entangled materials, made of fibers, find their major applications in thermal insulation, mechanical reinforcement, and filtration. With regard to their low density and discrete architecture, this kind of materials is close to cellular materials. The current state of knowledge about metal foams is well developed from both experimental and modeling viewpoints.Reference Ashby, Evans, Fleck, Gibson, Hutchinson and Wadley1,Reference Gibson and Ashby2 Comparatively entangled materials have been much less investigated. The knowledge of the macroscopic behavior of these materials reflects their potential applications. Compression experiments have been performed on several types of entangled materials: natural (such as animal wool and human hair) and synthetic (such as stainless steel, carbon, glass fibers, and carbon nanotubes).Reference Masse, Salvo, Rodney, Bréchet and Bouaziz3,Reference Poquillon, Viguier and Andrieu4 Thermal and electrical conductivity measurements have been carried out.Reference Vassal, Orgeas and Favier5–Reference Lux, Ahmadi, Gobbé and . Delisée7 Damping properties have also been investigatedReference Shahdin, Morlier, Gourinat, Mezeix and Bouvet8 as entangled materials exhibit high potential for damping thanks to the hysteresis in loading–unloading path (e.g., in compression).
Process to make entangled materials could be simple, and the use of the kind of materials has recently been focused as a core material for sandwich structure.Reference Masse9–Reference Gustavsson14 Indeed, they present an alternative to foams (metallic or polymeric). For certain metals (e.g., steel), foams are difficult to process because of high melting point, whereas the processing of fibers from the solid state is simpler. In the case of sandwich structure based on steel in automotive application for weldability issue, it is preferred to choose steel as the constitutive material of the core.Reference Verchere15 From the previous reason, entangled materials made of steel fibers appear the best solution. In this context, increasing mechanical properties of entangled materials by the creation of permanent contacts between fibers is a possible solution. This can be done by several methods. In the literature, at least two means to create these contacts are studied: sintering, used for metallic fibersReference Markaki and Clyne16–Reference Masse and Poquillon18 and spraying of epoxy glue, used for glass or carbon fibers.Reference Mezeix, Bouvet, Huez and Poquillon19 These studies show clearly the reinforcement in compression due to permanent contacts. In the case of nonpermanent contacts (nonbonded or sintered fibers), only densification is observed. When sufficient density of permanent contacts is created, behavior becomes similar to that of foams. Models developed on compression of entangled materials focused essentially on densification, such as the pioneered work of van WykReference van Wyk20 and completed by TollReference Toll21 predicting a power law relationship between compression stress and relative density of materials. The exponent of this power law depends on the orientation of the fibers and is equal to 3 in the case of three-dimensional (3D) random array of fibers. These analytical models have been validated thanks to finite element analysesReference Durville22 and also by adapted molecular dynamic methods.Reference Barbier, Dendievel and Rodney23 In both cases, it is possible to take into account the friction between fibers that is important for understanding of the hysteresis during unloading–loading path. An analytical approach was developed to predict the first step of unloading taking into account destroyed contacts during unloading.Reference Bouaziz, Masse and Bréchet24
The classical model to explain the compression curve is the van Wyk–Toll’s approach, which is based on the assumption that fibers bend during loading and large aspect ratio for the fibers. Considering an elementary cell composed of one fiber between two contacts deformed in bending, van Wyk and then Toll showed that the compression stress is expressed as
 $${\rm{\sigma }} = k{E_{\rm{f}}}({{\rm{\rho }}^n} - {\rm{\rho }}_0^n)\quad ,$$
with ρ and ρ0 the relative density and the initial relative density, respectively, E f the Young's modulus of the fibers, and k a multiplicative factor depending on the loading direction of the fibers. The exponent n is equal to 3 for random 3D arrays of fibers and 5 for two-dimensional (2D) random arrays. This model also provides structural information on the fibers arrangement, such as the number of contacts per unit volume (N cv) and can take into account various fiber orientations via an orientation function f Reference Raganathan and Advani25
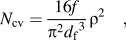 $${N_{{\rm{cv}}}} = {{16f} \over {{{\rm{\pi }}^2}{d_{\rm{f}}}^3}}{{\rm{\rho }}^2}\quad ,$$
where d f is the diameter of the fibers. This model is known as the “tube” model and is developed for straight rigid fibersReference Raganathan and Advani25:
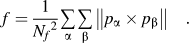 $$f = {1 \over {{N_f}^2}}\mathop\sum\limits_{\rm{\alpha }} {\mathop\sum\limits_{\rm{\beta }} {\left\| {{p_{\rm{\alpha }}} \times {p_{\rm{\beta }}}} \right\|} \quad .}$$
With N f the number of fibers and p the director vector of the fibers. f is equal to π/4 for a random 3D distribution, 2/π for a random 2D distribution and 0 for aligned fibers.
In the literature, a number of studies deal with structural characterization of arrays of fibers. Basic characterizations are based on microscopic observations [optical, scanning electron microscopy (SEM), or confocal]. It is relevant in the case of short and straight fibers and the orientation can be determined.Reference Mlekusch26,Reference Eberhardt and Clarke27 The same technique is used for steel felt.Reference Delincé and Delannay28 In the case of long fibers (more deformable due to lower rigidity), it is more difficult to use previous techniques, and 3D images from x-ray tomography observations are a powerful alternative. The 3D image technique developed by Lux et al.Reference Lux, Ahmadi, Gobbé and . Delisée7 consists in comparing fiber orientations with an orientation of reference. In the same study, images undergo skeletonization. In shape analysis, a skeleton (or topological skeleton) of a shape is a thin (one-dimensional) version of that shape that is equidistant to its boundaries. Algorithms to build this skeleton can be found in different Refs. Reference Yang. and Lindquist29 and Reference Gong and Newton30. In Ref. Reference Lux, Ahmadi, Gobbé and . Delisée7, the skeleton is extracted from 3D images, and contacts are given by assuming that a contact point is a point of the skeleton that has 3 neighbors. In Ref. Reference Tan, Elliott and Clyne31, a simple distance criterion is applied to obtain an order of magnitude of the number of contacts (the usual method of watershed is not applied in general for long fibers entanglement because of the nonregularity of the fibers’ shape).
The analysis of the mechanical model shows that the relevant parameters to characterize and to understand the mechanical behavior apart from the diameter of fibers are the orientation of the fibers and the number of contacts. It is the aim of this paper to present a quantitative experimental investigation of these characteristics and their evolution during compressive loading and to use these characterizations to provide a physically based description of the compression curve.
II. MATERIALS AND METHODS
A. Materials
In this paper, commercial stainless steel wool (AISI 434) is studied with a mean relative density of 2.5%.
A preliminary study of the steel wool showed that its spatial heterogeneity, on the scale of centimeters, allows extracting the sample with a relative density ranging from 1.5% to 3.5% on the square sample of 30 by 30 mm.Reference Masse, Salvo, Rodney, Bréchet and Bouaziz3 The fibers are irregular in shape and length: the mean equivalent diameter is 80 μm and the mean length is 5.6 ± 2.5 cm. The aspect ratio is high, more than 600. The fabrication process of the fibers is the scraping of an initial circular wire. This explains the observed irregular shape.
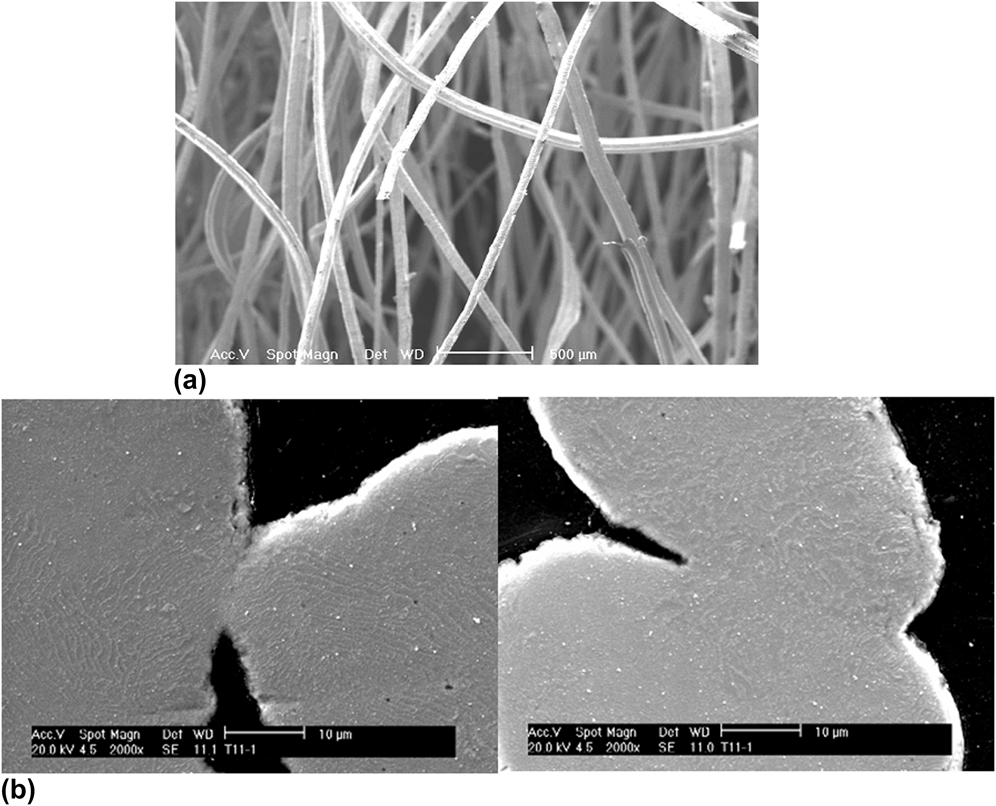
To change the nature of contacts and improve the mechanical properties of steel wools, sintered steel wools were also studied. Sintered steel wools were heated up at 1300 and 1400 °C for times ranging from 1 to 4 h under reductive (N2 with 5%H2) atmosphere. Relative densities of obtained samples are ranging between 4% and 12% depending on the duration and the temperature of sintering. SEM images of contacts obtained after sintering at 1400 °C during 4 h are shown in Fig. 1.
SEM pictures of nonsintered steel wool with a relative density of 1.5% (a) and of sintered steel wool at 1400 °C during 4 h (b).

3D visualizations from x-ray tomography of nonsintered steel wool observed during compression at different relative densities: 3.8% (a), 5.3%, (b), and 9.0% (c).
B. X-ray tomography and in situ testing
To perform the structural characterization on nonsintered and sintered steel wools, x-ray tomography observations were performed at the ESRF (European Synchrotron Radiation Facility, ID 19, Grenoble) and MATEIS lab (INSA Lyon). An in situ test was also performed on nonsintered steel wool with a relative density of 3.5% at the ESRF. The size of the volume was 11 by 11 by 5 mm height, with a voxel size of 8 μm. The in situ testing device is described in Ref. Reference Buffière, Maire, Adrien, Masse and Boller32. Two in situ tests were also performed on sintered steel wools at MATEIS lab. In situ interrupted analyses were performed following different steps: first load is applied, second load is stopped, then the scan is done, and afterward the sample is reloaded. For the nonsintered steel wool, 8 deformations steps were analyzed between a relative density of 1.8% and 13.4%. For the sintered steel wools, samples sintered at 1400 °C during 1 h and 1300 °C during 4 h were analyzed with 12 scans between 6% and 12% (a compression range of 0.7) and 5 scans between 8% and 25% (a compression range of 1.14), respectively. The initial densities of the analyzed samples are, respectively, 6% and 8%. Only one sample was studied for each condition, and for each samples, one scan was performed before deformation. An example of 3D visualization is shown in Fig. 2 for three different densities obtained by compression with the same sample.
C. Structural characterization
X-ray tomography raw gray level images are easily segmented to separate fibers and porosity. After segmentation, it is directly possible to estimate the relative density by calculating the ratio of white voxels over the total number of voxels, which is in agreement with the values obtained by weighting the samples.
For the structural characterization of steel wools and especially for the key issue of contacts quantification, we used the skeleton of the fibers array. The skeleton can be obtained with commercial software Avizo 533 as shown in Fig. 3 for nonsintered steel wool. From the skeleton, it is possible to obtain the number of contacts and the orientation of the fibers.
3D visualization from x-ray tomography and the resulting skeleton for a relative density of 2.7% (a) and focus on contact point (b).
1. Contact detection
Figure 3(b) shows an example of contacts and the resulting skeleton. It shows that one contact point is represented on the skeleton as one segment. To count the number of contacts, it was chosen to define a contact as a segment whose length is lower than the diameter of a fiber. In certain cases, contact length may be large and thus could be represented by several segments. In this case, to determine whether it is a contact or not a condition on the distance between contacts has to be used: if two contacts are separated by a distance lower than a determined length (taken as approximatively two fibers diameter), only one segment is counted.
2. Orientation analysis
All the coordinates, extremities, and total length of the segments are known. The contact segments are removed for the analysis. Consequently, fibers orientation can be evaluated. Then the orientation of segment between fibers is calculated. In the case of straight fibers, the orientations of the fibers and the segments between contacts are the same because these segments are collinear for the same fiber. In the case of nonstraight fibers, the orientation of the segments between contacts seems to be more relevant because the tube model is based on the assumption of straight fibers.
III. VALIDATION ON VIRTUAL MATERIALS
A. Virtual materials generation
To compare and validate the characterization technique (number of contacts between fibers and orientation) developed in this paper, virtual materials were created using numerical simulation based on molecular dynamic equations. This program is described in Ref. Reference Barbier, Dendievel and Rodney23 These materials are not expected to describe the real materials under investigation but to provide a “best-case scenario” for our skeletonization procedure and the evaluation of number of contacts per unit volume and orientation of the fibers. Three kinds of materials were realized: 3D random distribution [Fig. 4(a)], 2D random distribution [Fig. 4(b)], and aligned fibers oriented at ±20° around one direction [Fig. 4(c)]. With numerical calculations, it is possible to follow the relative density, number of contacts, and orientation of the fibers during isostatic compression. From numerical coordinates of each fiber, 3D numerical images are generated. To be close to images of real materials, the diameter of the fibers is fixed to 7 pixels, and the relative density is close to the relative density of the studied real materials.
3D visualizations of virtual materials and resulting skeleton for 3D random distribution (a), 2D random distribution (b), oriented fibers of ±20° around one direction (c).
B. Validation of the techniques
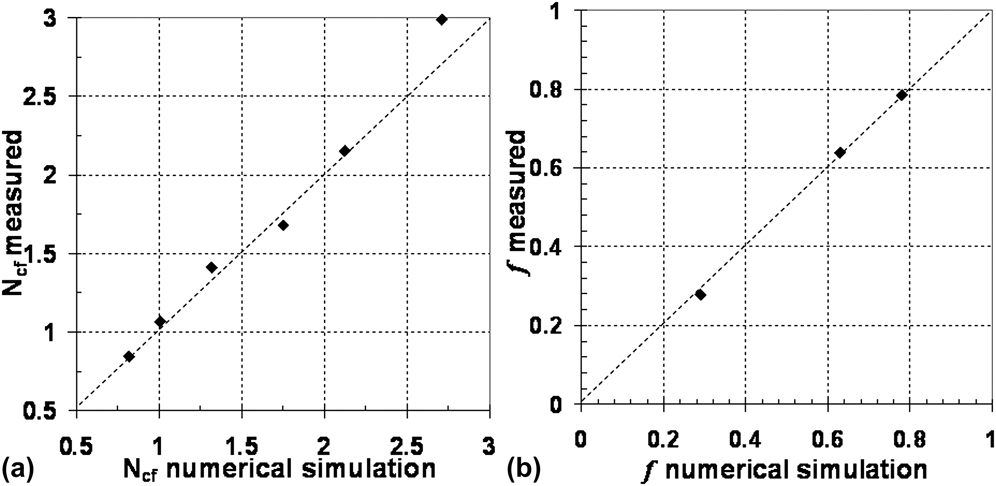
Figure 5(a) shows the measured number of contacts per fibers as a function of the numerical number of contacts per fibers in the case of 3D random distribution, whereas Fig. 5(b) shows the measured value of f [Eq. (3)] as a function of the numerical value of f. A good correlation between image analysis measurement and expected numerical results is observed: these results thus validate our 3D quantification method.
Comparison measured and calculated structural parameters: number of contacts per fibers (a) orientation function f (b).
IV. REAL STEEL WOOLS CHARACTERIZATION
Once characterization techniques are validated on virtual materials, both for contact identification and orientation quantification, they can be safely applied to the steel wools. Results of in situ tests on nonsintered and sintered steel wools will be presented.
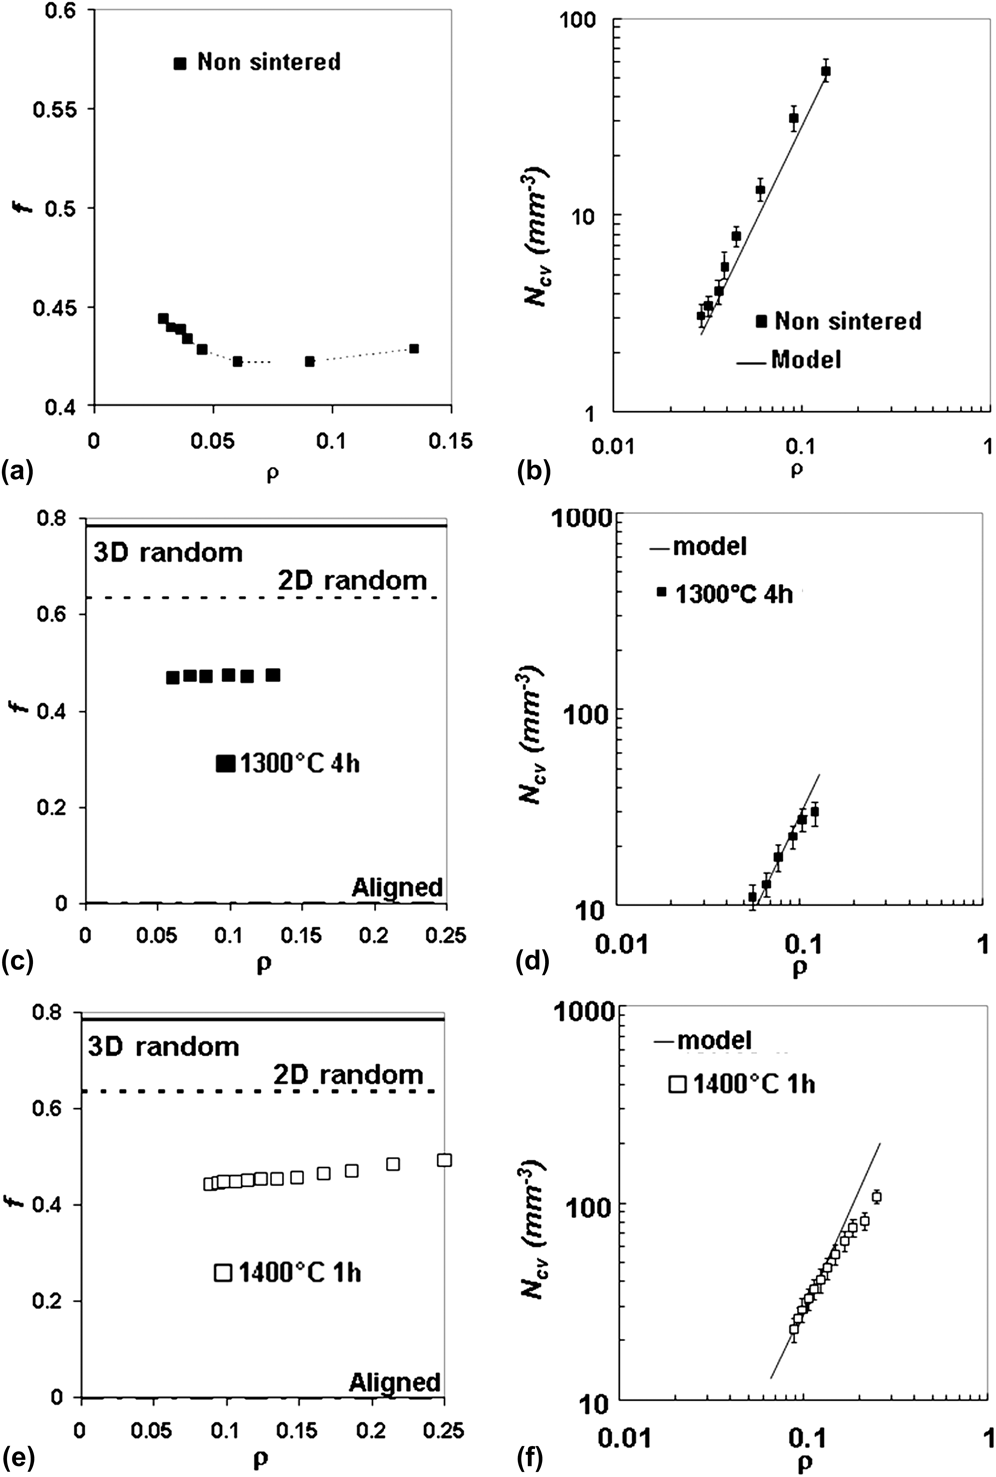
In situ tests permit to observe the evolution of the structural parameters when relative density is varying by compression. Figure 6(a) shows the evolution of f [Eq. (2)] during compression for a nonsintered steel wool with initial relative density of 3%, and Figs. 6(c) and 6(e) present two sintered steel wools at 1300 °C during 4 h and 1400 °C during 1 h. Figures 6(b), 6(d), and 6(f) show the corresponding number of contacts for each steel wool. In these figures, the number of contacts calculated with the tube model is plotted as a function of the relative density during compression using associated value of f. First of all the number of contacts is well predicted by the tube model for nonsintered steel wool. Concerning the sintered steel wools [Figs. 6(d) and 6(f)], the model predicts well the number of contacts for relative density less than 10–12% but overestimates the number of contacts for larger relative densities. This deviation may be explained by the fact that at high density, it is more and more difficult to create new contacts under compression and the steel wool should be seen as foam for which the number of contacts is constant. It is, however, possible to describe the number of contacts per unit volume as a power law of density in the range of 10–20% but with an exponent lower than the theoretical one (2), close to 1.5. A deviation of the tube model is also reported in Ref. Reference Latil, Orgéas, Geindreau, Dumont and Rolland du Roscoat34 where fiber orientation is clearly along the axis perpendicular to the compression axis.
Structural parameters of nonsintered (a, b) and sintered (c, d, e, f) steel wools during compression: number of contacts per unit volume (mm−3) compared with values for tube model (b, d, f), values of f compared with values for characteristics orientations (a, c, e).
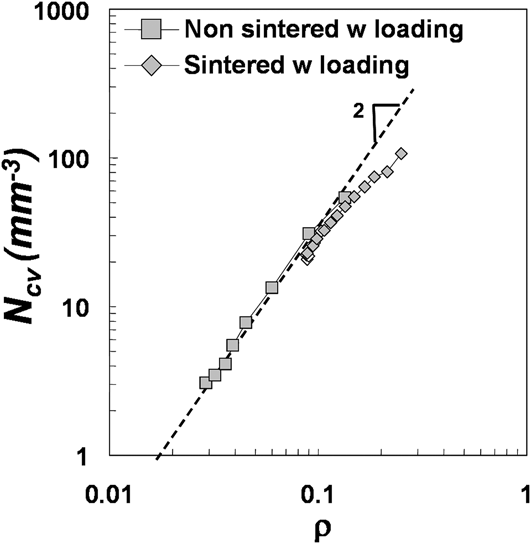
It is possible to summarize the results obtained concerning the number of contacts per unit volume as shown in Fig. 7. The tube model is valid for relative density in between 3% and 10%, and therefore N cv is proportional to ρ2. Below 3%, it is possible to describe N cv by a power law again, but with a lower exponent equal to 1.5 and between 4% and 12%, it is the same. Therefore, the number of contacts per unit of volume is described by
 $${N_{{\rm{cv}}}}{\rm{\alpha }}{{\rm{\rho }}^{\rm{\beta }}}\quad .$$
Number of contacts per unit volume (mm−3) during loading for nonsintered and sintered steel wools.
V. INFLUENCE OF NUMBER OF CONTACTS ON COMPRESSION TESTS
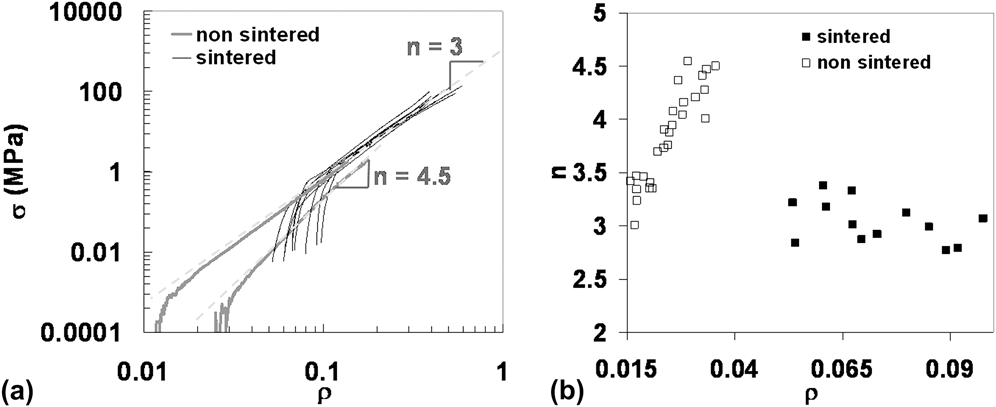
Results of compression tests on sintered and nonsintered steel wools are presented in Refs. Reference Masse, Salvo, Rodney, Bréchet and Bouaziz3 and Reference Liu, He and Wu17 Value of measured exponents [see Eq. (1)] for fitting van Wyk–Toll approach are summarized in Fig. 8 for both nonsintered and sintered steel wools as a function of the initial density of the steel wool before compression. As it can be seen, the exponent n is varying between 3 and 4.5 for the nonsintered steel wool, whereas for the sintered steel wool, it can be considered as constant and nearly equal to 3.
(a) Mechanical compression curves for nonsintered and sintered steel wools for different relative densities before compression. (b) Values of exponent of van Wyk–Toll model experimentally determined for nonsintered and sintered steel wools as a function of the initial density before compression.
With the conclusion of the work on structural characterization, it is now possible to explain the value of the exponent. For that, the van Wyk–Toll approach has to be detailed. In this model, it is assumed that the fibers are straight and disposed homogeneously into the material, and that they are loaded in bending during compression. From particular assumption, the stress (σ) for the uniaxial compression can be written as the product of the number of deformation unit by their height and by the force applied on them.
 $${\rm{\sigma }} = {\rm{\eta }}\mathop {hp}\limits^{\_\!\_} \quad ,$$
with η the numbers of deformation unit per unit of volume, h the height of the deformation unit, and p the force applied on the deformation unit. The number of deformation unit is proportional to the number of contacts per unit of volume (N cv), and the force p is the bending force considering that the span of the beam is equal to the distance between contacts (λ). Taken into account these facts, the stress can be expressed as follows (with ρ the relative density during compression):
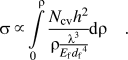 $${\rm{\sigma }} \,\propto \int\limits_0^{\rm{\rho }} {{{{N_{{\rm{cv}}}}{h^2}} \over {{\rm{\rho }}{\textstyle{{{{\rm{\lambda }}^3}} \over {{E_{\rm{f}}}{d_{\rm{f}}}^4}}}}}} {\rm{d\rho }}\quad {\rm{.}}$$
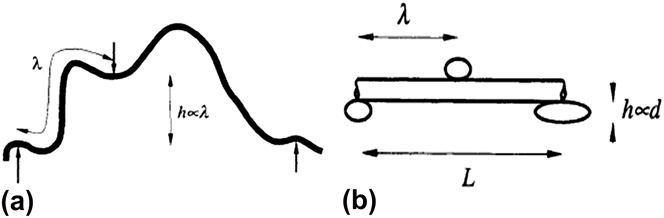
The height of the deformation unit h is different for 2D and 3D random materials (Fig. 9). In the first case, it is proportional to the distance between contacts, which is inversely proportional to the relative density. In the second case, it is proportional to the diameter of the fibers. By integrating Eq. (6), Eq. (1) is found with n equal to 3 for 3D random distribution and equal to 5 for 2D random distribution.
Schematic representation of deformation unit used in Toll’s model for 3D distribution (a) and 2D distribution (b), from Ref. Reference van Wyk20.
In the particular case of the studied steel wools, as the orientation of fibers is close to 2D and aligned fibers, the height of the deformation unit is the fibers diameter, and the number of contacts per unit of volume is taken as expressed in Eq. (4). For the distance between contacts, it is defined as follows:
 $${\rm{\lambda }} = {{{l_{\rm{f}}}} \over {{N_{{\rm{cf}}}}}}\quad ,$$
where N cf is the number of contacts per fibers and l f is the fibers length. By definition, N cv is the product of the number of contacts per fibers divided by two (each contact is linked to two fibers) by the number of fibers per unit volume, which is simply expressed as:
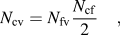 $${N_{{\rm{cv}}}} = {N_{{\rm{fv}}}}{{{N_{{\rm{cf}}}}} \over 2}\quad ,$$
with the number of fibers per unit of volume expressed as:
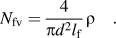 $${N_{{\rm{fv}}}} = {4 \over {{\rm{\pi }}{d^2}{l_{\rm{f}}}}}{\rm{\rho }}\quad .$$
Finally, the number of contacts per fibers can be expressed as
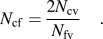 $${N_{{\rm{cf}}}} = {{2{N_{{\rm{cv}}}}} \over {{N_{{\rm{fv}}}}}}\quad .$$
Then λ is expressed as:
 $${\rm{\lambda }} \,\propto \,{{\rm{\rho }}^{1 - {\rm{\beta }}}}\quad .$$
Integration of Eq. (6) leads to Eq. (1) with an exponent depending on β as:
 $$n = 4{\rm{\beta }} - 3\quad .$$
Experimental and theoretical values of n are compared in Table I. The analysis leads to a good agreement between mechanical experiments and modified van Wyk–Toll approach thanks to structural characterization.
Comparison of experimental and theoretical exponent n of Toll’s model for nonsintered and sintered steel wools.
VI. CONCLUSIONS
In this study, three main points were followed. The first one was to develop and validate a method suitable to characterize the structure of entangled materials made of fibers. The aimed parameters are the orientation of the fibers and the number of contacts. The used technique was the skeletonization of the x-ray tomography images. First assessment of the method was performed on virtual materials to critically assess the possibility to use such a technique in the determination of the number of contacts and to look at the calibration needs. The minimal length of a contact and the critical distance between contacts were determined in the calibration step. Very good agreement between results obtained with this method and the numerical simulations were observed.
The second point was to characterize structural parameters for nonsintered and sintered steel wools with the developed method. The determined number of contacts was compared with the analytical model (tube model). This comparison revealed that the tube model can be used up to a relative density of 10% for both sintered and nonsintered steel wools. Beyond this relative density, the exponent of the power law for the number of contacts is closer to 1.5 than the expected value of 2 expected from the tube model.
The third point was to explain the mechanical behavior of steel wools. The exponent of the power law relationship between stress and relative density is ranging from 3 to 5 and increasing with the initial relative density. The prediction of the van Wyk–Toll’s approach is that the exponent is equal to 3 for 3D orientation and to 5 for 2D orientation. But the structural characterization showed that fibers orientation does not evolve when the initial relative density increases and is close to a 2D orientation. The analysis of the number of contacts exhibits that the exponent of the power law describing the number of contacts as a function of the relative density evolves when the initial relative density increases. This exponent varies from 2 to 1.5. By taking into account the results of the structural characterization into the integration of van Wyk–Toll’s approach, it was possible to explain the variation of the observed exponent.
ACKNOWLEDGMENT
The authors sincerely acknowledge Dr. Jérôme Adrien and Dr. Eric Maire for the possibility to perform x-ray tomography at MATEIS laboratory (INSA Lyon). Elodie Boller is also gratefully acknowledged for the help on ID19 at the ESRF.