Introduction
Down syndrome is the most common aneuploid disorder in infants, with a prevalence of about one in 770 live births.Reference Fryns and Buyse1 Phenotypic characteristics may result in specific otolaryngological symptoms, such as upper respiratory obstruction, sleep apnoea syndrome and hearing loss.Reference Shott, Amin, Chini, Heubi, Hotze and Akers2–Reference Shibahara and Sando5 Obstructive sleep apnoea is a frequent feature in Down syndrome patients, due to midfacial hypoplasia associated with narrowing of the pharynx, relative macroglossia, often large tonsils and adenoids, hypotonia, and a tendency to obesity.Reference Shott, Amin, Chini, Heubi, Hotze and Akers2–Reference Moura, Silveira, Andrade, Palha and Pais Clemente4 Surgical intervention to avoid hypoxaemia and possible pulmonary hypertension does not always correct the problem, and therapy using oxygen under pressure (via continuous positive airway pressure) during sleep is not easily tolerated.Reference Roizen and Patterson3 Otitis media with effusion is the most frequent cause of conductive hearing loss in children with Down syndrome.Reference Roizen and Patterson3, Reference Moura, Silveira, Andrade, Palha and Pais Clemente4 This condition is directly related to the craniofacial malformations, and aggressive monitoring and treatment are often required in order to maintain normal hearing.Reference Roizen and Patterson3–Reference Shibahara and Sando5
Rapid maxillary expansion is an orthodontic procedure used to correct a narrow transverse maxillary diameter. The two maxillary bones are separated at the mid-palatal suture using an intraoral screw mechanism. This leads to a widening of the perimeter of the arch, and also provides more space for alignment of crowded teeth. Although the major effect of rapid maxillary expansion is noticed clinically in the area of dentition, transverse enlargement of the apical bone may be considered an additional benefit, and this also affects the nasal width.Reference Cameron, Franchi, Baccetti and McNamara6 Usually, these changes result in altered nasal airway flow, with consequently improved nasal ventilation.Reference White, Woodside and Cole7 Because of the close relationship between these structures and the functions they perform, several functions related to the orofacial muscles may also improve.Reference Marchesan8
These considerations led us to perform the first study in children with Down syndrome which analysed the effect of rapid maxillary expansion on the evolution of ENT symptoms and on functionally related parameters.
Materials and methods
Patients
As a complement to the previously published clinical trial assessing nasal patency in children with Down syndrome undergoing rapid maxillary expansion, described by Moura and colleagues,Reference Moura, Vales, Andrade, Cunha, Barros and Pueschel9 a paediatric dentist and an otolaryngologist examined the Down syndrome children periodically until the end of the treatment.
As described in this previous report,Reference Moura, Vales, Andrade, Cunha, Barros and Pueschel9 the criteria for inclusion were: (1) cytogenetic diagnosis of trisomy 21; (2) age between four and 12 years; (3) persistent nasal obstruction and/or repeated upper respiratory tract infections (i.e. more than three episodes in six months, or four episodes in a year); (4) presence of lateral crossbite and/or signs of maxillary compression; (5) adequate cooperation of patient and parents; and (6) informed consent from their legal representatives. The need for otolaryngological surgery or orthodontic treatment during the study period was considered an exclusion criterion.
Approval was obtained from the research ethics committees of the various institutions involved.
Of the 106 eligible children with Down syndrome, 26 were selected. These 26 were then divided into three groups according to age: four to six, seven to nine, and ten to 12 years. Children from each of these subgroups were randomly allocated, by using a random digits table, to receive either rapid maxillary expansion or no specific treatment.
ENT and speech evaluation
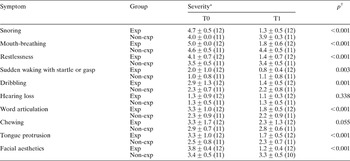
A structured interview was used to question parents about the presence of clinical signs associated with upper airway obstruction during sleep, and to evaluate other symptoms such as hearing loss, tongue protrusion, chewing difficulty and facial aesthetics (Table I). We also recorded the number of ENT infections (e.g. adenoiditis, tonsillitis and otitis) occurring during the previous year, as reported by the patient's primary care physician, paediatrician or otorhinolaryngologist in the individual paediatric health register of the Portuguese National Health Care System. All children were submitted to a blinded tympanogram (Damplex® Tymp 87, G N ReSound Group, Taastrup, Denmark and, when the individual cooperated, a pure tone audiogram (Amplaid® 319, Amplaid Biomedical Line, Amplifon, Milan, Italy). Two speech therapists prepared a set of scales that allowed blindly randomised analysis of mobility and orofacial muscle function, including articulation of European Portuguese patterned speech sounds.Reference Marchesan8, Reference Pinto10, Reference González and Lopez11 For all parameters, a higher score indicated better function.
ENT symptom severity: results of questionnaire

Data are presented as mean ± standard deviation (sample size). *Graded from one (none) to five (severe). †Mann–Whitney test, comparing T1–T0 between groups; significance level with Bonferronni correction (0.05/10) = 0.005. T0 = pre-treatment; T1 = post-treatment; exp = rapid maxillary expansion; non-exp = no rapid maxillary expansion
Cephalometric analysis
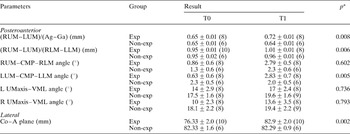
For each patient, lateral and posteroanterior cephalograms were performed. Cephalometic studies were blindly randomised, and evaluation was completed by the same observer using the NemoCeph® NX 2005 software program (NemoCeph® NX 2005, Nemotec, Madrid, Spain) (Figure 1 and Table II). Despite difficulty placing the head of a Down syndrome child on the cephalostat, the Frankfurt horizontal plane, the line between the porion and orbitale, was used as the horizontal reference.Reference Ricketts, Roth, Chaconas, Schulhof and Engel12 Some additional measurements of linear ratios were adopted to minimise inaccuracies in the radiographs. These ratios included the relation between the upper inter-molar distance (i.e. the distance between the right and left upper molars) and the mandibular width (i.e. the distance between the right and left ante-gonions), and the quotient between the upper inter-molar distance and the lower inter-molar distance (the latter being the distance between the right and left lower molars).
(a) Lateral and (b) posteroanterior cephalometric diagrams illustrating the main measurements used. S = sella turcica; N = nasion; Po = porion; Ptm = pterygomaxillary fissure; Or = orbitale; Co = mandibular condyle; Ba = basion; PNS = posterior nasal spine; ANS = anterior nasal spine; A = subspinale; B = supramentale; Gn = gnathion; CMP = constructed mean point; RUM = right upper molar; LUM = left upper molar; RLM = right lower molar; LLM = left lower molar; Ag = right ante-gonion; Ga = left ante-gonion

Radiological cephalometry

Data are presented as mean ± standard error of mean (sample size). *Mann–Whitney test, comparing T1–T0 between groups; significance level with Bonferronni correction (0.05/7) = 0.007. T0 = pre-treatment; T1 = post-treatment; RUM = right upper molar; LUM = left upper molar; Ag = right ante-gonion; Ga = left ante-gonion; exp = rapid maxillary expansion; non-exp = no rapid maxillary expansion; RLM = right lower molar; LLM = left lower molar; CMP = constructed mean point; L = left; R = right; Umaxis = long mean axis of upper molar; VML = line between CMP and ANS = anterior nasal spine; Co = mandibular condyle; A = subspinale
Maxillary expansion
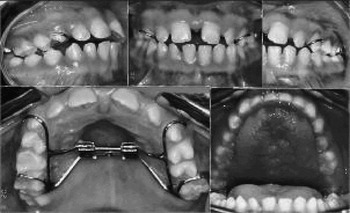
The intraoral maxillary expansion device was used in 13 children with Down syndrome; these constituted the rapid maxillary expansion group. The maxillary bones were separated at the midline suture using a screw mechanism, with activation rates of the order of 0.3–0.5 mm per day (Figure 2). The treatment period consisted of two to four weeks of appliance activation, obtaining 4–8 mm of expansion; this was then stabilised by five months of retention. The appliance was then removed.
Rapid maxillary expansion device and results.

In both the expanded and non-expanded groups, we compared the results of: detailed examination of the ears (including pneumatic otoscopy), nose and throat; speech evaluation; cephalography; and the otolaryngological questionnaire. These results were compared before application of the intraoral device, and after the treatment period (i.e. approximately six months after the first assessment). Based on the number of infections that occurred during the observation period, the rate of infections (number of infections per year) was estimated.
Four children were excluded from the study, three from the non-expanded group (because their parents had no time or lived far away; in one case, a patient's father died) and one from the expanded group (because of pneumonia requiring intensive care unit treatment). One additional ear from the non-expanded group was excluded because of surgery for chronic otitis media.
Statistics
Within each of the treatment groups, for the different variables under study, the effect of time was analysed using the non-parametric Wilcoxon test for pair-wise comparisons. Evolution of different variables between the two assessment points was computed, and differences between treatment groups were analysed using the non-parametric Mann–Whitney test for unpaired comparison. For comparison of the number of ENT infections that occurred in both groups during the observation period, an analysis of variance was performed using the number of infections occurring during the year before treatment as a covariate. Bonferroni correction was employed when multiple variables were under study. All statistical analysis was performed using the Statistical Package for the Social Sciences® version 12.0 software for Windows (SPSS Inc, Chicago, Illinois, USA).
Results
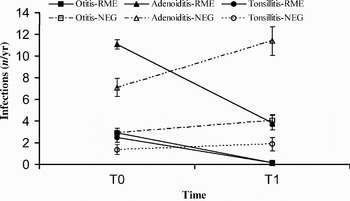
Evaluation of the yearly frequency of all types of otolaryngological infection occurring during the observation period revealed that the incidence of acute otitis media, adenoiditis and tonsillitis was significantly reduced in the rapid maxillary expansion group (Figure 3). Further in the text, changes on Otolaryngological infections will be discussed as a whole.
Otolaryngological infections (from questionnaire data) pre-treatment (T0) and post-treatment (T1). Whiskers indicate standard error of the mean. p < 0.001 for analysis of covariance, comparing T1 values for the two groups, corrected for the number of infections during T0. RME = rapid maxillary expansion group (n = 12); NEG = non-expanded group (n = 11); yr = year

The remaining questionnaire results (Table I) indicate that the parents of expanded children considered them significantly improved with regard to respiratory obstruction, snoring, mouth-breathing, restlessness, sudden wakening with a startle or gasp, and dribbling. The parents also felt that there had been a considerable reduction in tongue protrusion and an improvement in word articulation, chewing and facial aesthetics. These changes were not noted in the control group. Parents from both groups mentioned that their children did not have hearing difficulties.
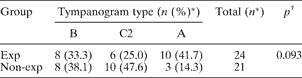
All children of both groups had a type B tympanogram during the initial assessment period (T0), with presence of middle-ear effusion confirmed on otoscopy. Comparing the results of the initial and post-treatment assessments, the expanded group's results differed from those of the non-expanded group (p < 0.100) (Table III). However, when the degree of improvement was considered, there was a significant difference between the groups, with a larger proportion of type A traces in the rapid maxillary expansion group (chi-square test, p < 0.05). When audiometric data were compared for the initial and post-treatment assessments, both groups showed a significant improvement, but the rapid maxillary expansion group had improved more (p < 0.001) (Table IV). When audiometric evolution was compared for the two groups, a considerable difference was noted, with a greater gain in the rapid maxillary expansion group (Table V).
Post-treatment tympanography
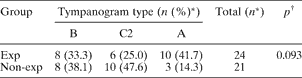
* Ears. †Chi-square test. Tympanogram types: B = flattened; C = negative pressure; A = normal; Exp = rapid maxillary expansion; non-exp = no rapid maxillary expansion
Pre- and post-treatment pure tone averages*

Data represent mean ± 95% confidence interval (n), for ears.
* Air conduction ((500 + 1000 + 2000)/3). †Wilcoxon test. Exp = rapid maxillary expansion; non-exp = no rapid maxillary expansion
Change in pure tone average* with treatment

Data represent mean ± 95% confidence interval (n), for ears.
* Air conduction. †Non-parametric Mann–Whitney test. ‡Pre-treatment values − post-treatment values. Exp = rapid maxillary expansion; non-exp = no rapid maxillary expansion
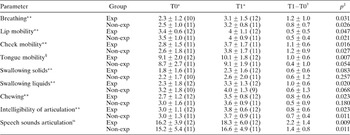
No significant differences in speech therapy parameters (or in the evolution of these parameters) were observed in either group, comparing the pre- and post-treatment assessments (Table VI).
Speech therapy parameters

* Data represent mean ± standard deviation (n) for subjects. †Data represent mean ± 95% confidence interval for subjects. ‡Wilcoxon test, comparing differences between T0 and T1 for each group; significant level with Bonferronni correction (0.05/9) = 0.006. **Five-point scale; §10-point scale; α20-point scale. T0 = pre-treatment assessment; T1 = post-treatment assessment; exp = rapid maxillary expansion; non-exp = no rapid maxillary expansion
Of the original 26 children with Down syndrome, eight patients were eliminated from the radiological study because they had poor quality radiographs. Of the remaining 16 children, 10 were from the rapid maxillary expansion group and six were from the control group. Regarding the lateral radiographic data, only the over-jet and the distance between the mandibular condyle and subspinale (i.e. the deepest midline point on the anterior concavity of the premaxilla) showed significant differences, with a larger change in the rapid maxillary expansion group, comparing pre- and post-treatment measurements (Table II and Figure 1). Regarding the posteroanterior cephalometric results, a significant increase was seen in the ratios between the upper inter-molar distance and the mandibular distance, and between the upper inter-molar and lower inter-molar distances. Moreover, a significant increase in the left upper molar – constructed mean point – left lower molar angle was observed in the treated group. In addition, the right upper molar – constructed mean point – right lower molar angle showed a considerable increase in the rapid maxillary expansion group compared with the control group, comparing pre- and post-treatment measurements; however, this change was not statistically significant. All the other cephalometric variables studied were not statistically significantly different (Table II and Figure 1).
Discussion
The present study evaluated the effects of rapid maxillary expansion therapy on the evolution of otolaryngological symptoms in a group of children with Down syndrome. This was the first such study performed in Down syndrome subjects.
Rapid maxillary expansion is a well established treatment in the general paediatric population.Reference Cameron, Franchi, Baccetti and McNamara6, Reference White, Woodside and Cole7 Gray described a 60 per cent reduction in the incidence of upper respiratory tract infections after rapid maxillary expansion, and 87 per cent of patients in that study changed from mouth-breathing to nose-breathing.Reference Gray13 Timms reported an improvement in nasal patency in 91 per cent of subjects after rapid maxillary expansion.Reference Timms14 Following rapid maxillary expansion, the greatest skeletal movement is observed in the inferior and anterior directions.Reference Chung and Font15 The separated palatine bones widen the maxilla, and there is often some splaying of the pterygoid process of the sphenoid bone. Also, the lateral walls of the nasal cavity incline outwards, taking with them the inferior turbinate and enlarging the airway.Reference Cameron, Franchi, Baccetti and McNamara6, Reference Moura, Vales, Andrade, Cunha, Barros and Pueschel9, Reference Timms14 Warren and co-workers found that the nasal area increased 45 per cent after rapid maxillary expansion, and that this expansion was particularly effective in increasing the width of the nasal valve area.Reference Warren, Hershey, Turvey, Hinton and Hairfield16 Basciftci and colleagues showed that the respiratory area and the ratio of respiratory area to nasopharyngeal area increased following rapid maxillary expansion.Reference Basciftci, Mutlu, Karaman, Malkoc and Kuçukkolbasi17
In our study, the significant improvements in the upper inter-molar distance and the distance between the mandibular condyle and subspinale reflect an increase of the transverse and sagittal dimensions of the maxillary complex, which can be related to an enlarged nasal area (Table II, Fig. 1). These results were reinforced by the evaluation of nasal patency by acoustic rhinometry, which showed that the rapid maxillary expansion group had a significant increase in total nasal volume, compared with the non-expanded group.Reference Moura, Vales, Andrade, Cunha, Barros and Pueschel9
All these skeletal changes may progressively promote mucus drainage, help to eliminate nasal secretions, decrease nasal oedema, improve mucociliary clearance, reduce mucosal inflammation and reduce infections. These effects are also reflected in the mucosa of the middle ear, with a reduced incidence of otitis media. These factors may explain the general improvement observed in the rapid maxillary expansion group, including the changes reported by parents. However, it is of note that the parents of this group were highly motivated and the treatment was very demanding of them, requiring frequent travel. Despite the subjectivity of parental questionnaires, parents’ experience and assessment are a valuable complement to the other results, providing information about the efforts required and the benefits reaped, both of which must be considered when assessing the overall advantages of treatment. Polysomnographic assessment before and after treatment would have been of great relevance, allowing an objective assessment of the evolution of upper airway obstruction; however, this tool was not available to the present study.
Despite the absence of significant differences in speech therapy parameters, such variables as speech sound articulation and tongue mobility showed more improvement in the rapid maxillary expansion group than the control group, presumably due to the increased space in the oral cavity which permitted better mobility and hence more intelligible speech. Mouth-breathing was still observed post-treatment, especially when the child was involved in various activities. This may have been due to an as yet unaltered mouth-breathing habit, or due to difficulty in keeping the mouth closed when involved in activities. These factors may have been responsible for the differences between expanded and non-expanded groups regarding similar parameters such as breathing (Table VI) and mouth-breathing (Table I). As the differences between the two groups were not apparent on speech therapy evaluation, one may assume that the improvement reported by parents may be based on their subjective interpretation, due to a possible placebo effect; this may represent a study limitation. However, it is notable that analyses of objective parameters (e.g. number of otolaryngological infections) and audiological data showed an improvement in the rapid maxillary expansion group. Moreover, any hearing threshold improvement is valuable in this group of children, as they suffer marked language difficulties.
Our study results indicated enhanced patency of the upper airway and increased space in the oral cavity. In consequence, a reduction in tongue protrusion and dribbling was observed. These effects, in addition to enlargement of the maxilla, often resulted in the aesthetic improvement noted by parents of the rapid maxillary expansion children. Cephalometric evaluation showed a substantial improvement in the upper inter-molar distance in the treated group. This improvement was validated when compared with the mandibular distance (i.e. right to left ante-gonion distance) and with the lower inter-molar distance, neither of which showed any significant change as a result of treatment. The enlargement in intra-oral space for the tongue was accomplished mainly by maxillary enlargement, as demonstrated by significant improvement in the upper inter-molar width and the distance between the mandibular condyle and subspinale. This enlargement was achieved without any significant lateral inclination of the upper molars, as indicated by the angle between the long mean axis of the upper molar and the vertical midline (i.e. the line between the constructed mean point and the anterior nasal spine), on both the right and left sides.
• Rapid maxillary expansion is an orthodontic procedure used to correct the narrow transverse maxillary diameter found in patients with Down syndrome
• This study is the first to analyse the effect, in Down syndrome children, of rapid maxillary expansion on the evolution of otolaryngological symptoms and on functionally related parameters
• Rapid maxillary expansion appeared to bring about a reduction in hearing loss in Down syndrome children
• In this group, this treatment also appeared to decrease the incidence of upper airway obstruction symptoms and the frequency of acute otitis media, adenoiditis and tonsillitis
It should be emphasised that parents from both groups considered that their child did not have hearing difficulties, despite the results of the audiological tests. Thus, there is a need for health workers to recommend screening for, and treatment of, hearing loss in this group of children.Reference Moura, Silveira, Andrade, Palha and Pais Clemente4
Our study results may represent the effect of possible initial over-expansion of the maxillary bone produced by standardised rapid maxillary expansion. The long-term effects of rapid maxillary expansion appear to cause some enhanced transverse growth of craniofacial structures.Reference Cameron, Franchi, Baccetti and McNamara6 Results need to be re-evaluated to verify that improvements are maintained over time.
In phenotypic Down syndrome children, rapid maxillary expansion must be considered in order to correct some of the typical midfacial skeletal deformities.Reference Cameron, Franchi, Baccetti and McNamara6, Reference White, Woodside and Cole7, Reference Ricketts, Roth, Chaconas, Schulhof and Engel12, Reference Gray13 In the present study, the calculation of sample size, based on the audiometric data, determined 14 children for each group. Therefore, due to this small sample size, this investigation should be considered a pilot study, and our results should be confirmed in a larger group of children.
Conclusion
Rapid maxillary expansion appears to bring about a reduction in hearing loss in children with Down syndrome. In this group, such treatment also appears concomitantly to decrease the incidence of upper airway obstruction symptoms and the frequency of acute otitis media, adenoiditis and tonsillitis. Rapid maxillary expansion may be carried out concomitantly with other surgical procedures for the treatment of upper airway obstruction, sleep apnoea and chronic otitis media with effusion.
Acknowledgements
We would like to express our gratitude to David Stevenson for his valuable assistance in the English writing of the manuscript.