



Introduction
The transition from the Mesozoic to the Cenozoic (66 Ma) marks one of the largest terrestrial mass extinction events in Earth's history, shifting vertebrate ecosystems from dinosaur dominated to mammal dominated (Brusatte et al. Reference Brusatte, Butler, Barrett, Carrano, Evans, Lloyd, Mannion, Norell, Peppe, Upchurch and Williamson2015). As the most recent of the “big five” mass extinctions, the Cretaceous–Paleogene (K/Pg) extinction has been studied intensely, resulting in one of the best-sampled fossil records of these major mass extinctions (Sloan Reference Sloan and Churcher1976; Russell Reference Russell1977; Alvarez et al. Reference Alvarez, Alvarez, Asaro and Michel1980; Clemens et al. Reference Clemens, Archibald and Hickey1981; Krassilov Reference Krassilov1981; Benton Reference Benton1985; Galbreath Reference Galbreath1988; Archibald Reference Archibald1992; Clemens Reference Clemens1992; Novacek Reference Novacek1999; Buffetaut Reference Buffetaut2004; Archibald and MacLeod Reference Archibald, MacLeod and Levin2007; Krug et al. Reference Krug, Jablonski and Valentine2009; Archibald et al. Reference Archibald, Clemens, Padian, Rowe, Macleod, Barrett, Gale, Holroyd, Sues and Arens2010; Schulte et al. Reference Schulte, Alegret, Arenillas, Arz, Barton, Bown, Bralower, Christeson, Claeys and Cockell2010; Larson et al. Reference Larson, Brown and Evans2016; Bazzi et al. Reference Bazzi, Kear, Blom, Ahlberg and Campione2018; Schoene et al. Reference Schoene, Eddy, Samperton, Keller, Keller, Adatte and Khadri2019). Accordingly, it is arguably our best window into the causes and consequences of mass extinctions and provides invaluable insights into our current biodiversity crisis (Novacek and Cleland Reference Novacek and Cleland2001; Barnosky et al. Reference Barnosky, Matzke, Tomiya, Wogan, Swartz, Quental, Marshall, McGuire, Lindsey, McGuire, Mersey and Ferrer2011; Payne et al. Reference Payne, Bush, Heim, Knope and McCauley2016). However, substage-level understandings of diversity dynamics, ecological interactions, and abundance patterns of terrestrial vertebrates leading up to the K/Pg transition are limited to a few basins worldwide (Brusatte et al. Reference Brusatte, Butler, Barrett, Carrano, Evans, Lloyd, Mannion, Norell, Peppe, Upchurch and Williamson2015). Of these, the Hell Creek Formation and equivalent terrestrial beds in the Western Interior Basin of the northwestern United States represent, by far, the best studied and sampled example of a latest Maastrichtian dinosaur-dominated ecosystem (Fig. 1, Supplementary Table 1).
Distribution and magnitude of Maastrichtian-aged dinosaur occurrences (from the PBDB) by formation showing the significance of the Hell Creek and Lance Formations in terms of sample sizes. A, Global equirectangular projection with circles indicating the relative position of 200 Maastrichtian dinosaur-bearing formations. Circle size (radius) is scaled to the number of recorded occurrences as a proxy for the research intensity/dataset size. B, Bar graph comparing the number of recorded dinosaur occurrences for 200 Maastrichtian-aged formations, with inset showing the top 10. Hell Creek and Lance Formations are illustrated in red and partially filled.
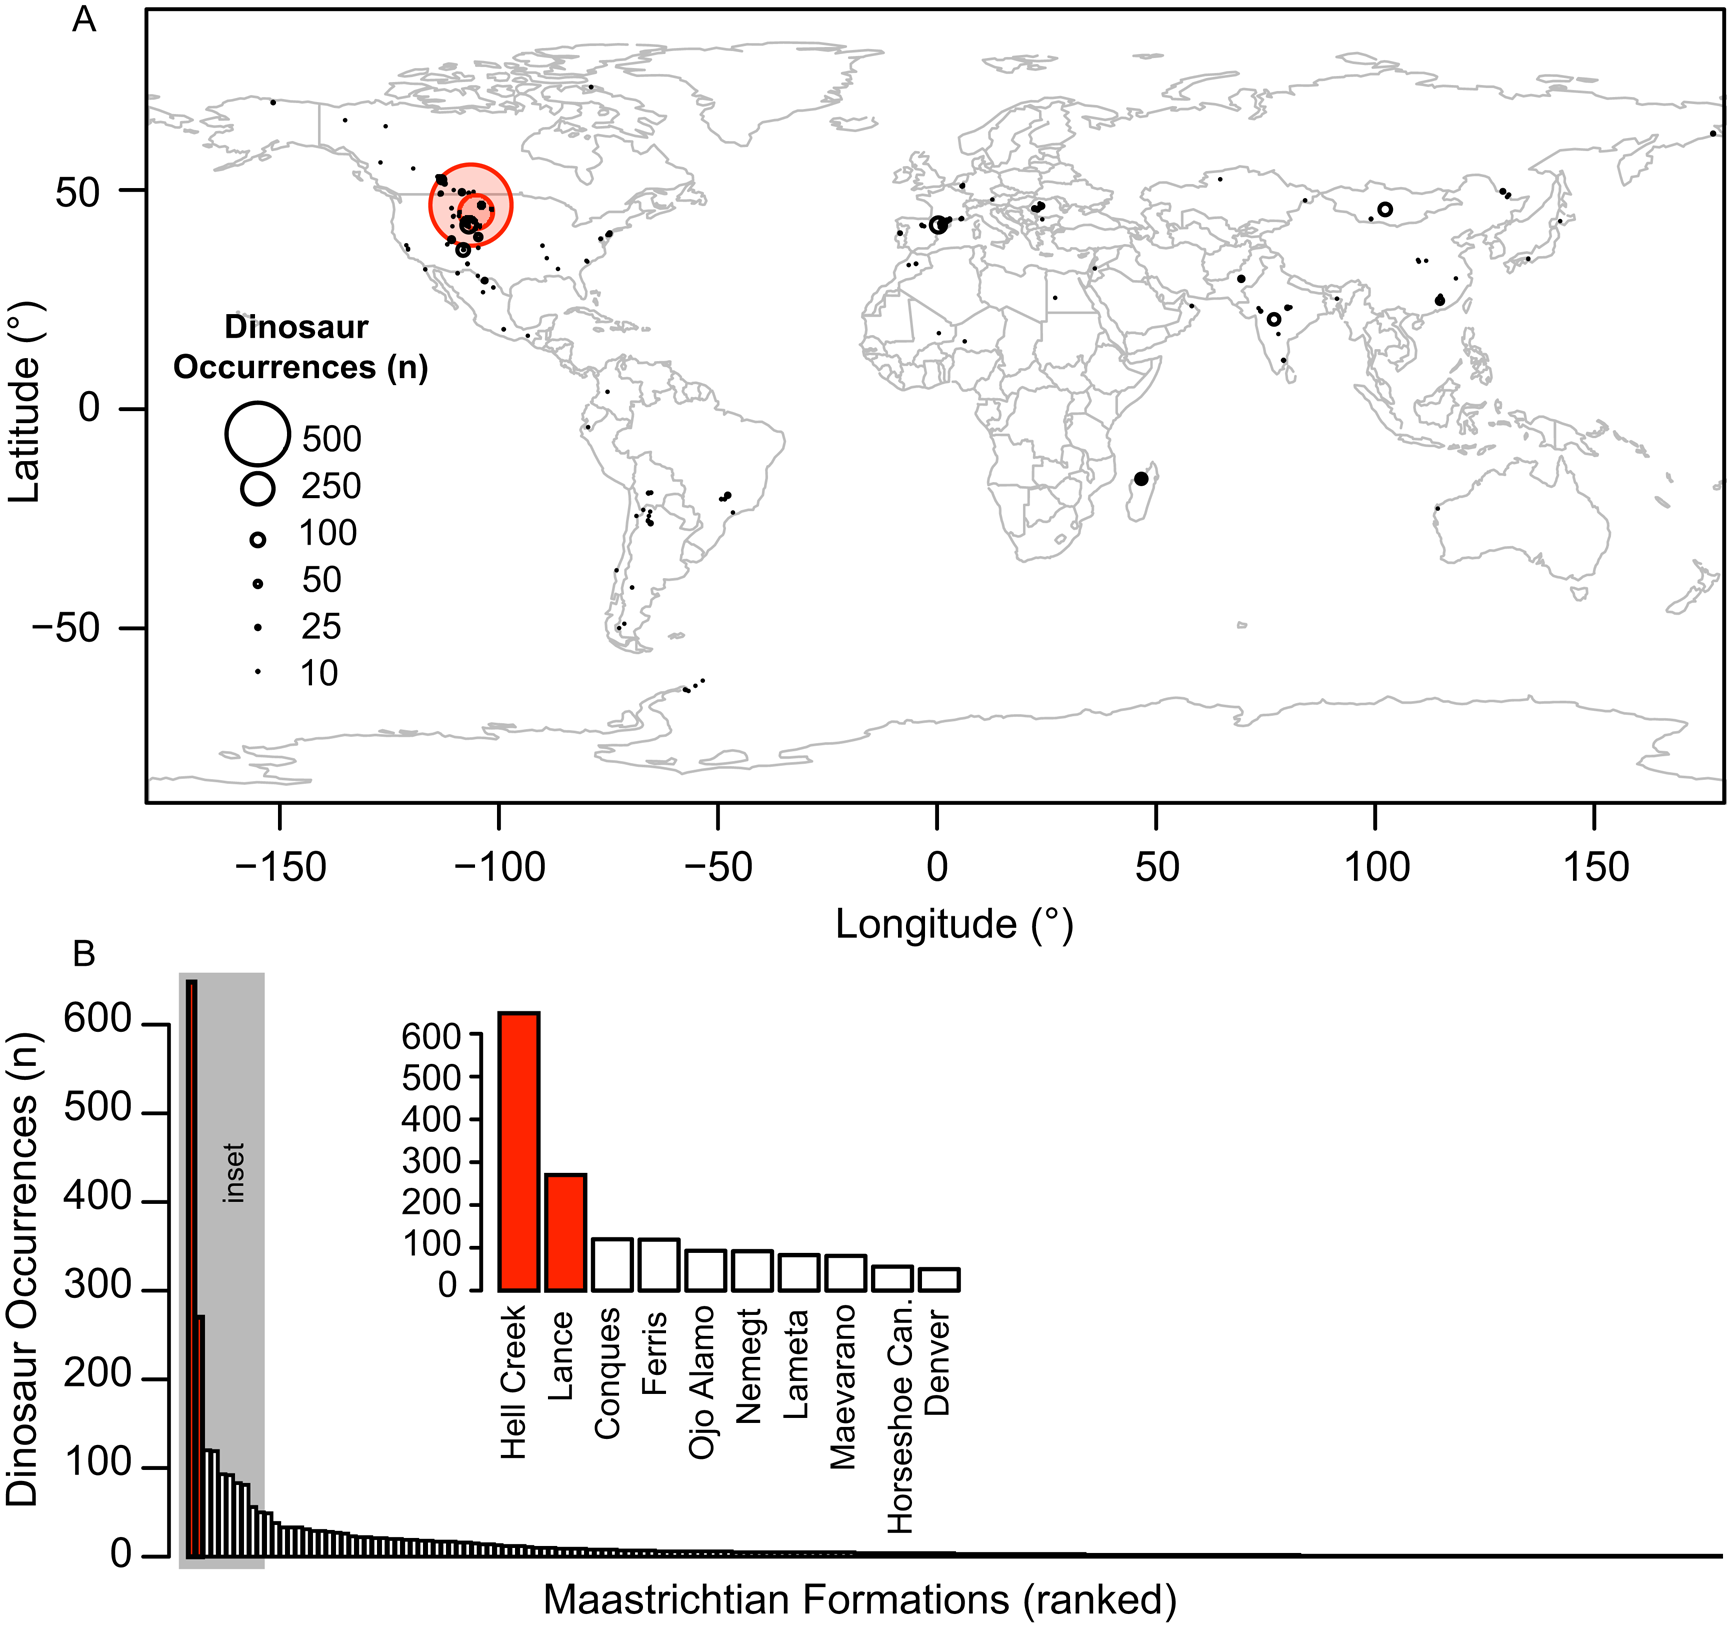
As the Hell Creek Formation and equivalent beds provide a fossiliferous, accessible, and meter-scale framework for detailed diversity studies, these deposits have served as the model for understanding the tempo and mode of terrestrial vertebrate extinctions at the K/Pg for well over three decades (Pearson et al. Reference Pearson, Schaefer, Johnson, Nichols and Hunter2002; Russell and Manabe Reference Russell and Manabe2002; Horner et al. Reference Horner, Goodwin and Myhrvold2011; Lyson et al. Reference Lyson, Bercovici, Chester, Sargis, Pearson and Joyce2011; Tobin et al. Reference Tobin, Wilson, Eiler and Hartman2014; Wilson et al. Reference Wilson, Clemens, Horner and Hartman2014a; Sprain et al. Reference Sprain, Renne, Wilson and Clemens2015; Fastovsky and Bercovici Reference Fastovsky and Bercovici2016; DePalma et al. Reference DePalma, Smit, Burnham, Kuiper, Manning, Oleinik, Larson, Maurrasse, Vellekoop, Richards, Gurche and Alvarez2019; García-Girón et al. Reference García-Girón, Heino, Alahuhta, Chiarenza and Brusatte2021). Meter-scale analyses of the diversity/richness, taxonomic composition, and relative abundances of individual taxa leading up to and through the K/Pg boundary include mammals (Wilson Reference Wilson2005, Reference Wilson2014; Wilson Reference Wilson2013; DeBey and Wilson Reference DeBey and Wilson2014, Reference DeBey and Wilson2017), amphibians (Wilson et al. Reference Wilson, DeMar and Carter2014b), turtles and lizards (Longrich et al. Reference Longrich, Bhullar and Gauthier2012; Holroyd et al. Reference Holroyd, Wilson and Hutchison2014), and dinosaurs (Sloan et al. Reference Sloan, Rigby, Keith, Van Valen and Gabriel1986; Sheehan et al. Reference Sheehan, Fastovsky, Hoffmann, Berghaus and Gabriel1991, Reference Sheehan, Fastovsky, Barreto and Hoffmann2000; Fastovsky and Sheehan Reference Fastovsky and Sheehan2005; Fastovsky and Weishampel Reference Fastovsky and Weishampel2005; Horner et al. Reference Horner, Goodwin and Myhrvold2011; Longrich et al. Reference Longrich, Tokaryk and Field2011; Lyson et al. Reference Lyson, Bercovici, Chester, Sargis, Pearson and Joyce2011; Stein Reference Stein2019), as well as the entire fauna (Pearson et al. Reference Pearson, Schaefer, Johnson, Nichols and Hunter2002; DePalma et al. Reference DePalma, Smit, Burnham, Kuiper, Manning, Oleinik, Larson, Maurrasse, Vellekoop, Richards, Gurche and Alvarez2019). In terms of temporal resolution and fossil abundance, nowhere else in the world comes close to the Hell Creek and Lance Formations, which have generated approximately one-third of dinosaur occurrences for the entire Maastrichtian stage globally (Fig. 1, Supplementary Table 1). Because of the sheer amount of data from the Hell Creek Formation, its inclusion into global-scale analyses, particularly for the Maastrichtian, will inevitably swamp the signal. Accordingly, to understand the role the Hell Creek fauna plays in larger-scale datasets aimed at assessing diversity dynamics (e.g., Wilson Reference Wilson2014), it is paramount that we first explore the underlying taphonomic and sampling biases present within these important deposits. For instance, historical collections for museum display specimens were biased toward complete Triceratops skulls from the Hell Creek Formation. These biases resulted in the preferential sampling of sandstone and siltstone lithologies for museum display specimens to the exclusion of mudstone facies, which preserve incomplete but taxonomically and ontogenetically important specimens (Goodwin and Horner Reference Goodwin, Horner, Ryan, Chinnery-Algeier and Eberth2010). The recognition of such collection biases led to their subsequent rectification and, eventually, to a much better understanding of dinosaur growth, evolution, and diversity during this time (Horner and Goodwin Reference Horner and Goodwin2006, Reference Horner and Goodwin2008; Goodwin and Horner Reference Goodwin, Horner, Ryan, Chinnery-Algeier and Eberth2010; Horner et al. Reference Horner, Goodwin and Myhrvold2011; Lyson and Longrich Reference Lyson and Longrich2011; Scannella et al. Reference Scannella, Fowler, Goodwin and Horner2014).
By contrast, detailed studies that explore the potential of preservational (taphonomic) biases to skew our view of faunal composition in the Hell Creek Formation, and equivalent, are rare (but see Wilson Reference Wilson2008; Stein Reference Stein2019). Dinosaur-dominated assemblages often show distinct differences from modern, generally mammal-dominated, assemblages, with one of the largest distinctions being the pattern of body-size distributions (O'Gorman and Hone Reference O'Gorman and Hone2013). Modern terrestrial assemblages show a consistent positive skew in the body-size distribution, with a higher diversity (i.e., richness) of small taxa and lower diversity of large taxa (Blackburn and Gaston Reference Blackburn and Gaston1994, Reference Blackburn and Gaston1996; Clauset and Erwin Reference Clauset and Erwin2008). By contrast, dinosaur-dominated assemblages often show a negative skew, with higher diversity of larger taxa and lower diversity of small taxa (Barrett et al. Reference Barrett, McGowan and Page2009; Butler et al. Reference Butler, Benson, Carrano, Mannion and Upchurch2011; O'Gorman and Hone Reference O'Gorman and Hone2013; Benson Reference Benson2018). As a result, research regarding dinosaur assemblages took two contrasting viewpoints when inferring the mechanisms behind these differential size distributions.
On the one hand, the pattern of dinosaur size distributions can be interpreted as a real biological phenomenon; the result of intrinsic ecological or physiological differences between mammals and dinosaurs, such as through the competitive exclusion of small-bodied dinosaurs by juveniles of larger species (Richmond Reference Richmond1965; Varricchio Reference Varricchio2011; Codron et al. Reference Codron, Carbone, Müller and Clauss2012, Reference Codron, Carbone, Muller and Clauss2013; O'Gorman and Hone Reference O'Gorman and Hone2013; Schroeder et al. Reference Schroeder, Lyons and Smith2021). On the other hand, a negatively skewed body-size distribution pattern may result from large taphonomic and/or collection biases toward large-bodied taxa (Behrensmeyer et al. Reference Behrensmeyer, Western and Dechant Boaz1979; Farlow Reference Farlow1993; Peczkis Reference Peczkis1994; Farlow et al. Reference Farlow, Dodson and Chinsamy1995; Brown et al. Reference Brown, Campione, Giacomini, O'Brien, Vavrek and Evans2013a,Reference Brown, Evans, Campione, O'Brien and Eberthb; Benson Reference Benson2018; Darroch et al. Reference Darroch, Fraser and Casey2021). Such a bias was detected and quantified in the Dinosaur Park Formation (Brown et al. Reference Brown, Campione, Giacomini, O'Brien, Vavrek and Evans2013a,Reference Brown, Evans, Campione, O'Brien and Eberthb), is supported by contrasting body-size distributions between Recent and fossil (last 10 Ma) mammals (Benson Reference Benson2018), and contrasts with typically positively skewed size distributions in Lagerstätte-type deposits of the Jehol (Benson Reference Benson2018). In addition to the physiological and ecological ramifications of body-size distributions, the debate regarding the relative importance of taphonomic versus biological factors in shaping these patterns has major implications for interpretations of extinction mechanisms. Body size is implicated as a major factor for extinction vulnerability (Raup Reference Raup1986; Gaston and Blackburn Reference Gaston and Blackburn1995; Jablonski et al. Reference Jablonski, Jablonski, Erwin and Lipps1996; Cardillo and Bromham Reference Cardillo and Bromham2001; Cardillo et al. Reference Cardillo, Mace, Jones, Bielby, Bininda-Emonds, Sechrest, Orme and Purvis2005; Olden et al. Reference Olden, Hogan and Zanden2007; Payne and Heim Reference Payne and Heim2020), including as a hypothesized extinction filter at the end-Cretaceous extinction event (Bakker Reference Bakker1977; Russell Reference Russell1977; Buffetaut Reference Buffetaut1990; Archibald Reference Archibald2011; Wilson Reference Wilson2013; Benson et al. Reference Benson, Campione, Carrano, Mannion, Sullivan, Upchurch and Evans2014; Berv and Field Reference Berv and Field2018).
Given that the Hell Creek and Lance Formations disproportionately shape our understanding of diversity and extinction at the Mesozoic twilight, our study examines the taphonomic body-size patterns within these formations. We specifically concentrate on dinosaurs, which span a very large body-mass range that allows us to test the effects of body mass on preservation across several orders of magnitude. We compare the assemblage-level effect of body size on various taphonomic indicators, similar to work previously done for the Dinosaur Park Formation (Brown et al. Reference Brown, Campione, Giacomini, O'Brien, Vavrek and Evans2013a,Reference Brown, Campione, Giacomini, O'Brien, Vavrek and Evansb); test for the presence and magnitude of the relationships; and identify biases that impact our understanding of extinction dynamics at the K/Pg boundary.
Methods
Hell Creek Formation and Lance Formation Dinosaur Faunal Dataset
Recent debate regarding the taxonomic validity and synonymy of dinosaur species from the Hell Creek Formation, particularly relating to the effects of ontogeny (Boyd et al. Reference Boyd, Brown, Scheetz and Clarke2009; Horner and Goodwin Reference Horner and Goodwin2009; Ott and Larson Reference Ott, Larson, Ryan, Chinnery-Allgeier and Eberth2010; Scannella and Horner Reference Scannella and Horner2010, Reference Scannella and Horner2011; Campione and Evans Reference Campione and Evans2011; Farke Reference Farke2011; Longrich and Field Reference Longrich and Field2012; Larson Reference Larson, Parrish, Molnar, Currie and Koppelhus2013; Brusatte et al. Reference Brusatte, Carr, Williamson, Holtz, Hone and Williams2016; Schmerge and Rothschild Reference Schmerge and Rothschild2016; Woodward et al. Reference Woodward, Tremaine, Williams, Zanno, Horner and Myhrvold2020), has resulted in a lack of consensus regarding the alpha-level taxonomic diversity of dinosaurs in this formation. To account for this uncertainty, we assembled two faunal lists for the Hell Creek Formation, one that considers the majority of recently synonymized taxa as valid taxa on their own (“maximum taxonomic split” list, N Hell Creek split = 35 species; Supplementary Table 2) and another that considers all recently synonymized taxa as indeed junior synonyms (“maximum taxonomic lump” list, N Hell Creek lump = 25 species; Supplementary Table 2). A complete list of taxa considered valid in the split dataset and subjective junior synonymy under the lumped dataset is included in Supplementary Table 2. These contrasting faunal lists allow assessment of the effects of taxonomic opinion on taphonomic correlations.
We also tested the effect of paleobiogeographic and/or formational boundary faunas, considering that the dinosaur fauna was likely geographically cosmopolitan, at least within Laramidia (Lehman Reference Lehman1987, Reference Lehman, Tanke, Carpenter and Skrepnick2001; but see Vavrek and Larsson Reference Vavrek and Larsson2010; Lucas et al. Reference Lucas, Sullivan, Lichtig, Dalman and Jasinski2016). In a secondary analysis, we assembled a faunal list for the Lance Formation and combined it with that of the Hell Creek Formation. As with the exclusively Hell Creek faunal lists, we created a maximum taxonomic split and maximum taxonomic lump version of the combined Hell Creek + Lance fauna (Supplementary Table 2). This combined faunal list consists of 43 taxa for the maximum taxonomic split version (N Hell Creek + Lance split) and 33 taxa for the maximum taxonomic lump version (N Hell Creek + Lance lump). The main differences between the Hell Creek and Hell Creek + Lance faunal lists is the inclusion of multiple avian taxa known only from the Lance.
Dinosaur Body-Mass Estimation
Adult body mass was estimated for all dinosaur taxa (Supplementary Table 2). The majority of these estimates were made using predictive equations generated from linear regressions of limb measurements and body mass in extant taxa. A majority of the body-mass estimates (52%) were taken from Benson et al. (Reference Benson, Hunt, Carrano and Campione2018), which utilizes the quadrupedal and bipedal scaling formulae of Campione and Evans (Reference Campione and Evans2012) and Campione et al. (Reference Campione, Evans, Brown and Carrano2014) that is based on the minimum circumference of the femur and humerus. In several cases, for which comparatively little skeletal material is known for a species, body mass was estimated based on a close relative of similar size (e.g., Trierarchuncus was based on Albertonykus, Acheroraptor was based on Saurnitholestes, and Denversaurus was based on Edmontonia) or scaled relative to comparable elements (e.g., Sphaerotholus buccholtzae was based on dome length from Stegoceras validum, which has a comparable frontoparietal dome length). In other cases, a single body-mass estimate was used for closely related taxa of similar body size; for instance, Thescelosaurus garbanii and Bugenosaura infernalis were both based on Thescelosaurus neglectus. Body-mass estimates for taxa known only from teeth (e.g., Richardoestesia isosceles, Paronychodon sp.) were based on estimates of closely related taxa known from more complete material, such as Richardoestesia gilmorei, Dromaeosaurus albertensis, and Troodon inequalis (Carbone et al. Reference Carbone, Turvey and Bielby2011). Mass estimates for the avian sample (approximately one-third of the fauna) were derived from Longrich et al. (Reference Longrich, Tokaryk and Field2011), which uses scaling of the coracoid, though see Field et al. (Reference Field, Lynner, Brown and Darroch2013) and Serrano et al. (Reference Serrano, Palmqvist and Sanz2015) for additional scaling estimates.
Dinosaur Taxonomic Completeness Index and Taphonomic Mode
Each dinosaur species in the dataset was quantified in terms of its known completeness using the Skeletal Completeness Metric 2 of Mannion and Upchurch (Reference Mannion and Upchurch2010), as modified by Brown et al. (Reference Brown, Evans, Campione, O'Brien and Eberth2013b) (Supplementary Table 2). This metric examines all skeletal material for each species and determines the average percentage completeness for that species by dividing the skeleton into nine equally weighted regions; for more details, see Brown et al. (Reference Brown, Evans, Campione, O'Brien and Eberth2013b). The completeness index also attempts to account for differential completeness between the formations and the effect of synonymy. Each species was also assigned a taphonomic mode following the classification of Eberth and Currie (Reference Eberth, Currie, Currie and Koppelhus2005), as implemented in Brown et al. (Reference Brown, Evans, Campione, O'Brien and Eberth2013b). The most complete specimen reported in the literature from each taxon was assigned to a taphonomic mode that represents an ordered but categorical disarticulation continuum, from A, articulated (multiple bones from the same skeleton present, with more than 50% of these in natural life position), to B, associated (multiple bones from the same skeleton present, with 50% or fewer of these in natural life position), to C, isolated (individual bones/teeth fully removed from the context of the rest of the skeleton).
Dinosaur Species Discovery Curve Analysis
To assess the effect of body size on the identification of diversity in these units over time, species discovery curves (see Steyskal Reference Steyskal1965; Soberón and Llorente Reference Soberón and Llorente1993; Solow and Smith Reference Solow and Smith2005; Bebber et al. Reference Bebber, Marriott, Gaston, Harris and Scotland2007) were generated by compiling the dates of the first description for all dinosaur taxa in all lists from the literature (Supplementary Table 2). These dates considered the differential description dates of the same taxon between the Hell Creek and the Hell Creek + Lance faunal lists. The effect that synonymy may have on certain taxa was also taken into account. For each species, we determined “year of description” (YDe), which is the year of publication of the first description of that species based on Hell Creek material, following the methods of Brown et al. (Reference Brown, Evans, Campione, O'Brien and Eberth2013b). For each species, we also calculated “time to description” (t De), which is the difference between the year of description for that species and the year 1883, when the Hell Creek taxa were first described (Cope Reference Cope1883).
To test differences in discovery rates between taxa in the small and large size classes, the cumulative number of known taxa was plotted across a discovery timeline divided into 10-year bins. Although the current decade (2020–2029) is graphed, it is excluded from the analysis due to obvious incompleteness. Four models were fit to the data: linear (y = mx + b), logarithmic (y = mlog 10x + b), power (y = bx m), and exponential (y = be xm). Model fit was evaluated using the Akaike information criterion (AIC). Delta AIC values of 0 were considered the optimal model, with a threshold of 2.0 used to contrast the support of suboptimal models.
Dinosaur Census and Family-Level Comparisons
In the last four decades, there have been six major surveys or censuses of dinosaur richness and relative abundances within the Hell Creek Formation or Hell Creek Formation and coeval deposits (Lehman Reference Lehman1987; White et al. Reference White, Fastovsky and Sheehan1998; Russell and Manabe Reference Russell and Manabe2002; Horner et al. Reference Horner, Goodwin and Myhrvold2011; Lyson and Longrich Reference Lyson and Longrich2011; Stein Reference Stein2019) (Supplementary Table 3). Some of these surveys use abundance data based on articulated/associated skeletons, while others are based on more exhaustive datasets including microvertebrate sites. Data on relative abundance at the family level from these surveys were collected and plotted against average body mass for each family-level clade (derived from the taxonomically lumped datasets). Family body mass was estimated as the average mass of all taxa assigned to that family using the maximum taxonomic lumped dataset. The dataset of Stein (Reference Stein2019) is not directly comparable with the other surveys because Ankylosauridae & Nodosauridae, Troodontidae & Dromaeosauridae, and Leptoceratopsidae & Ceratopsidae were grouped in the analysis. Family-level abundance was analyzed as this is the taxonomic rank used most consistently in the published surveys. However, under a taxonomic lumped framework, many of these families become monospecific (i.e., Tyrannosauridae, Hadrosauridae, Thescelosauridae, Leptoceratopsidae, Ankylosauridae, Nodosauridae, Ornithomimidae, Alvarezsauridae, Troodontidae, Caenagnathidae) with the pattern therefore also at least partly consistent with a species-level analysis.
Specimen-Level Intraspecific Dinosaur Abundances as a Factor of Body Mass
We also investigated the effect of body size on taphonomic metrics at the intraspecific level in the most common large dinosaur taxa. Individuals of those taxa passed through most of the adult body-size bins used in this analysis throughout their ontogeny. We predict that, if body size is a taphonomic filter, correlations recovered at the interspecific level should be evident across the growth series of the largest-bodied species in the dataset. To test this, we compiled growth series of the four largest and most abundant dinosaurs in the Hell Creek Formation (Tyrannosaurus rex [n = 25], Edmontosaurus annectens [n = 16], Triceratops horridus, and Triceratops prorsus [n = 18) by collecting measurement data from articulated or associated specimens. Due to the limited number of overlapping bones among these taxa, several size proxies were used to maximize sampling. Proxies consisted of femur circumference and tooth-row length for T. rex, quadrate height for E. annectens, and basal-skull length for Triceratops. Data were collected from the literature (Forster Reference Forster1996; Horner and Goodwin Reference Horner and Goodwin2006; Larson Reference Larson, Larson and Carpenter2008; Campione and Evans Reference Campione and Evans2011) with additional specimen data from personal observations collected by all the authors (Supplementary Table 4). Here, we focused on articulated and associated skeletons or skulls, which comprise the most diagnostic fossils for these taxa; isolated and/or scattered bone-bed elements were not included. Data for Tyrannosaurus femora represent articulated or associated skeletons, whereas data for Tyrannosaurus dentaries and Edmontosaurus and Triceratops skulls represent articulated or associated skulls.
The faunal survey of Horner et al. (Reference Horner, Goodwin and Myhrvold2011) also contains relative abundance data of associated skeletons at four different size/age classes (small/juvenile, medium/subadult, large/adult, extra-large/large adult) of multiple taxa. To quantify the effect of body size on relative abundance within a taxon within the formation, the relative abundances of these different size classes were compared for the four most common genera (Triceratops, Tyrannosaurus, Edmontosaurus, and Thescelosaurus).
Hell Creek Formation Mammals
Although much of the project concentrates on the fossil record of dinosaurs, given their large range of body masses, a subset of parallel analyses was performed on the Hell Creek Formation mammal assemblage. A mammal faunal list was compiled from Archibald and colleagues (Reference Archibald, Zhang, Harper and Cifelli2011) and Wilson (Reference Wilson2013, Reference Wilson2014), with a total of 31 taxa, including 11 multituberculates, 12 metatherians, and 8 eutherians (Supplementary Table 5). Estimated body mass for each species was obtained from Wilson (Reference Wilson2013). For each species, skeletal completeness was calculated using the same method as for dinosaurs (Supplementary Table 5). As the record of Hell Creek mammals is predominantly teeth and jaws, the taphonomic modes were expanded to reflect this, being divided into four ordinal categories: isolated teeth, teeth in isolated jaws, associated skulls, and articulated skulls/skeleton (Supplementary Table 5), representing a coarse disarticulation gradient. Both completeness and taphonomic mode indices relied on published specimen data. These data were used to visually and statistically test the pattern of completeness and taphonomic mode across body size in the mammal assemblage.
Statistical Analyses
All analyses were conducted in R statistical language (v. 4.0.2; R Core Team 2009) following the methods of Brown et al. (Reference Brown, Evans, Campione, O'Brien and Eberth2013b). Body-mass estimates were log transformed (base 10) or ranked depending on the analysis. Completeness metrics were also log transformed (base 10) depending on the analysis. Body mass (log10 kg), completeness (%), and t De (years) all represent ratio data, whereas taphonomic mode (i.e., articulated, associated, isolated) and size class (i.e., small, large) are ordinal data. Correlations were tested using the function cor.test (package: stats), with Pearson, Spearman, or Kendall methods depending on the assumptions of analysis and data type. Correlations between ratio data variables were tested using the Pearson correlation, while those including ordinal data used Spearman or Kendall. While the parametric assumptions of the Pearson correlation are met for the various dinosaur ratio datasets, given the magnitude of the mass range and the distribution of the completeness/timing data (raw not residuals), nonparametric correlations (converting ratio data variables to rank) were also performed (Spearman or Kendall) to test the sensitivity of these results and the allow a more direct comparison with the mammal results. While the dinosaur ratio datasets meet the assumptions of Pearson, the mammal datasets (mass and completeness) are not bivariate normal, and only nonparametric tests are used (Spearman).
Statistical comparisons between size classes were performed using the functions chisq.test (stats) and t.test (stats). Linear models were analyzed using the function lm (stats), whereas the nonlinear models were fit with nls (stats). Model fit was assessed using the function AIC (stats).
The global occurrence of Maastrichtian rock formations was projected onto the present-day global map (Fig. 1) using the function symbols (package: graphics) and the “coastlineWorld” dataset in the package oce (v. 1.2-0) (Kelley et al. Reference Kelley, Richards and Layton2016). Occurrence data were downloaded from the Paleobiology Database (https://paleobiodb.org) on 27 August 2020, using the following parameters: time interval = Maastrichtian-age (72.1–66 Ma), Taxon = Dinosauria.
Results
Hell Creek Formation and Lance Formation Dinosaurs
Correlation between Body Mass and Completeness
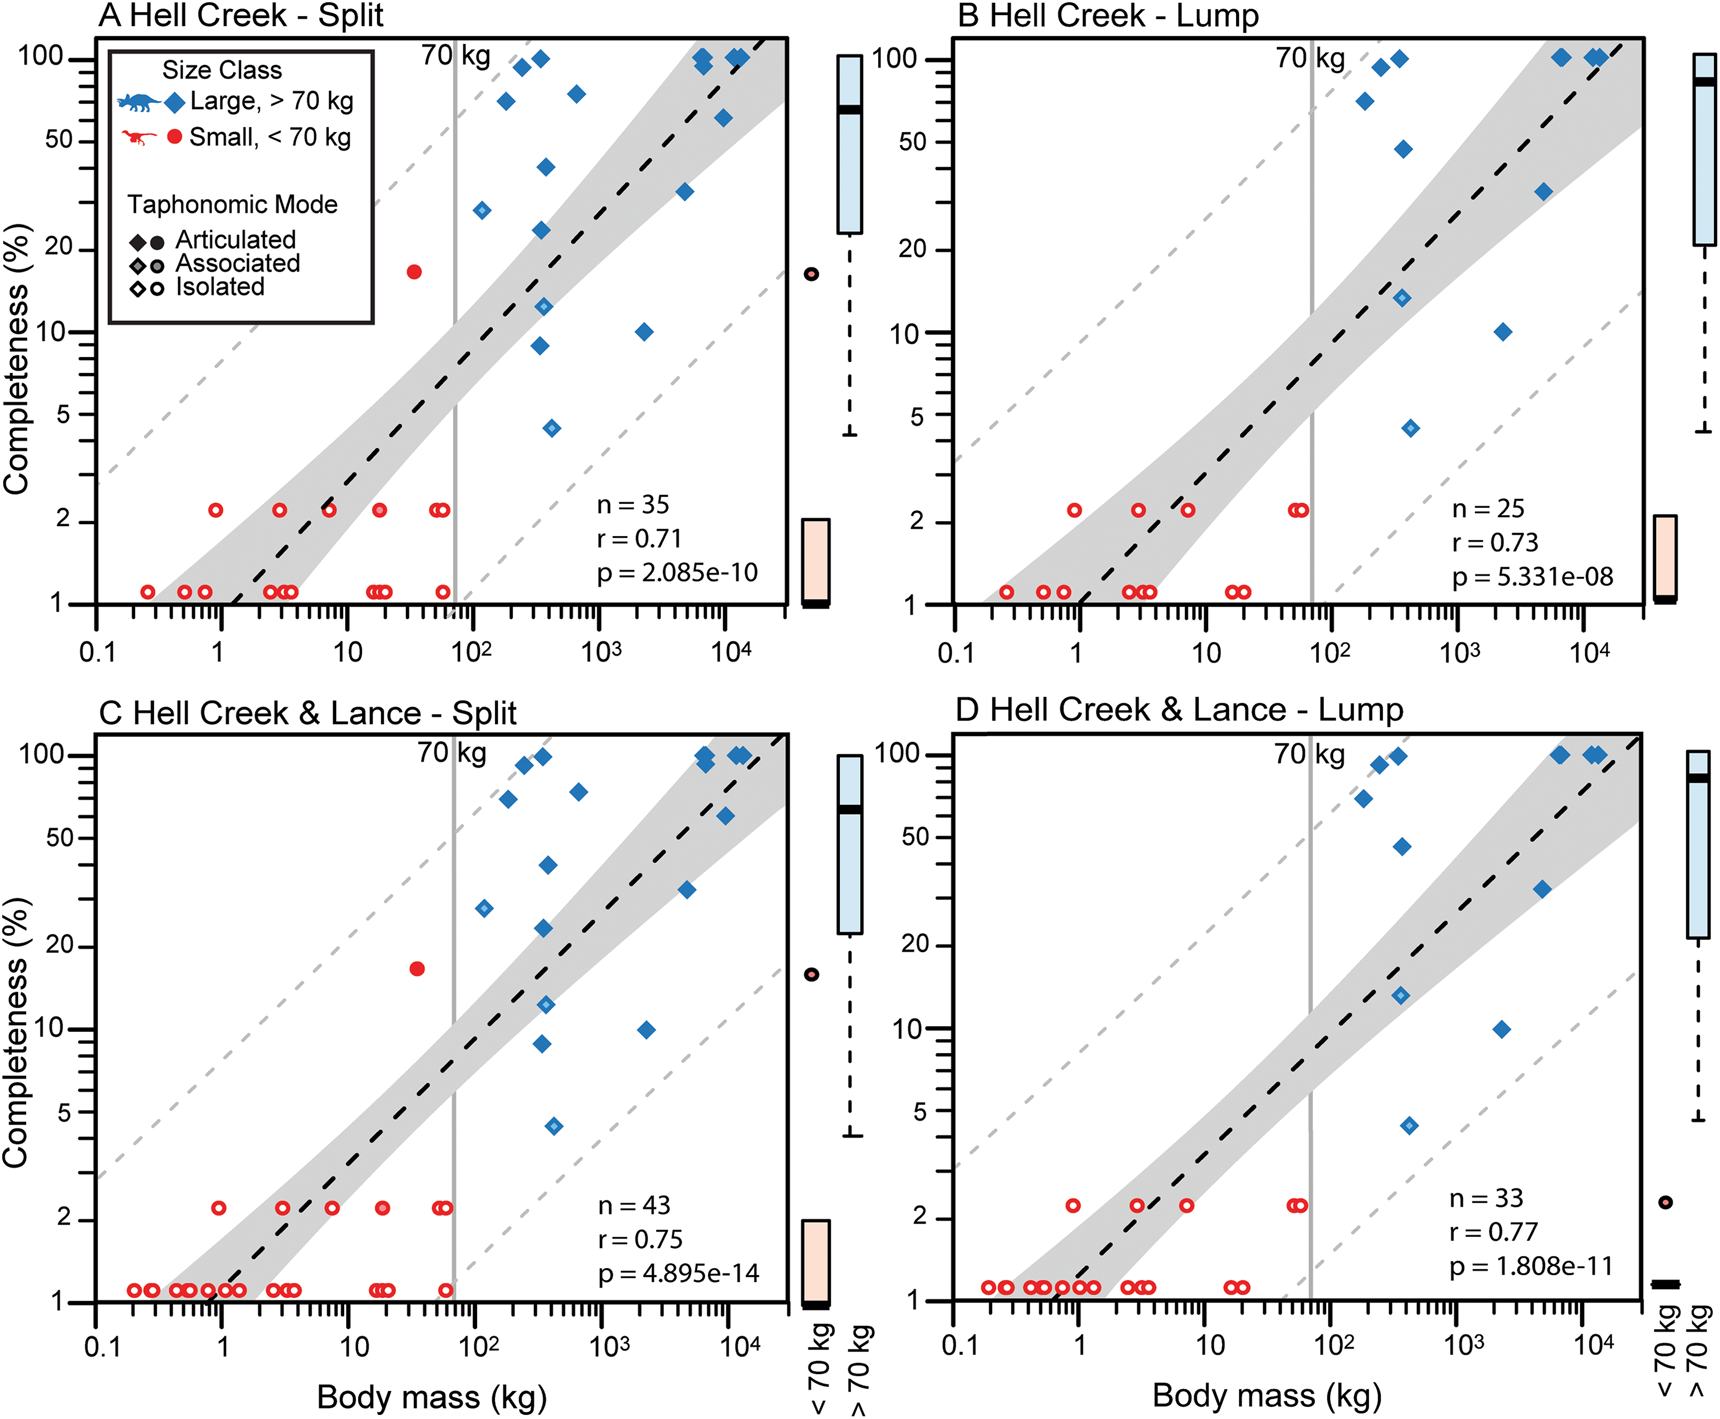
Taxonomic skeletal completeness has a consistent, strong, and significant positive correlation with log body mass (Pearson's product-moment correlation [r] = 0.74–0.76, p << 0.001) (Fig. 2, Table 1). These results are consistent across the Hell Creek and Hell Creek + Lance faunal lists and between the two taxonomic permutations (lumping and splitting). While the parametric assumptions are met, given the magnitude of the body-mass range, the correlation was also tested using ranked body mass (rather than absolute estimated body mass) and ranked completeness, and remains both strong and significant (Kendall's rank correlation [τ] = 0.69–0.72, p << 0.001) (Table 1).
Correlation of completeness as a function of estimated body mass (log10 kg) for all Hell Creek dinosaur taxa. A, Hell Creek: taxonomic split; B, Hell Creek: taxonomic lump; C, combined Hell Creek and Lance: taxonomic split; D, combined Hell Creek and Lance: taxonomic lump. Point shape/color indicates the large (blue diamond) or small (red circle) size classes. Point fill shade indicates taphonomic mode; solid, articulated; partial, associated; hollow, isolated. Dashed lines indicate the best-fit lines, while solid gray and hollow dotted areas indicate 95% confidence and 95% prediction intervals, respectively. Box plots to the right of each plot indicate the distribution of completeness by size class.
Correlations of estimated taxon body mass (log10 and ranked) and taxon completeness for all Hell Creek Formation dinosaur taxa, as well as Ornithischia and Theropoda subsets. Significance at: ** α = 0.01, *** α = 0.001, ns = not significant.

When the dinosaur faunal lists are segregated into Ornithischia and Theropoda, body mass is significantly correlated with completeness for all eight theropod treatments and half (4/8) of the ornithischian treatments (the taxonomic split treatments; Table 1). The taxonomically lumped ornithischian treatments, while still showing relatively strong correlations (r = 0.59, τ = 0.49), were not significant, although this may be a by-product of having the smallest sample sizes and few taxa below the size threshold (Table 1).
When the taxa are ranked in increasing mass and plotted against their completeness index, a clear trend exists: small-bodied taxa (⪝70 kg) are relatively incomplete, and larger taxa (⪞100 kg) are relatively complete (Fig. 3). At a threshold (i.e., 60–100 kg), this pattern is similar to that identified using the sliding mean difference method in the Dinosaur Park Formation (Brown et al. Reference Brown, Evans, Campione, O'Brien and Eberth2013b). Likewise, this division allows the Hell Creek Formation dinosaur assemblage to be divided into two, more isotaphonomic (i.e., more preservational equivalent) size classes: small taxa (<70 kg) and large taxa (>70 kg), for subsequent analyses.
Charts showing completeness and taphonomic mode as a function of estimated ranked body mass for all Hell Creek Dinosaur taxa. A, Hell Creek: taxonomic split; B, Hell Creek: taxonomic lump; C, Hell Creek and Lance: taxonomic split; D, Hell Creek and Lance: taxonomic lump. The colors of the bars follow major taxonomic groupings. Boxes under the completeness graphs indicate taphonomic mode (A, articulated; B, associated; C, isolated). Numbers in B and D correlate to numbered taxa in A and C, respectively. Taxa in gray are excluded from lumped analyses. *Note Acheroraptor (11 and 19) changes rank position based on synonymy.

In all cases, taxa smaller than 70 kg are <17% complete and no more than 2% complete if Dracorex is not considered valid. If Dracorex is considered invalid (e.g., Horner and Goodwin Reference Horner and Goodwin2009; Goodwin and Evans Reference Goodwin and Evans2016), there is no overlap in completeness between the small- and large-size classes. For the taxonomically lumped datasets, the mean and median completeness are 1.5% and 1%, respectively, for taxa <70 kg and 64% and 81%, respectively, for the taxa >70 kg (Fig. 2B,D, Table 2). For the taxonomically split datasets, the mean and median completeness are 2.4% and 1.1% for taxa <70 kg and 58% and 64% for the taxa >70 kg, respectively (Fig. 2 A,C, Table 2). The small-size class is consistently and significantly less complete than the large-size class in all treatments (Table 2).
Completeness and time to discovery (t De) by size class for Hell Creek dinosaur taxa. Sample size and mean and median values for completeness and t De for large- and small-size classes. Values are also reported for t-tests performed contrasting small- and large-size classes for completeness and t De for each treatment.

Correlation between Body Mass and Taphonomic Mode
We recovered strong and significant positive correlations between rank body mass and taphonomic mode for all treatments of the Hell Creek + Lance taxa (ρ = 0.83–0.86, p << 0.001; Table 3). When divided into large- and small-size classes (threshold ≈ 70 kg, based on completeness—see “Correlation between Body Mass and Completeness”), there are also strong associations between size class and taphonomic mode (χ2 = 25.0–36.1, p << 0.001). In all cases, the small-size classes are predominated by taxa represented only from isolated material, whereas the large-size classes are predominated by taxa known from articulated specimens (Fig. 4).
Histograms illustrating the size distribution of Hell Creek dinosaur taxa. In all cases, the top histogram illustrates the size distribution of all Hell Creek dinosaur taxa, whereas the bottom three are segregated based on taphonomic modes: black, articulated (mode A); gray, associated (mode B); white, isolated (mode C). A, Hell Creek: taxonomic split; B, Hell Creek: taxonomic lump; C, Hell Creek and Lance: taxonomic split; D, Hell Creek and Lance: taxonomic lump.

Tests of correlation between estimated body mass and taphonomic mode for Hell Creek Formation dinosaur taxa. Spearman rank correlation was used for ranked body mass, while chi-squared test was used for size class. Significance at: *** α = 0.001.

Correlation of Body Mass and Time to Description (tDe)
There are strong and significant negative correlations between the length of time until a taxon is described (t De) and log body mass (r = −0.63 to −0.79, p << 0.001, Pearson) (Fig. 5, Table 4). In all cases, this correlation is also significant under a nonparametric rank body mass (ρ = −0.47 to −0.75, p << 0.001, Spearman) (Table 4). The larger the species’ body size, the earlier it was identified and described, and conversely, the smaller the species, the more time, on average, before it was described. If the t De between the two size classes (<70 kg and ≥70 kg) is compared, then there is a significant (p < 0.005) bimodality in all cases, with mean t De of large taxa (57–70 years) approximately half that of small taxa (111–123 years); median values are even more divergent (Fig. 5, Table 4).
Correlations between years until description and estimated body mass (log10 kg) for all Hell Creek Dinosaur taxa. A, Hell Creek: taxonomic split; B, Hell Creek: taxonomic lump; C, Hell Creek and Lance: taxonomic split; D, Hell Creek and Lance: taxonomic lump. Point shape/color indicates the large (blue diamond) or small (red circle) size classes. Point fill shade indicates taphonomic mode: solid, articulated; partial, associated; hollow, isolated. Dashed lines indicate the best-fit lines, while solid gray and hollow dotted areas indicate 95% confidence and 95% prediction intervals, respectively. Box plots above indicate the distributions of completeness by size class.

Correlation between time to description (the number of years till the description of a taxon) and its body mass (both log10 and ranked). Significance at: *** α = 0.001.

Discovery Rates and Taxon Body Mass
Differential t De between the large- and small-size classes (Fig. 5, Table 4) suggests that there may be differential rates of discovery (i.e., discovery curves) between these two size classes. In these analyses, both taxonomic splitting/lumping and formation splitting/lumping significantly affect the model fitting of the cumulative description rates, at least for large taxa (Fig. 6, Table 5). In all datasets, the discovery rates of large-bodied taxa are initially high and relatively constant, but the preferred model for the curve varies from a constant linear rate model (Hell Creek, Lump), an exponentially increasing rate model (Hell Creek, Split), and, finally, a power decreasing rate model (Hell Creek/Lance, Lump and Split) (Table 5, Fig. 6). In half the cases, we cannot reject at least one of the suboptimal models, based on a ΔAIC < 2 and equivalently elevated Akaike weights relative to the optimal model (identified with an asterisk in Table 5). These model ambiguities are almost exclusive to the large-size class taxa, for which we generally cannot reject a broadly constant rate of discovery (i.e., linear model). By contrast, the discovery rates of small-size class taxa show a sharp increase through time (Fig. 6); in all cases, rates are best described by exponential models regardless of taxonomic lumping/splitting or formation (Table 5).
Discovery rates for Hell Creek dinosaur taxa, showing the number of known taxa through time. A, Hell Creek: taxonomic split; B, Hell Creek: taxonomic lump; C, Hell Creek and Lance: taxonomic split; D, Hell Creek and Lance: taxonomic lump. Point shape/color indicates large (blue diamond) or small (red circle) size classes. Dashed lines indicate the best-fitting model, while solid areas indicate 95% confidence intervals about the model. The dotted line indicates deviation between corresponding lump/split pairs.

Model-fitting results for discovery rates of large- and small-size classes in the Hell Creek Formation. The best-fitting model is indicated by an asterisk (*) and models with a delta AIC < 2 are shown in bold. AIC = Akaike information criterion; AW = Akaike weight.

Change in Dinosaur Body-Size Distribution through Collection History
We recover a strong shift in our knowledge of dinosaur body-size distributions as a function of collection history over the last 100 years (Fig. 7). In the Hell Creek and Lance Formations (Fig. 7A), dinosaur discoveries before the 1970s were almost exclusively of larger-bodied taxa, with a few notable exceptions (e.g., Cimolopteryx rara: 0.5 kg, described in 1892 [Marsh Reference Marsh1892]). In the Dinosaur Park Formation, dinosaurs between 10 and 1000 kg were rare before 1920 and became increasingly better sampled toward the present day, but taxa <10 kg were unknown until the last three decades (Fig. 7B). Changes in these distributions are supported by significant trends in the size distribution skewness (Fig. 7C). Necessarily, initial years have much lower diversity, which is problematic for qualifying the skewness, but as sampling improved from the 1920s onward, both rock units reveal a relatively steady increase in skewness, from strong negative skews to more symmetric distributions. This increase in skewness indicates that both formational units became less dominated by large taxa, as improved sampling progressively (or exponentially; Fig. 6) filled in the diversity of small-bodied taxa. Regardless of whether the initial decades are dropped, body-mass skewness is strongly and significantly positively correlated with research year in both the Hell Creek/Lance (r = 0.92, p = 0.00002) and Dinosaur Park (r = 0.78, p = 0.0041) Formations.
Histograms illustrating the size distribution of dinosaur taxa in Hell Creek and Lance Formations (A), and Dinosaur Park Formation (B) through historical collection history. C, Plot of skewness (k) of dinosaur size distribution in each decade, showing general reduction in negative skew through time.

Correlation of Family-Level Body Mass and Relative Abundance
There are strong positive correlations (r = 0.40–0.90) between average family-level body mass and relative abundance (percentage of the dinosaur fauna accounted for by that family) in five of the seven datasets from the previous Hell Creek dinosaur faunal surveys (Lehman Reference Lehman1987; White et al. Reference White, Fastovsky and Sheehan1998; Russell and Manabe Reference Russell and Manabe2002; Horner et al. Reference Horner, Goodwin and Myhrvold2011; Lyson and Longrich Reference Lyson and Longrich2011; Stein Reference Stein2019) (Fig. 8, Supplementary Table 6). Data on the abundance of articulated/associated skeletons from the Stein (Reference Stein2019) data show the strongest correlation (ρ = 0.90, p = 0.002), while data encompassing large counts of isolated elements (including teeth) have the lowest (ρ = 0.40, p = 0.22), revealing the difference in perceived relative abundance due to taphonomic mode. The lack of significance when using the Russell and Manabe (Reference Russell and Manabe2002) data is likely due to both Ankylosauridae and Nodosauridae having very low relative abundances despite their large body size. These correlations (especially when looking at associated/articulated specimens) are consistent regardless of sample size or survey year, suggesting that the pattern is not strongly related to sampling intensity.
Correlations of average body mass for each family and the relative familial abundance of six Hell Creek dinosaur faunal surveys (Lehman Reference Lehman1987; White et al. Reference White, Fastovsky and Sheehan1998; Russell and Manabe Reference Russell and Manabe2002; Horner et al. Reference Horner, Goodwin and Myhrvold2011; Lyson and Longrich Reference Lyson and Longrich2011; Stein Reference Stein2019). Lines indicate best fit of linear regression of relative abundance as a factor of body mass. Values are reported in Supplementary Table 6.

Ontogimorph (Semaphorant) Abundances as a Factor of Body Mass
Histograms showing the frequency of specimens in each size class illustrate a consistent pattern across all three taxa (Triceratops, Tyrannosaurus, and Edmontosaurus) and all measurements (Fig. 9A–D). In all cases, the majority of specimens form a relatively normal distribution around the average adult size, with very few subadults and even fewer juvenile specimens preserved. The Tyrannosaurus femur circumference measurements also allow estimation of body mass through the ontogenetic sample, with 90% of articulated/associated specimens in the 1000–10,000 kg size bin, 10% in the 100–1000 kg size bin, and no specimens in the <100 kg size bin.
Within-taxon specimen abundances based on A, Tyrannosaurus femur circumferences; B, Tyrannosaurus dentary tooth row length; C, Edmontosaurus quadrate height; and D, Triceratops basal skull length. E, Relative abundances of specimens within four size classes in the four most common genera in the Hell Creek Formation, based on the census of Horner et al. (Reference Horner, Goodwin and Myhrvold2011).

The survey data of Horner et al. (Reference Horner, Goodwin and Myhrvold2011) show consistent patterns of relative abundance of the four different size/age classes within each of the four most abundant Hell Creek taxa (Triceratops, Tyrannosaurus, Edmontosaurus, and Thescelosaurus). In all cases, the most common size class is the large/adult, with fewer medium/subadult specimens and even fewer small/juvenile specimens (Fig. 9E). Extra-large/large adult specimens are also relatively rare in all taxa (Fig. 9E).
Hell Creek Formation and Lance Formation Mammals
Contrasting the pattern for dinosaurs, the correlation between mass (rank mass) and skeletal completeness within the mammal dataset is much weaker (Spearman ρ = 0.08) and nonsignificant (p = 0.66), though still positive (Fig. 10A,B). Despite this nonsignificant result, two of the three largest taxa (Meniscoessus robustus and Didelphodon vorax) are known from dramatically more complete specimens than the rest of the sample (Fig. 10B).
Hell Creek mammal assemblage showing absolute body mass (A), taxon-based skeletal completeness (B), and taphonomic mode (C) all ordered by ranked body mass. In A and B: white, Multituberculata; gray, Metatheria; black, Eutheria. In C, black to lightest gray indicates a disarticulation gradient from articulated skull (black), to associated skull (dark gray), to teeth within jaws (medium gray), to isolated teeth (light gray).

Similar to the results for mass, the correlation between mass (rank mass) and taphonomic mode within the mammal dataset is much weaker (Spearman ρ = 0.08) than that for dinosaurs, and nonsignificant (p = 0.66), but shows a similar positive trend (Fig. 10C). Again, it is worth noting that only two of the mammalian taxa are known from articulated or associated skulls, and these are two of the three largest taxa in the assemblage (Meniscoessus robustus and Didelphodon vorax; Fig. 10C).
Discussion
Presence of Taphonomic Size Bias in the Dinosaur Assemblage
The strong and highly significant correlations of dinosaur taxon body mass with skeletal completeness, taphonomic mode of preservation, and time to description (t De) indicate that small body size is a proxy for low completeness and disarticulation and a predictor of discovery rate at the taxon level. Importantly, the three parameters (completeness, taphonomic mode, and t De) are independent metrics, with no fundamental basis to expect a relationship. For instance, one can have a very complete yet associated specimen or, likewise, a very incomplete yet articulated specimen. Also independent from these relationships is the positive correlation between body mass and relative abundance at the family level as well as the low abundance of small (juvenile) specimens of larger taxa. We are unaware of any single ecological mechanism that can explain our recovered patterns. Accordingly, multiple separate ecological mechanisms, such as juvenile allopatry, ontogenetic competition, ontogenetic niche shifts, and true rarity of small taxa, would need to be invoked to explain these individual correlations. By contrast, a single strong taphonomic, preservational bias (likely combined with collection biases) toward large taxa can explain all of our empirical observations.
Support for this interpretation can be found in actualistic taphonomic studies. In terrestrial ecosystems, large bones and skeletons are more resistant to processes such as biological destruction (e.g., carnivory and scavenging) as well as physical and chemical weathering, whereas small skeletons and bones are more susceptible to these processes and therefore more likely to be destroyed before fossilization (Behrensmeyer et al. Reference Behrensmeyer, Western and Dechant Boaz1979; Behrensmeyer and Dechant Boaz Reference Behrensmeyer, Dechant Boaz, Behrensmeyer and Dechant Boaz1980; Lyman Reference Lyman1984; Kidwell and Flessa Reference Kidwell and Flessa1996; Arribas and Palmqvist Reference Arribas and Palmqvist1998; Brand et al. Reference Brand, Hussey and Taylor2003a). A bias toward preserving large bones alone can decrease the completeness and abundance of small skeletons, independent of whether the individual pertains to a small-bodied species or a juvenile of a larger taxon. This decrease in abundance and completeness will reduce representation in the taphocoenosis, resulting in the eventual loss of faunal compositional fidelity (presence/absence) through the apparent absence of small taxa. Indeed, such size-dependent losses in compositional fidelity were demonstrated through live–dead experiments on extant ecosystems (Behrensmeyer et al. Reference Behrensmeyer, Western and Dechant Boaz1979). The presence of a strong taphonomic bias against the skeletal completeness, articulation, time to initial description, and abundance of small dinosaurs in the Hell Creek Formation assemblage suggests that there may also be a bias against the discovery of other small taxa, unequally reducing the compositional fidelity of the small-bodied portion of the entire fauna.
The suggestion of a strong taphonomic bias to explain our various observations does not exclude the possibility that Mesozoic dinosaurs had unique intrinsic physiologies and/or ecologies that may have influenced these patterns, as taphonomic and biological explanations are not mutually exclusive. However, we suggest that biological explanations (Codron et al. Reference Codron, Carbone, Müller and Clauss2012; O'Gorman and Hone Reference O'Gorman and Hone2013; Schroeder et al. Reference Schroeder, Lyons and Smith2021), especially those that invoke “non-analogue” systems (sensu Williams and Jackson Reference Williams and Jackson2007), at least in the context of extant terrestrial vertebrates, should not be invoked to explain patterns that can all be effectively explained by a single taphonomic size bias. Additionally, the low abundance and completeness of ontogimorphs of the taxa with the largest body masses (i.e., megaherbivores and “megatheropods”) demonstrate that a preservational size bias reduces the ability to accurately assess the role of ontogenetic niche shifts in the diversity of small-bodied taxa (Codron et al. Reference Codron, Carbone, Müller and Clauss2012; Schroeder et al. Reference Schroeder, Lyons and Smith2021). It should also be noted that nonrandom research and collection practices can further compound those associated with differential preservation due to size, as demonstrated by the evident shift in size distributions over research history (Fig. 7).
The results presented here for the Hell Creek Formation (and Hell Creek/Lance subset), particularly with regard to associations with completeness and taphonomic mode (i.e., level of articulation), echo those previously recovered for the Campanian-aged Dinosaur Park Formation (Brown et al. Reference Brown, Evans, Campione, O'Brien and Eberth2013b). For instance, the size threshold below which completeness and articulation are compromised are nearly identical: ~60 kg (60–370 kg) for the Dinosaur Park Formation and 62–100 kg for the Hell Creek Formation. Importantly, these size-dependent taphonomic patterns are equivalent despite notable differences in the depositional environments, differences in geographic and geological contexts, different taxa, variable body-mass ranges, and differential collection histories between the two formations. Our results are consistent with some of those obtained by Stein (Reference Stein2019) as part of a broadscale faunal survey of the Hell Creek Formation. Stein (Reference Stein2019) effectively shows a drop in the abundance of articulated and associated skeletons below 200 kg, compared with a discordantly higher abundance of isolated specimens under this threshold. Furthermore, the aforementioned ~60–100 kg taphonomic threshold is similar to the 100 kg point of divergence between faunal representations in the bio- and taphocoenoses of modern ecosystems (Behrensmeyer et al. Reference Behrensmeyer, Western and Dechant Boaz1979) and the 10–100 kg taphonomic peak observed in fossil mammals from the last 10 Myr (Benson Reference Benson2018). Although these thresholds are not fixed, and there is a substantial range in absolute terms, their overall relative similarity suggests protracted taphonomic influences on taxa above and below 10–100 kg that transcend taxonomy and diagenesis. There are, however, notable examples where small-bodied taxa were not taphonomically biased, such as the Lagerstätte assemblage of the Early Cretaceous Jehol Biota (Zhou Reference Zhou2014). There, dinosaur body masses show a more typical positively skewed distribution (Benson et al. Reference Benson, Hunt, Carrano and Campione2018). It is worth underscoring that local preservational factors and overall fossil abundance likely also dictate the rate at which decent skeletons of small taxa are likely to be found. Even in systems like Dinosaur Park and Hell Creek, exceptional skeletons of small-bodied species can be found, such as the recently described complete skeleton of Saurornitholestes from the former unit (Currie and Evans Reference Currie and Evans2020) and, most importantly in the context of this work, the almost complete and articulated hatchling skeleton of Edmontosaurus annectens from the Hell Creek (Wosik et al. Reference Wosik, Goodwin and Evans2017). These preservational rarities will on average take much effort and time to find but are invaluable to our understanding of latest Cretaceous dinosaur life history, diversity, and paleoecology.
Magnitude of the Taphonomic Size Bias
A taphonomic size bias against the preservation of small skeletons parsimoniously explains all correlations of size with the various independent taphonomic indices. The question of how strong this bias is can be addressed to a certain degree by looking at the correlation coefficients. Average correlation coefficients of mass with completeness (mean r = 0.75), taphonomic mode (mean r = 0.84), time to description (r = –0.70), and relative abundance (r = 0.74) are all large and suggest that, on average, 56%, 71%, 49%, and 54% of their respective variance can be explained (r 2) by estimated body mass of the relevant taxon alone. As such, the taphonomic implication of differential preservation due to body mass is likely the largest single factor shaping most aspects, including the diversity of the Hell Creek dinosaur assemblage.
The correlation coefficients for the Hell Creek Formation are very similar to those obtained from the Campanian-aged Dinosaur Park Formation for the same parameters (Brown et al. Reference Brown, Evans, Campione, O'Brien and Eberth2013b): completeness (r HC = 0.75 vs. r DPF = 0.81), taphonomic mode (r HC = 0.84 vs. r DPF = 0.82), time to description (r HC = −0.70 vs. r DPF = −0.62). This similarity is despite these two formations having different constituent taxa (i.e., the faunas are similar at the family level, but only teeth taxa overlap at the genus level, and notable size differences occur within many families) and disparate collection histories (i.e., the bulk of the diversity resulted from fieldwork conducted by different institutions and at different times). Together, these results suggest comparable preservational biases against small taxa in these two dinosaur-dominated assemblages.
Accommodating large changes in taxonomic splitting and lumping and the boundaries between the formations of interest effectively acts as a sensitivity analysis for our main results. Here, again, we find significant size-dependent taphonomic patterns, suggesting our results are unlikely to change under different sampling or taxonomic philosophies and further supporting the strength of the taphonomic size bias in the Hell Creek Formation. The low impact of taxonomic lumping and splitting is not solely due to the small portion of debated taxa in the total fauna, as both low completeness and longer t De are seen within the ontogimorphs as well. When multiple ontogenetic stages of a taxon (either junior synonym or ontogimorphs) are preserved, the larger-sized stages are consistently more complete. For example, Pachycephalosaurus (Dracorex = 17%, Stygimoloch = 28%, and Pachycephalosaurus = 40%), Tyrannosaurus (Nanotyrannus = 74% and Tyrannosaurus = 100%), and Acheroraptor (Acheroraptor = 2% and Dakotaraptor ≈ 12%). Similarly, except for Acheroraptor/Dakotaraptor, the large, adult form is generally described first, with the smaller, less mature forms described later (e.g., Pachycephalosaurus: 1943; Stygimoloch: 1982; Dracorex: 2006; and Tyrannosaurus: 1905; Nanotyrannus: 1946).
Rates of Description
Historic cumulative description rates of large-bodied dinosaur taxa are characterized by high initial rates, with a decelerating rate, but still increasing count, toward the present time (Fig. 6). By contrast, small-bodied taxa were initially described at a slow rate, but the rates have increased dramatically toward the present (Fig. 6). If these general patterns continue to hold into the future, we would expect to find a reduction in the rate of discovery of new large-bodied taxa from the Hell Creek Formation but a rapid increase in the rate for small-bodied taxa. These rarefaction-like species discovery curves suggest that the known large-bodied portion of the Hell Creek dinosaur fauna is likely approaching a level at which it is representative of the true biological fauna, approximating the biocoenosis. Conversely, the small-bodied portion of the assemblage is likely missing significant diversity that will continue to be discovered in the future, but until such time it should not be assumed that the Hell Creek Formation fossil assemblage represents a relatively complete and/or unbiased picture of the biological fauna of the time. This pattern of constant or slightly slowing discovery rates for large-bodied taxa in the Hell Creek Formation is in stark contrast to the asymptotic pattern recovered in a similar treatment of the Dinosaur Park Formation assemblage (Brown et al. Reference Brown, Evans, Campione, O'Brien and Eberth2013b). Therefore, the Dinosaur Park assemblage may be “further along” (i.e., more mature) in terms of its taxon sampling, suggesting a better understanding of its ancient ecosystem than that of the Hell Creek Formation. These results are congruent with those of Chiarenza and colleagues (Reference Chiarenza, Mannion, Lunt, Farnsworth, Jones, Kelland and Allison2019) based on the interplay between habitat suitability and taphonomic suitability between the Campanian (largely driven by the Dinosaur Park Formation) and Maastrichtian (largely driven by the Hell Creek Formation).
The differential description rates in the Dinosaur Park and Hell Creek formations are commensurate with the changing skewness of the body-size distributions through time in both formations, which progress from negatively skewed assemblages to positive skews that are more characteristic of most modern ecosystems (Fig. 7). However, it is worth noting that, in recent years, the Dinosaur Park Formation produced several new large-bodied taxa, specifically ceratopsians, all of which are represented by single, and in most cases very fragmentary, specimens (Longrich Reference Longrich2014; Ryan et al. Reference Ryan, Evans, Currie and Loewen2014); this accounts for the recent more negative skew observed in the formation (Fig. 7C).
Implications for Dinosaur Paleoecology
It is well recognized that the fossil record of dinosaurs, and all extinct forms, is woefully incomplete (Wang and Dodson Reference Wang and Dodson2006; Barrett et al. Reference Barrett, McGowan and Page2009; Cashmore and Butler Reference Cashmore and Butler2019), and our current knowledge of dinosaurs will likely change because of future discoveries (Tennant et al. Reference Tennant, Chiarenza and Baron2018). Previous studies have explored the role of differential sampling in shaping dinosaur diversity and predicted that upward of 2000 dinosaur species may have been present during the Mesozoic (Wang and Dodson Reference Wang and Dodson2006; Starrfelt and Liow Reference Starrfelt and Liow2016). In addition to known sampling factors, the results presented here and elsewhere (Brown et al. Reference Brown, Campione, Giacomini, O'Brien, Vavrek and Evans2013a,Reference Brown, Evans, Campione, O'Brien and Eberthb; Evans et al. Reference Evans, Schott, Larson, Brown and Ryan2013; Benson et al. Reference Benson, Hunt, Carrano and Campione2018) implicate body size as a major yet poorly considered factor driving the preservational potential of dinosaurs. Furthermore, our results suggest that in well-sampled Late Cretaceous North American assemblages, most of the missing diversity of dinosaurs will pertain to small-bodied forms.
The biased dearth of small-bodied dinosaur diversity in the Hell Creek Formation, as indicated by both the correlation of mass and taphonomic indicators and the differential rates of description of large and small taxa, will have significant ramifications for our understanding of the dinosaur paleoecology in the ecosystems represented by the Hell Creek assemblages. Notably, both the abundance and the diversity of small taxa would have been far greater than suggested by the fossil assemblage alone. This underrepresentation is highlighted by (1) the occurrence of a highly diverse avian fauna during the Maastrichtian, only recognized in the last decade (Longrich et al. Reference Longrich, Tokaryk and Field2011); (2) the fact that the preservation of small-bodied taxa depends on the taphonomic resilience of their bones (such as the frontoparietal domes of pachycephalosaurs; Brown et al. Reference Brown, Russell, Evans and Ryan2013c; Evans et al. Reference Evans, Schott, Larson, Brown and Ryan2013); and (3) the exponential accrual of small taxa in the last three decades (Fig. 6). Due to both the low completeness of known small taxa and the number of currently unrecognized taxa that likely existed (e.g., Starrfelt and Liow Reference Starrfelt and Liow2016; Close et al. Reference Close, Evers, Alroy and Butler2018), the number of ecological niches both available to and occupied by small dinosaurs is, by extension, greatly underappreciated by current assemblage data. Such underrepresentation of diversity within the Hell Creek Formation will have a disproportionately high effect on the inferred complexity and possible interactions within this past ecosystem, as the number of possible ecological interactions scales geometrically to alpha diversity (Valiente-Banuet et al. Reference Valiente-Banuet, Aizen, Alcántara, Arroyo, Cocucci, Galetti, García, García, Gómez and Jordano2015), with similar implications for reconstructing food web models and ecosystem resilience to secondary extinction cascades (Mitchell et al. Reference Mitchell, Roopnarine and Angielczyk2012). As a result, before interpreting the paleoecology for the latest Maastrichtian, we emphasize the need for a more concerted effort to identify the size-dependent taphonomic factors presented in this study, the outcome of which may allow for the interpretation of the cryptic diversity of small dinosaurs, which is likely underestimated. How generally applicable these results are to the global Mesozoic dinosaur record remains to be tested.
Size-related Taphonomy in Mammals and Other Vertebrate Groups
The patterns observed for dinosaurs may also present, though likely reduced in magnitude, in other taxonomic groups, and our framework provides a new understanding of preservation patterns in the Hell Creek and its equivalents and allows us to make predictions about their fossil record and preserved diversity.
The estimated body masses of Hell Creek Formation mammals range from 4.72 g (Batodon tenuis) to 5.2 kg (Didelphodon vorax) (Wilson et al. Reference Wilson, Ekdale, Hoganson, Calede and Vander Linden2016). While this range is much less than that of contemporary dinosaurs (~0.192–13,000 kg; more than five orders of magnitude), it still exceeds three orders of magnitude. Despite this broad size range, even the most massive Hell Creek mammals were well below the ~70 kg taphonomic size threshold seen in the dinosaur assemblage; indeed, the only overlap of mass ranges between the two groups is due to birds. It is unclear from the mass ranges alone if the strong and prevalent size-related taphonomic bias in the dinosaur assemblage should also describe the contemporaneous mammal assemblage.
The results presented here suggest that, while greatly reduced in strength, a similar but nonsignificant positive association between body mass and completeness and taphonomic mode in Maastrichtian fossil mammals (Fig. 10) is recorded. Two of the three most massive mammal taxa, the multituberculate Meniscoessus robustus and the stagodontid metatherian Didelphodon vorax, are the only specimens known from associated or articulated skulls and are also the most complete (Fig. 10; Supplementary Table 5). The latter of these is by far the largest taxon, and it is represented by at least one complete skull, several partial crania, isolated postcranial elements, and an unpublished associated skeleton (Bryant Reference Bryant1989; Wilson et al. Reference Wilson, Ekdale, Hoganson, Calede and Vander Linden2016). The lower magnitude and lack of significance of the effect in the mammal assemblage relative to the dinosaur assemblage is likely due, in part, to the more restricted body-mass range of mammals (and their lower absolute sizes), as well as the limited range of completeness scores, which both act to reduce the ranges over which correlations can be calculated, and the use of rank as opposed to values (particularly for mass). It is also important to point out that the Cretaceous mammal fossil record is dominated by taphonomically resistant but highly diagnostic teeth, a departure from the fossil record of most dinosaurs. As a result, while a size-related taphonomic bias may be present in these mammals, its impact on the alpha taxonomy, richness patterns, and our ultimate understanding of mammalian evolution and extinction is more limited than for dinosaurs. While any taphonomic bias may not strongly limit our understanding of taxonomic diversity, our understanding of morphological and ecological diversity and phylogenetic relationships is likely to be heavily impacted. This also highlights that even if size-related taphonomic biases act at similar magnitude for disparate clades (which they are unlikely to), they are likely to have disparate effects on these clades based on novel anatomical, ecological, or behavioral factors.
Based on our results for dinosaurs, and to a lesser extent mammals, we hypothesize that these size biases are also present in the fossil record of other terrestrial groups, such as lizards. A survey of the literature reveals that there are no lizards known from articulated or associated material in the Hell Creek or equivalent formations (Estes et al. Reference Estes, Berberian and Meszoely1969; Estes and Berberian Reference Estes and Berberian1970; Longrich et al. Reference Longrich, Bhullar and Gauthier2012), supporting the presence of a strong size bias across all terrestrial vertebrate taxa in these depositional systems. Furthermore, we predict that when associated specimens of these taxa are found, they will most likely be from the largest taxa. Such a prediction appears to hold for lizards, as Palaeosaniwa canadensis, the largest lizard in the Hell Creek (~6 kg) and the largest terrestrial lizard from the Cretaceous (Longrich et al. Reference Longrich, Bhullar and Gauthier2012), is also the only taxon known from an associated skeleton (i.e., skull, vertebrae, limbs), although this specimen remains undescribed (Bryant Reference Bryant1989). The strong size bias against small skeletons in other groups of terrestrial vertebrates, such as lizards, fundamentally limits our abilities to understand their diversity and ecology, along with their roles in contemporary ecosystems.
Interestingly, crocodilians, champsosaurs, and especially turtles may be less affected by body-size biases, as most taxa are known from largely complete associated specimens (Gilmore Reference Gilmore1910, Reference Gilmore1911; Hutchison and Archibald Reference Hutchison and Archibald1986; Holroyd and Hutchison Reference Holroyd and Hutchison2002; Holroyd et al. Reference Holroyd, Wilson and Hutchison2014). We suggest that their preservation as associated or articulated specimens is related to their aquatic, freshwater ecology, directly associated with the sediment-carrying medium (Noto Reference Noto, Allison and Bottjer2011). Increased preservation potential in turtles is likely also due to the carapace and plastron in turtles (Brand et al. Reference Brand, Hussey and Taylor2003b). Disarticulation experiments also suggest an environmental role in this body-size taphonomy, with larger specimens taking significantly longer to disarticulate in terrestrial environments, but this size effect being negligible in aqueous settings (Brand et al. Reference Brand, Hussey and Taylor2003a). Taken together, these studies highlight that while body size is a major factor in taphonomy, it is not the only factor, and other factors such as the ecology and anatomy of specific groups can exacerbate (e.g., birds) (Turvey and Blackburn Reference Turvey and Blackburn2011; Mitchell Reference Mitchell2015) or counteract (e.g., turtles) (Brand et al. Reference Brand, Hussey and Taylor2003b) the body-size patterns. This interplay between size-specific and size-independent preservational factors is an important area of future research.
Implications for End-Cretaceous Mass Extinction
As the Hell Creek Formation is one of the few well-sampled examples of a late Maastrichtian assemblage globally, our understanding of its diversity and paleoecology is paramount to our interpretations of mass extinction dynamics at the end of the Cretaceous (e.g., Sheehan and Fastovsky Reference Sheehan and Fastovsky1992; Fastovsky and Sheehan Reference Fastovsky and Sheehan2005; Wilson et al. Reference Wilson, Clemens, Horner and Hartman2014a; Fastovsky and Bercovici Reference Fastovsky and Bercovici2016; DePalma et al. Reference DePalma, Smit, Burnham, Kuiper, Manning, Oleinik, Larson, Maurrasse, Vellekoop, Richards, Gurche and Alvarez2019). Many authors have discussed the possibility that the end-Cretaceous dinosaur mass extinction was size dependent (Bakker Reference Bakker1977; Russell Reference Russell1977; Buffetaut Reference Buffetaut1990; Benson et al. Reference Benson, Campione, Carrano, Mannion, Sullivan, Upchurch and Evans2014), with a disproportionate effect on larger taxa. If, however, our understanding of the dinosaur size distribution within this formation is taphonomically biased against small taxa, as we revealed here, then a size-independent extinction of all non-avian dinosaurs will appear to be size selective against large-bodied taxa. Concomitantly, if small-bodied taxa were more diverse than currently understood, as would be the case under our taphonomy-biased framework, then their extinction may have been just as severe as for the large taxa but would have gone undetected. The discovery that many contemporaneous small-bodied taxa, such as avians, lizards, and mammals, underwent similarly dramatic losses in diversity across the K/Pg boundary suggests that the mass extinction may not have been as size selective as previously thought (Wilson Reference Wilson2005, Reference Wilson2013, Reference Wilson2014; Longrich et al. Reference Longrich, Tokaryk and Field2011, Reference Longrich, Bhullar and Gauthier2012, Reference Longrich, Scriberas and Wills2016; Wilson et al. Reference Wilson, DeMar and Carter2014b; Halliday et al. Reference Halliday, Upchurch and Goswami2016) and supports the hypothesis that taphonomic filters have clouded our ability to grasp the true magnitude and specificity of this event.
The strongest extinction selectivity has been proposed for body sizes >25 kg for the terrestrial and freshwater realms (Bakker Reference Bakker1977; Russell Reference Russell1977; Sheehan and Fastovsky Reference Sheehan and Fastovsky1992; Buffetaut Reference Buffetaut, Cockell, Koeberl and Gilmour2006). Virtually no species above this body-mass threshold survived the K/Pg extinction event. Survivorship below this threshold was variable but could be high in certain groups, such as turtles, crocodylomorphs, and choristoderes (Holroyd et al. Reference Holroyd, Wilson and Hutchison2014; Chiarenza et al. Reference Chiarenza, Farnsworth, Mannion, Lunt, Valdes, Morgan and Allison2020). This higher survivorship may be linked to higher thermal inertia of fluvio-lacustrine systems or fossorial/burrowing behavior (Longrich et al. Reference Longrich, Bhullar and Gauthier2012; Lyson et al. Reference Lyson, Miller, Bercovici, Weissenburger, Fuentes, Clyde, Hagadorn, Butrim, Johnson and Fleming2019; Chiarenza et al. Reference Chiarenza, Farnsworth, Mannion, Lunt, Valdes, Morgan and Allison2020). Even for clades entirely below this size threshold (e.g., mammals, squamates), body size remains a major filter for survivorship through this interval, disproportionately impacting larger taxa (Longrich et al. Reference Longrich, Bhullar and Gauthier2012; Wilson Reference Wilson2013, Reference Wilson2014). Further, the Hell Creek mammals also show a pattern consistent with an adaptive decrease in mean body size related to increasing temperatures in the latest Maastrichtian (Wilson Reference Wilson2005, Reference Wilson2014). The differential extinction selectivity, both between and within major clades, related to factors such as body size and various ecological niches and behaviors remains an intriguing question.
Our Hell Creek dataset suggests that our knowledge of dinosaur diversity below this body-size threshold is particularly poor, especially when compared with Lagerstätte, such as the Jehol Biota, that preserve a notably large diversity of feathered dinosaur and birds that were likely below 25 kg in body mass (Benson et al. Reference Benson, Hunt, Carrano and Campione2018). The preservational biases against small-bodied taxa quantified here add to a growing list of paleobiological biases effecting species richness/abundance patterns, including this important latest Cretaceous interval. These include investigations into the role of outcrop area, sea level, and sampling (Butler et al. Reference Butler, Benson, Carrano, Mannion and Upchurch2011; Lloyd Reference Lloyd2011; Smith and McGowan Reference Smith and McGowan2011; Upchurch et al. Reference Upchurch, Mannion, Benson, Butler and Carrano2011; Cleary et al. Reference Cleary, Benson, Evans and Barrett2018); the interplay between ecological habitat suitability and taphonomic/depositional suitability (Chiarenza et al. Reference Chiarenza, Mannion, Lunt, Farnsworth, Jones, Kelland and Allison2019); and historical collection biases (Goodwin and Horner Reference Goodwin, Horner, Ryan, Chinnery-Algeier and Eberth2010). Until the true faunal assemblage and size distribution of the Hell Creek can be adequately determined or modeled, discussions regarding the end-Cretaceous mass extinction, particularly those involving body size or size selectivity, must consider the potential effects of unequal size-dependent taphonomic, preservation, and collection biases as alternate explanations of putative extinction dynamics.
Acknowledgments
We thank V. Arbour, R. Benson, M. Burns, P. Currie, D. DeMar, D. Eberth, P. Dodson, D. Fowler, D. Larson, N. Longrich, L. O'Brien, K. Padian, M. Ryan, J. Scannella, D. Tanke, and M. Vavrek for discussions and contributions to this project. Funding for this project was provided by a National Sciences and Engineering Research Council (NSERC)–Alexander Graham Bell Canada Scholarship and Dinosaur Research Institute Student Project Grant (to C.M.B.), a Queen Elizabeth II Graduate Scholarship in Science and Technology and an Australian Research Council Discovery Early Career Research Award (to N.E.C.; DE190101423), and a National Sciences and Engineering Research Council Discovery Grant (to D.C.E.; NSERC RGPIN-2018-06788). Taxon silhouettes used in figures were obtained from Phylopic.org under Creative Commons Attribution 3.0 Unported (https://creativecommons.org/licenses/by/3.0), Creative Commons Attribution-NonCommercial 3.0 Unported (http://creativecommons.org/licenses/by-nc/3.0), and Creative Commons Attribution-NonCommercial-ShareAlike 3.0 Unported (https://creativecommons.org/licenses/by-nc-sa/3.0) licenses. Artist credit: R. Amos, C. M. Brown, T. Dixon, A. Farke, S. Hartman, J. Headden, T. M. Keesey, G. Monger, N. Tamura, and E. Willoughby. Three anonymous reviewers as well as A. Tomasovych (associate editor) and C. K. Boyce (editor) provided reviews and feedback that improved this article.
Data Availability Statement
Data available from the Dryad Digital Repository: https://doi.org/10.5061/dryad.mpg4f4r0z.



