Sudden cardiac death (SCD) is the leading cause of death among both men and women in the United States (47) and Canada (14). Among those at highest risk of SCD are patients with left ventricular dysfunction following acute myocardial infarction (MI) (7;12). The implantable cardioverter defibrillator (ICD) was originally developed to provide rapid defibrillation in the event of a subsequent life-threatening dysrhythmia in survivors of cardiac arrest (11;39;41). However, ICD use has also been shown to improve outcomes for patients at risk of dysrhythmia with no history of cardiac arrest, effectively serving as a means of primary prevention of SCD in such patients (12;37). Indeed, several recent studies have documented the superiority of ICDs over drug therapy for the primary prevention of death in ischemic heart disease (IHD) patients with left ventricular systolic dysfunction (5;8;30;31). These primary prevention trials involved patients who had not yet experienced a documented life-threatening ventricular arrhythmia.
Recommendations for ICD therapy as a primary prevention maneuver in patients with heart failure have subsequently broadened (19;24). However, uncertainty persists regarding the optimal use of ICDs (13;17;23;25;26;37;46). Public health insurance programs within the United States and Canada (9;29;42), including Medicare and Medicaid (10;28), have expressed concern regarding the costs and cost-effectiveness of widespread ICD utilization and have gradually established guidelines for their use. Medicare coverage of ICDs was limited to survivors of ventricular fibrillation until 1999, when patients with sustained ventricular tachycardia became eligible. Selected patients became eligible for prophylactic ICD insertion in 2003, and by 2005 eligibility included most patients with ischemic or nonischemic cardiomyopathy who have a left ventricular ejection fraction of 35 percent of less (28). These criteria are notable considering Medicare beneficiaries account for 80 percent of sudden cardiac death in the United States.
Relatively little is known about the equity of current patterns of ICD utilization. Although previous research suggests gender (16), racial (20;45), and geographical (29;35) disparities in ICD utilization, these observations were based upon patients enrolled in secondary prevention studies. We evaluated patterns of ICD implantation for primary prevention of sudden cardiac death among heart failure patients in Ontario from 1993 through 2004.
METHODS
Sources of Data
We conducted a population-based cohort analysis of trends in the rate of ICD implantation among Ontario residents from 1993 to 2004. We linked hospital admission records, physician billing claims, and procedure codes (3) for approximately 12.5 million patients in Ontario, Canada, for the period between 1 January 1993 and 31 March 2004. Hospitalizations were identified using the Canadian Institute for Health Information Discharge Abstract Database to longitudinally characterize comorbidity, subsequent illnesses, and procedures. This database contains diagnostic, procedural, and demographic information, with diagnoses coded using the International Classification of Diseases, Ninth Revision (ICD-9) and Tenth Revision (ICD-10). For each subject, age, sex, and out-of-hospital mortality were determined from the Ontario Registered Persons Database, which contains demographic information and encrypted health card numbers for all provincial residents. The study was approved by the research ethics board of Sunnybrook and Women's College Health Sciences Centre.
Estimate of Primary Prevention Cohort
We approximated a cohort eligible for prophylactic use of an ICD to improve survival among patients with IHD and left ventricular systolic dysfunction who have not had a life-threatening ventricular arrhythmia to emulate the populations recruited in the earliest primary prevention ICD trials (30). During each year of the study period, we identified all patients hospitalized with a most responsible diagnosis of congestive heart failure who survived to discharge (ICD-9 code 428 or ICD-10 code I50), preceded within 5 years by a diagnosis of MI or unstable angina (ICD-9 codes 410, 411, 412, and 413; ICD-10 codes I20, I21, I22, I252). Among these patients, we examined ICD implantation rates (Ontario Health Insurance Program [OHIP] code R753 and Z415) during hospital admission for heart failure and the subsequent year following discharge. Patients hospitalized for heart failure were excluded if they had previously survived a cardiac arrest (ICD-9 code 4275 or ICD-10 code I46.0) or received an ICD within the previous 5 years of index admission to restrict our analysis to patients eligible for ICD on the basis of primary prevention.
Data Analysis
To explore the association between demographic characteristics and rates of ICD implantation, we pooled data from all years and stratified analyses by gender, age, urban or rural place of residence (determined from home postal code), and socioeconomic status (SES). SES was estimated from postal code and provincial residual area's average income per person equivalent (IPPE), a measure of household income that is adjusted for the size of the household, based on summary data from the 1996 Canadian census (33). All residual areas were ranked, and the population was divided into income quintiles, creating community-specific income quintiles based on IPPE. These methods have been found to be a reasonable approach for classifying groups of individuals according to socioeconomic status (18). The quintiles were defined to ensure that each residual area would contain a roughly equal proportion of the population. Patients for whom these data were unavailable were excluded from the calculation of category-specific ICD implantation rates but were included in all other analyses. Characteristics of patients who received an ICD and those who did not were compared using the Chi-squared test for categorical data. Statistical analyses were conducted using STATA, version 8.0 (Stata Corp, College Station, TX) and SAS software (version 8.0, SAS Institute, Inc., Cary, NC). The authors had full access to the data and take responsibility for its integrity. All authors have read and agree to the manuscript as written.
RESULTS
Overall Utilization of ICD Therapy
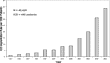
Between 1 January 1993 and 31 March 2004, we identified 48,426 patients hospitalized for heart failure following an earlier admission for either MI or unstable angina and who survived to discharge. Overall, a total of 440 patients (.9 percent) received an ICD during the hospital admission or within a year following discharge. The annual rate of ICD implantation rose gradually during the study period, from .12 percent in 1993 to 3.9 percent in 2004, representing an approximate 32-fold increase in the rate of ICD implantation for primary prevention of SCD (Figure 1).

Annual implantable cardioverter defibrillator (ICD)implantation rate among heart failure patients with a history of coronaryartery disease in Ontario, January 1993 to March 2004. Each bar representsthe total number of annual ICD implantations.
ICD Utilization Rates by Gender
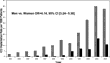
Throughout the entire study period, men were significantly more likely to receive an ICD for primary prevention of death compared with women (Figure 2). Despite universal health coverage, we found that men were more than four times more likely to receive an ICD than women (odds ratio [OR] = 4.14; 95 percent confidence interval [CI], 3.24–5.30).

Annual implantable cardioverter defibrillator (ICD)implantation rate among heart failure patients with a history of coronaryartery disease by gender, January 1993 to March 2004. Men, checkered bars;women, filled bars. OR, odds ratio; CI, confidence interval.
ICD Utilization Rates by Age
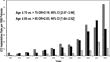
Increasing age was associated with a lower utilization rate of ICDs. Patients younger than 75 years of age were threefold more likely (OR = 3.19; 95 percent CI, 2.57–3.96) to receive an ICD than older patients (Figure 3), and patients younger than 65 years were twofold more likely than patients 65 years of age and older to receive an ICD (OR = 2.03; 95 percent CI, 1.64–2.52). The rate of ICD utilization among younger age patients increased rapidly over the study period, but utilization rates for older patients have not increased appreciably since 2000.

Annual implantable cardioverter defibrillator (ICD)implantation rate among heart failure patients with a history of coronaryartery disease by age group, January 1993 to March 2004. Patients youngerthan 65 years of age, checkered bars; patients 65–75 years of age, filledbars; patients older than 75 years of age, hatched bars. OR, odds ratio; CI, confidence interval.
Other Determinants of ICD Utilization
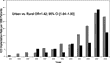
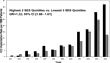
Heart failure patients who lived in an urban area were significantly more likely to receive an ICD than those who lived in a rural area (OR = 1.42; 95 percent CI, 1.04–1.93), although both groups demonstrated an increasing prevalence of ICD utilization (Figure 4). Higher income heart failure patients were also more likely than lower income patients to receive an ICD for primary prevention of death (OR = 1.32; 95 percent CI, 1.08–1.61) (Figure 5).

Annual implantable cardioverter defibrillator (ICD)implantation rate among heart failure patients with a history of coronaryartery disease by neighborhood residence, January 1993 to March 2004.Urban-dwelling patients, checkered bars; rural-dwelling patients, filledbars. OR, odds ratio; CI, confidence interval.

Annual implantable cardioverter defibrillator (ICD)implantation rate among heart failure patients with a history of coronaryartery disease by income, January 1993 to March 2004. Patients within thetwo highest income quintiles, filled bars; patients within the lowest threeincome quintiles, checkered bars. SES, socioeconomic status; OR, odds ratio;CI, confidence interval.
COMMENT
Approximately 85 to 90 percent of sudden cardiac deaths in patients with ischemic cardiomyopathy are thought to result from a first arrhythmic event (32), emphasizing the importance of equitable use of ICDs in patients at increased risk for sudden death. Using more than a decade of population-based healthcare data, we identified marked inequities in ICD insertion rates among patients receiving these devices for primary prevention. We found that younger patients and men were far more likely to receive an ICD for this indication. The influence of SES and place of residence were significant but relatively minor, and were diminishing by 2004.
Although the use of ICDs is increasing among both men and women, a persistent gender discrepancy is evident, despite a higher risk of malignant cardiac arrhythmias in women with ischemic left ventricular systolic dysfunction, heart failure, or both (40). ICD utilization discrepancies could result from a higher preponderance of preserved left ventricular function after MI reported in women (22), but this has not been convincingly demonstrated in patients recruited for primary prevention ICD trials.
Previous research has documented that, following an acute coronary syndrome, women are less likely to undergo other life-saving cardiac procedures, including angiography, percutaneous transluminal coronary angioplasty, and coronary artery bypass surgery compared with men (2;4;6;15). In one large randomized controlled trial (2), gender disparities in cardiac procedure access did not appear to influence cardiovascular mortality (cardiovascular death, MI, or stroke), but did increase the burden of IHD morbidity, including increased rates of refractory angina and rehospitalization for unstable angina. Whether gender differences in access to ICD implantation influence mortality and morbidity has yet to be determined and could be dependent upon the rate women develop left ventricular dysfunction after MI (22).
Our analysis also revealed significant discrepancies in ICD utilization based upon patient age. The cost-effectiveness of ICD use in older patients with comorbidity is controversial (1;37;38), but advancing age alone has not been demonstrated to limit the benefits of ICD insertion (36). To this end, current recommendations reserve ICD use to those patients with reasonable expectation of survival with a good functional status for more than 1 year (24).
Previous studies among survivors of cardiac arrests or ventricular arrhythmias have revealed disparities in ICD use for secondary prevention of death linked to social determinants of health, such as gender (16), race (16;20;45), place of residence (21;35), and health insurance coverage (34). This report is the first study to characterize ICD utilization for primary prevention of death among gender, age, and geographic and socioeconomic groups.
Our research has some limitations that merit emphasis. Because we used administrative data and did not have detailed data about patient-specific clinical variables (e.g., systolic function), we cannot ascertain the appropriateness of ICD utilization in individual patients. Two recent analyses of all newly diagnosed heart failure patients in Ontario between 1999 and 2001 revealed that patient median age was 77 years, half were women, and, among those who had an objective measure of their systolic function, 60 percent had a left ventricular ejection fraction less than 40 percent, and 50 percent had a left ventricular ejection fraction less than 35 percent (27;43;44). Consequently, although our cohort may be an overestimate of the proportion of patients eligible for an ICD, relative differences over time and among demographic groups are evident and relevant to consider. We also could not account for discrepancies in patient preferences or physician practices in the referral of patients for an ICD. Moreover, some patients with heart failure may have survived a cardiac arrest before hospital admission, qualifying them to receive an ICD on the basis of secondary prevention criteria. However, this limitation would yield an overestimate of ICD utilization rates for the primary prevention of death within this population, suggesting this form of preventive therapy is even more underutilized than our results suggest.
In conclusion, the rate of ICD deployment for primary prevention of death among patients with heart failure associated with coronary artery disease is increasing in Ontario, but it remains low, and major sociodemographic inequities are evident in their use. Additional research is needed to explore the causes and consequences of the pronounced age and gender discrepancies in ICD use.
POLICY IMPLICATIONS
Using more than a decade of population-based healthcare data, we identified marked gender and age inequities in ICD insertion rates among patients receiving these devices for primary prevention. Whether these sociodemographic differences in access to ICD implantation influence mortality and morbidity is unknown and warrants investigation. Given that the majority of sudden cardiac deaths in patients with ischemic cardiomyopathy are thought to result from a first arrhythmic event, healthcare providers and insurers should consider the effectiveness within current practice of equitably distributing ICDs to ischemic heart disease patients with left ventricular systolic dysfunction. Governments and healthcare payers, in particular, are grappling with the explosive potential costs of widespread ICD utilization.
CONTACT INFORMATION
Jacob A. Udell, MD MPH (jay.udell@ices.on.ca), Student, Institute for Clinical Evaluative Sciences, University of Toronto, Room G-106, 2075 Bayview Avenue, Toronto, Ontario, M4N 3M5 Canada; Postgraduate Trainee, Department of Medicine, Vancouver Hospital and Health Sciences Centre, University of British Columbia, 10203–2775 Laurel Street, Vancouver, British Columbia V5Z 1M9, Canada
David N. Juurlink, BPhm, MD, PhD (dnj@ices.on.ca), Scientist, Institute for Clinical Evaluative Sciences, University of Toronto; Staff Physician, Divisions of General Internal Medicine and Clinical Pharmacology and Toxicology, Department of Medicine, Sunnybrook Health Sciences Centre, Room G-106, 2075 Bayview Avenue, Toronto, Ontario M4N 3M5, Canada
Alexander Kopp, BA (alex.kopp@ices.on.ca, Programmer, Institute for Clinical Evaluative Sciences, University of Toronto, 2075 Bayview Avenue–G215, Toronto, Ontario M4N 3M5, Canada
Douglas S. Lee, MD, PhD (dlee@ices.on.ca), Scientist, Institute for Clinical Evaluative Sciences, University of Toronto, Room G-106, 2075 Bayview Avenue, Toronto, Ontario M4N 3M5, Canada; Staff Physician, Division of Cardiology, Department of Medicine, University Health Network, EN 6-238, 200 Elizabeth Street, Toronto, Ontario, M5G 2C4, Canada
Jack V. Tu, MD, PhD (tu@ices.on.ca), Scientist, Institute for Clinical Evaluative Sciences, University of Toronto; Staff Physician, Division of General Internal Medicine, Department of Medicine, Sunnybrook Health Sciences Centre, Room G-106, Bayview Avenue, Toronto, Ontario M4N 3M5, Canada
Muhammad M. Mamdani, PharmD, MA, MPH (Muhammad.Mamdani@ices.on.ca), Associate Professor, Faculties of Medicine and Pharmacy, University of Toronto; Senior Scientist, Institute for Clinical Evaluative Sciences, 2075 Bayview Avenue–G215, Toronto, Ontario M4N 3M5, Canada
Author contributions are as follows: study concept and design–Udell, Juurlink, Mamdani; acquisition of data–Kopp; analysis and interpretation of data–Udell, Juurlink, Lee, Tu, Mamdani; drafting of the manuscript–Udell, Juurlink; critical revision of the manuscript for important intellectual content–Udell, Juurlink, Lee, Tu, Mamdani; statistical expertise–Udell, Juurlink, Lee, Tu, Mamdani; obtained funding–Juurlink, Mamdani; administrative, technical, or material support–Juurlink, Tu, Mamdani; study supervision–Juurlink, Mamdani. Drs. Juurlink and Mamdani are supported by New Investigator Awards from the Canadians Institutes of Health Research. Dr. Lee is supported by a Clinician–Scientist Award from the Canadian Institutes of Health Research. Dr. Tu is supported by a Canada Research Chair in health services research and a Career Investigator Award from the Heart and Stroke Foundation of Ontario. Funders had no involvement in the design and conduct of the study; collection, management, analysis, or interpretation of the data; or preparation, review, or approval of the manuscript. Since completion of this research, Dr. Mamdani has initiated employment with Pfizer, Inc.