1. INTRODUCTION
The key to the integrity concept in Satellite-Based Augmentation Systems (SBAS) lies in the Protection Levels. The Protection Levels are monitored in flight and as long as they do not exceed the corresponding Alert Limits integrity is said to be guaranteed. In this paper we do not change anything to the Protection Levels or the way they are used in SBAS positioning. Currently Protection Levels cover only nominal operating conditions; here we add the concept of reliability. Extra-ordinary effects in the measurements, such as large anomalies and outliers, can be caught by statistical tests which exploit the redundancy in the measurement set. The nominal performance of these statistical tests is monitored through Reliability Levels. These Reliability Levels join the Protection Levels, and are used similarly in flight, checked against the Alert Limits. Additional safeguards against anomalies, faults and large errors in the measurements, not currently caught and compensated for by the SBAS, for instance as they occur locally, add safety but at the same time will ‘cost’ availability. This paper shows that the Reliability Levels can be included in the existing framework of integrity monitoring and, that tested using real data, the ‘price to pay’ on availability is very modest.
Section 2 sets out the preliminaries on the SBAS positioning measurement model and the data processing. Next, quality control in SBAS positioning is addressed. First the Protection Levels are reviewed, and then the Reliability Levels are introduced. The experimental part of the paper consists of a static test and a real flight test. Finally an outlook is given, by means of simulation, on the situation with GPS and Galileo.
The research underlying the paper has been carried out as part of the LANDING project. LANDING is an EU 6th Framework Programme project to develop a relatively low-cost aid (€10–15000) for pilots of small-and-medium (business) aircraft for approach and landing stages. LANDING will aid pilots during approach and landing, especially during bad weather and other difficult conditions, and allow for flexible flight paths. The TU Delft contribution lies in the development of the positioning component, based on the European Geostationary Navigation Overlay Service (EGNOS), with the pragmatic side-condition of staying compliant at all times with the integrity concept and requirements already existing in the RTCA MOPS (RTCA, 2006).
2. DATA PROCESSING
The SBAS position solution is computed on an epoch-by-epoch basis, as demanded in (RTCA, 2006). With the received SBAS information, the pseudorange measurements are corrected for satellite orbit and clock errors, and for atmospheric delays. The ionospheric error is corrected by using the gridded TEC-values as broadcast in the EGNOS message. The tropospheric error is accounted for by using a so-called blind model, with pre-set parameter values, as specified in the MOPS (RTCA, 2006). The corrected pseudorange measurements are stacked, for one epoch, in vector y. The measurements are related to the unknown parameters in vector x, consisting of position coordinates and the receiver clock error:

where E(y) denotes the mathematical expectation value of the stochastic vector y. The original non-linear functional relations between the measurements and the parameters have been approximated by linear ones and matrix A represents these linearized relations. Based on the functional model, the Weighted Least-Squares (WLSQ) estimate can be computed as

where W is the weight matrix. With Q y the measurements' variance matrix, the variance matrix of the WLSQ estimator is then found through error propagation as

The variances  for the SBAS-corrected pseudorange measurements are specified in (RTCA, 2006), resulting in a diagonal matrix Q y.
When the weight matrix W is taken as the inverse of the measurements' variance matrix, i.e. W=Q y−1 and as demanded in (RTCA, 2006) for precision approaches, Equation (2) leads to the Best Linear Unbiased Estimate (BLUE). The estimator then achieves minimum mean squared error (minimum variance) among all linear and unbiased estimators.
Finally we introduce the assumption of normally distributed measurement noise:

compliant with the rationale originally outlined, and currently still implicitly in (RTCA, 2006). In Section 5 on Reliability Levels, we will exploit this assumption, and also Section 4 on Protection Levels will touch on it. The assumption is however not needed to obtain the SBAS position solution.
3. QUALITY CONTROL
Computing the position solution (2) is generally straightforward. Providing a guarantee of quality with the solution is less trivial, though extremely important. During flight the actual position error is not known. Instead measures have to be provided in real-time, which bound the position error. Based on these measures, a decision is taken on whether it is safe or not to conduct, for instance, a precision approach.
We will distinguish between two cases. In the first one, the navigation system is operating under nominal conditions; model (1) holds true, and the only source of uncertainty lies in ordinary measurement noise (captured by the variance matrix Q y). In this case the Protection Level (Section 4) will bound the position error, due to measurement noise, up to a very large probability.
In the second case, an extra-ordinary effect is present. An anomaly or large error has occurred in one of the measurements. Here, in addition to ordinary measurement noise, there are additional sources of uncertainty relating to which measurement contains the error and its size. In this case, the standard Protection Level will not bound the position error. Instead, the Reliability Level (Section 5) will bound the position error, caused by the undetected large measurement error, to a specified small probability of missed detection.
In terms of statistical hypothesis testing, the first case (nominal conditions, fault-free) is referred to as the null hypothesis H o, and the second case is the alternative hypothesis H a. In reality we do not know whether case one or case two applies to our navigation system for the epoch at hand. Hence, in both cases maximally acceptable position errors, linked to a very small integrity risk probability of ε=10−7, needs to be met. The maximally acceptable Position Error (PE) is referred to as the Alert Limit (AL). Alert Limits bound the region that has to contain the position solution with a probability of one-minus-the integrity risk, or conversely P(PE>AL)=ε. Alert Limits will act as maximum values for the Protection Levels of Section 4, and for the Reliability Levels of Section 5. Table 1 gives the Alert Limits for precision approaches with EGNOS (ESA, 2006). When the Alert Limit is exceeded, SBAS positioning is declared to be unavailable.
Alert Limits in [m], Horizontal and Vertical, for Approach with Vertical Guidance, APV-I and APV-II and for Category 1, CAT-I, approach.

The position solution is separated into horizontal and vertical components. The PE vector Δ○=○−x, with x the true position and forgetting about the receiver clock error entry, is expressed in a local topocentric frame, whilst the norm of the East and North components  forms the Horizontal Position Error (HPE) and the absolute value of the Vertical, or Up component |Δ○ U| becomes the Vertical Position Error (VPE).
4. PROTECTION LEVEL
The Protection Level (PL) is statistically bound to the PE; in one dimension for instance linking an interval length to a probability, P(PE>PL)=ε, with ε the exceed probability.
In (RTCA, 2006) the Horizontal Protection Level (HPL) is defined as the radius of a circle in the horizontal plane, with its centre being at the true position (which is unknown), that describes the region certain to contain the indicated horizontal position, and the Vertical Protection Level (VPL) as half the length of a segment on the vertical axis, with its centre being at the true position, that describes the region certain to contain the indicated vertical position.
The propagated (ordinary) measurement noise in the position solution is captured by the variance matrix Q ○. The HPL and VPL are measures computed on the basis of elements of this variance matrix. For precision approach they read (see (RTCA, 2006)):


with
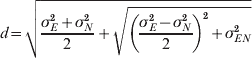
where σE2, σN2, σU2 are the variances of the East, North and Vertical (or Up) component of the position solution (expressed in a local topocentric system), σEN is the East-North covariance, and d corresponds to the error uncertainty along the semi-major axis of the error ellipse in the horizontal plane. Originally the K-values were obtained from the standard normal distribution with a one-sided exceed probability of 0·5⋅10−7 for the vertical component (leading to K V=5·33), and a much smaller one-sided exceed probability of 10−9 for the horizontal component (leading to K H=6·0). For the HPL only one dimension, the worst case, is considered. The intricacy that the HPL thereby does not bound – to the required probability – the HPE as the radial error in two dimensions, is explained in (Tiberius and Odijk, Reference Tiberius and Odijk2008).
5. RELIABILITY LEVEL
Reliability is connected to a statistical test for an anomaly in a measurement. Faults and large errors generally do not announce themselves. Instead, we have to find them. The statistical test is in fact a self-consistency check on a set of redundant measurements. We will rely on the test developed in (Baarda, Reference Baarda1968). In our study the catalogue of possible errors to consider consists of outliers in all observations, but only one at a time, hence in total there are as many error hypotheses as there are observations (m). In practice multiple errors may occur and they are handled, in real-time, by applying the testing and adaptation procedure iteratively, see e.g. (Teunissen, Reference Teunissen1990).
The null hypothesis H o was given by Equation (1). The (functional model of the) alternative hypothesis for an outlier in observation i reads:

where c i is a vector of zeros, with just a one in position i, and ∇i represents the unknown outlier error (size). With a diagonal variance matrix Q y, the test-statistic (Baarda, Reference Baarda1968) has the following simple form:

where ê i is the least-squares residual ê i=y i−ŷi of the i-th observation (with ŷi the estimate for observation y i computed with estimate ○ of (2)), and  is the standard deviation of the i-th least-squares residual. More complex error signatures, and also the case of Q y not being a diagonal matrix, can be fairly easily handled (Baarda, Reference Baarda1968). The test-statistic has the following distribution:


under null-hypothesis H o, and under the alternative hypothesis  (in the latter when indeed there is an outlier in observation y i). In practice, each of the m available observations is tested, w i with i=1, …, m, and the maximum value (in absolute sense) of the w-test-statistics, w j=max|w i| with i=1, …, m, indicates the most likely outlying measurement. If this measurement exceeds the threshold (critical value from the standard normal distribution (8a)),
 , the decision is that this observation has a large error and it should be rejected from the position solution. The testing procedure can be performed locally and in real-time, at the airborne receiver. Together with the adaptation, it allows for an automated recovery from systematic errors and anomalies.
The procedure described here is an implementation of Fault Detection and Exclusion (FDE), and a list of references on this subject is given in Appendix K of (RTCA, 2006). From the general test in (Baarda, Reference Baarda1968), a dedicated test is derived for each possible fault or error, rather than the use of, for instance, a single overall ‘chi-squared’ test. Each test is optimal for the error it suspects (Teunissen, Reference Teunissen1990). Together with the Reliability Levels, to be discussed next, the procedure provides Receiver Autonomous Integrity Monitoring (RAIM) functionality.
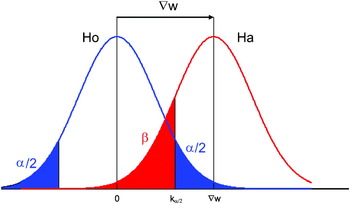
With the distributions of (8a) and (8b) we can make an analysis of the (nominal) performance of the test for each observation, and that brings us to reliability. With a choice for the false alarm probability α, critical value  is readily obtained from the standard normal distribution. Next, see also Figure 1, a required probability of missed detection β determines the corresponding offset ∇w i in the test-statistic. Then, with

the magnitude of the error ∇i in (6) is easily retrieved (the error can be positive or negative, but the situation can be mirrored about w=0). The interpretation is that when an outlier with exactly this magnitude is present, we have probability β to not detect it with the associated test (red area in Figure 1). To know the effect (bias) ∇○ i on the position solution, we propagate the undetected measurement error through Equation (2)

and finally the Reliability Levels are obtained as


with the maximum taken over i=1, …, m. The bias in the position solution is computed for every measurement (i.e. every alternative hypothesis) and the maximum is taken for the horizontal position (East and North component together) and for the vertical (Up) position component. The magnitude of the outlier responsible for the Reliability Level (i.e. worst case satellite) is denoted by ∇β.
Statistical distribution of test-statistic w under null-hypothesis H o and alternative hypothesis H a. With α=10−4, the critical value is  =3·89, and with β=10−4, we obtain ∇w=7·61. Note that formally we should discount the far left part of the red area, where it is in fact underneath the blue area at left (as here, we will be deciding that there is an outlier), but this is very small and can be neglected. In fact the missed detection probability will actually be a bit smaller than set or required.

For an outlier in the measurement to this satellite, we will now pursue a reverse reasoning. The goal thereby is to add and carefully fit the Reliability Level (RL) into the existing framework of SBAS integrity. In the particular case that the bias in the position solution equals the RL, the measurement outlier (∇=∇β) causing the bias, will not be detected with the specified missed detection probability β. Through a simple numerical example we will now justify our initial choice for the missed detection probability of β=10−4. We will do so by linking the RL to the AL and determining the integrity risk ε in case of an outlier. When the RL exceeds the AL, quality is insufficient, and SBAS positioning is unavailable (no matter whether the outlier actually occurred or not). Therefore we consider the limiting and reference situation of RL=AL with ∇=∇β. The undetected outlier centres the mean of the (biased) position solution on the AL boundary. The (ordinary) measurement noise then causes, for a one-dimensional position component, with a standard deviation assumed to be much smaller than the AL, that P(PE>AL|H a: ∇=∇β)=0·5 (for a two dimensional position error this is an approximation). And finally we account for the fact that the alternative hypothesis occurs far less often than the null hypothesis, P(H o)≫P(H a). With an assumed probability of occurrence of the outlier P(H a)=2·10−3, an integrity risk of ε=10−7 is met, as ε=P(H a)βP(PE>AL|H a: ∇=∇β).
With a false alarm probability of α=10−4, measurement testing is considered to have only a minor impact on continuity and availability. Once an outlier is detected (false alarm or justified) the measurement is excluded (adaptation) and the position solution is computed anew, and is still of sufficient quality in many cases.
It should be noted that in this article we do not so much intend to promote specific numerical values for SBAS precision approach. The purpose is rather to present the methodology, and the numerical values serve as an illustration. In the following sections we show that with these choices the concept of reliability can be added to the quality control of SBAS positioning, thereby contributing to a higher level of safety during intended operations while having only a minor impact on availability.
The increased level of safety is the result of bounding local anomalies and large errors, which are/can not be caught by the augmentation system. Outliers can now be intercepted by means of statistical testing and their effects are controlled through the associated reliability. These errors – when present – would otherwise remain undetected and potentially cause serious biases in the position solution. Once more it is stated that the existing procedure of SBAS positioning and quality control, as documented in (RTCA, 2006), is not altered; the aspect of reliability is ‘just’ added on top of it.
6. STATIC TEST
Both the static test and the flight test in the next section were carried out with a Septentrio AsteRx1 single frequency L1 GNSS receiver, configured with 16 GPS channels and 4 SBAS channels. The receiver was set-up to comply with the MOPS (RTCA, 2006) for instance, a satellite elevation cut-off angle of 5°, a 100 seconds pseudorange smoothing window and use of the MOPS tropospheric delay model.
The static test was carried out on June 29th, 2008, for a duration of 24 hours, from 00:00–24:00 UTC. The antenna was mounted on top of a 4-floor building in Delft (52°00′N, 4°22′E), see Figure 2. There is 360° sky-visibility, virtually down to the horizon, except from one obstruction (another building) in the local North direction; visibility is blocked roughly from azimuth 0° (elevation 20°) to azimuth 40° (elevation 0°). The EGNOS correction and integrity information were received through PRN 126.
Set-up of the static test with PolaNt-survey-antenna.

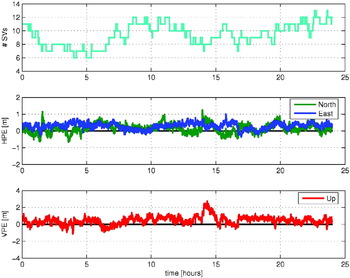
The true position of the site for the static test is known with high accuracy and this enables us to properly assess the PE. Figure 3 presents the time series of the position error, i.e. the obtained EGNOS position solution minus truth. In this figure we present all three components of the position error (East, North and Up) in order to reveal maximum detail on positioning performance. For a period of about 1 hour, during local afternoon (local time=UTC+2 hrs), the height is off by up to 2 metres. This is believed to be caused by a significant residual ionospheric delay (after application of the default EGNOS ionospheric correction). Similar phenomena have been observed on other days, and also on a nearby permanent EGNOS monitoring station.
Static test: number of satellites, horizontal position error components and vertical position error. The bias in East, North and Up is respectively 0·28 m, 0·15 m and 0·44 m. The 95% HPE is 0·74 m and the 95% VPE is 1·10 m.

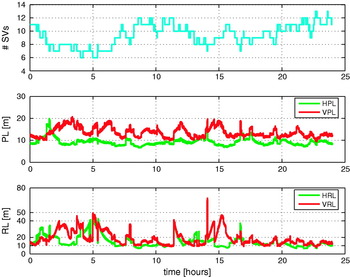
Figure 4 shows the Protection Levels and Reliability Levels as a function of time. The Alert Limits for different precision approaches were given in Table 1, and in Table 2 the availability of SBAS positioning is given, first for each Level separately, and in the last column for all four measures together (HPL, VPL, HRL and VRL).
Static test: number of satellites, Protection Levels and Reliability Levels.

Availability with static test, for Horizontal and Vertical Protection Levels, and for Horizontal and Vertical Reliability Levels. Overall availability per category of Precision Approach is given in the last column.

7. FLIGHT TEST
For the flight test, data were collected aboard a Cessna Citation PH-LAB. The flight test took place on 1 November 2007, and lasted for 4 hours. The aircraft used the Schiphol Oostbaan (04-22) at Amsterdam Airport Schiphol, and repeatedly flew a straight stretch in a South-East direction, partly into Germany. The test was flown at low altitude (about 1400 m) and low speed (typically between 50–100 m/s). The receiver was used with the same settings as for the static test, except that the EGNOS position solutions as computed in real-time were logged at a 10 Hz rate (versus 1 Hz with the static test). EGNOS PRN 120 was used for the correction and integrity information (PRN 126 was used in the static test).
On board, the Septentrio AsteRx1 receiver was connected to an L1&L2 Sensor Systems type S67-1575-96 antenna with +40dB gain, mounted on top of the body fuselage. The signal from this antenna was fed to a splitter. The DC-blockage output was connected to the AsteRx1 receiver. The other splitter end was connected to the main socket of a dual frequency Septentrio PolaRx2@ receiver. Post-processing, through carrier-phase differential GPS of the measurement data from the PolaRx2@ receiver provided the ground-truth trajectory for the full flight. The high-end geodetic equipment was fully duplicated; the ground-truth trajectory was obtained independently, by using another receiver and antenna onboard the aircraft, and another station on the ground. Comparison of the results (cross-check) verified that the ground-truth trajectory had sub-decimetre level accuracy; one order of magnitude smaller than can be expected from EGNOS. Consequently the ground-truth trajectory was used as the reference to compare against the real-time EGNOS position solutions by the AsteRx1 receiver. This allowed us to properly assess the PE.
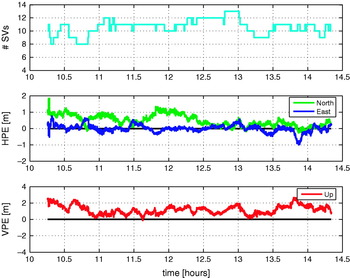
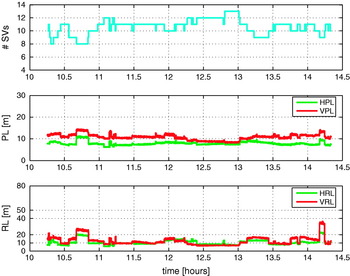
The results are shown in Figures 5 and 6. The performance is as before with the static test. There is a bias in the vertical component due to a significant residual ionospheric delay error. The flight test took place during (local) noon (local time=UTC+1 hr) and a similar bias was observed at a permanent EGNOS monitoring station (located in Delft). The resulting SBAS positioning availability is given in Table 3.
Flight test: number of satellites, horizontal position error components and vertical position error. The bias in East, North and Up is respectively −0·00 m, 0·49 m and 1·18 m. The 95% HPE is 1·05 m and the 95% VPE is 2·20 m.

Flight test: number of satellites, Protection Levels and Reliability Levels.

Availability with flight test, for Horizontal and Vertical Protection Level, and for Horizontal and Vertical Reliability Level. Overall availability per category of Precision Approach is given in the last column.

8. OUTLOOK
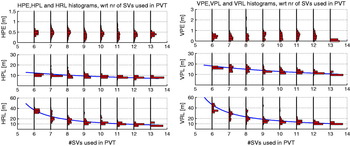
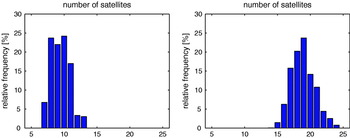
The precision of the position gets better (smaller variances), the more pseudoranges are included in the solution. And, as already pointed out in Section 5, redundancy is key to statistical testing for anomalies and large errors. For a closer inspection of these mechanisms, Figure 7 presents the PE, PL and RL as a function of the number of satellites, at left for the horizontal component, and at right for the vertical. It is the same information as in Figure 4, but presented differently. The histograms of Figure 7 can be put into practical perspective by considering the relative frequencies of the number of satellites, shown in Figure 8 at left, pertaining to the current GPS constellation.
Histograms of PE, PL and RL, versus the number of satellites used in the position solution. Static test.

Histogram of number of visible satellites with GPS-only, at left, and with GPS and Galileo at right.

The HPE and VPE are generally well below 1 and 2 metres respectively, with little or no dependence on the number of satellites used in the position solution. The Protection Levels show a modest dependence on the number of satellites. Earlier tests showed that with only four satellites the HPL is around 20–30 metres and the VPL goes up to 40 metres. With four satellites there is no redundancy and consequently the Reliability Levels are at infinity. The measures for the horizontal component are typically smaller than their vertical counterparts. The trends, shown by the blue lines, of PL and RL for the vertical component, come close to the 10 metre level (the VAL for CAT-I landings) with 12 satellites. Hence to achieve CAT-I performance we need to have this large number of satellites, or more, all the time. Today, this cannot be achieved with GPS alone. A small simulation was carried out, to provide an outlook on the performance of the combined GPS – Galileo constellation. The current performance of EGNOS is copied ahead, just with more satellites (Galileo); and single frequency operation.
For the GPS constellation an almanac was used at the time of the flight test; there were 29 healthy satellites. For Galileo, the planned nominal constellation was used with 27 satellites. The simulation was run over a 10 day period (the repeat-period of the Galileo constellation, and slightly over 10 repetitions of the GPS constellation) at a 1 minute interval. The satellite elevation cut-off angle was set to 5°. The location was Delft, in the Netherlands, at 52°00′N, 4°22′E.
The standard deviation of the EGNOS corrected pseudorange measurement was modelled (first order approximation) as  , with εi the satellite elevation angle, εo the reference elevation angle (20°), and with a=1·0 m and b=3·5 m. The standard deviation is 1·0 m to zenith, and 2·7 m at 15° elevation.
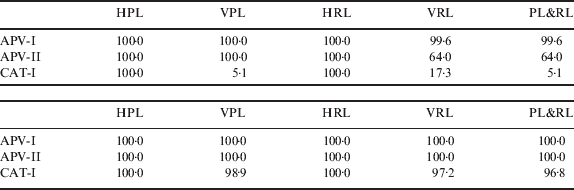
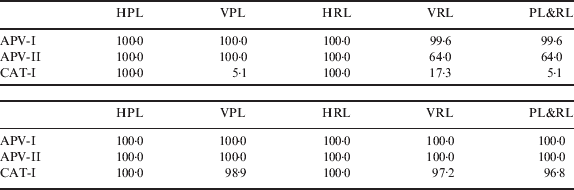
Table 4 shows that, when both PLs and RLs are being used, only APV-I approaches can be performed with GPS alone. When GPS is used together with Galileo, both APV-I and II availability is 100%, and even CAT-I availability goes beyond 95%.
Availability with simulation, for Horizontal and Vertical Protection Level, and for Horizontal and Vertical Reliability Level. Overall availability per category of Precision Approach is given in the last column. On top for GPS-only, at bottom for GPS+Galileo.
9. CONCLUSIONS
In this contribution on quality control of SBAS positioning, we have reviewed the commonly used Protection Levels, and have proposed to add Reliability Levels. The Reliability Levels represent the performance of statistical tests for anomalies and errors in the measurements. This testing allows the user receiver to catch systematic errors which are not accounted for by the SBAS-infrastructure. The embedding of the Reliability Level into the existing framework of SBAS positioning and quality control presented in this paper is only a first attempt. Tuning of the approach needs further attention. A simple numerical example was provided as a demonstration of meeting aeronautical requirements. The reasoning needs to be extended for instance in the direction of multiple outlier hypotheses. By means of two practical experiments, a static test and a flight test, it was shown with the proposed initial set-up, that enhancing safety through testing and Reliability Levels leads to only a minor reduction of availability. The tests confirm the EGNOS position accuracy (95%) at 1 metre for the horizontal position (HPE), and 2 metres or better for the vertical (VPE).
ACKNOWLEDGMENTS
This research has been carried out for the European Union (EU) Sixth Framework Programme (FP6) project LANDING, under EC contract EC-FP6-AST5-CT-2006-030905. LANDING, as a Specific Targeted REsearch innovation Project (STREP), has the aim of developing landing software for small-medium aircraft on small-medium airfields. The project is carried out by a European consortium, led by Epsilon GIS Technologies SA in Greece and ESRI GeoInformatik GmbH in Germany. More information on the project is available at www.landing-eu.eu.
The authors would like to acknowledge contributions, assistance and support by various TU Delft colleagues, in particular Hans van der Marel, Lennard Huisman and Brian Gunter.