Implications
This work has shown that the IDEA method can be used to characterize efficiently the economic sustainability of contrasted pig farming systems, even if it was not exclusively designed as an economic sustainability evaluation tool, but as part of a more global method. It is an easy to use tool that can be applied to different pig farming systems, but also any other agricultural system, through a common benchmarking.
Introduction
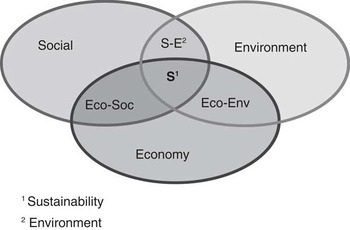
Sustainability is not a notion that is easy to apprehend simply, as there are many interpretations. Classically, though, sustainability is declined in three main pillars, environment, social and economic, which interact, as represented in Figure 1.
Simplified representation of the three pillars of sustainability, based on several descriptions.

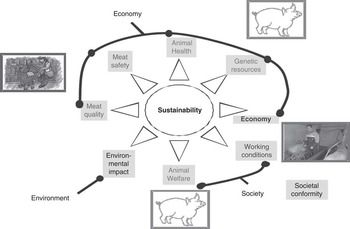
They are in continual evolution, adapting to the constant modifications of agriculture (Pretty, Reference Pretty1998). In this paper, we will consider that a sustainable farm is ‘a farm operation that is viable, livable, transferable and reproducible’ (Landais, Reference Landais1998). As mentioned in the introductory paper (Bonneau et al., Reference Bonneau, de Greef, Brinkman, Cinar, Dourmad, Edge, Fàbrega, Gonzàlez, Houwers, Hviid, Ilari-Antoine, Klauke, Phatsara, Rydhmer, van der Oever, Zimmer and Edwards2014a), eight active themes were chosen to assess sustainability, through its three traditional pillars (Figure 2). The ‘Economic’ pillar is represented by five different themes, ranging from meat quality and safety to genetic resources and animal health. It also includes an economy theme, which will from thereon be described as economic sustainability in the paper, though it is only a part of the economic pillar of the total sustainability evaluation tool of pig farming systems.
Simplified representation of the eight themes of the global sustainability evaluation work, chosen to represent the three traditional pillars of sustainability.

Many sustainability studies focus more on environmental or welfare issues, on how to measure them, to implement them. In many studies, economic sustainability is rarely taken into account, or as a secondary part of the work often reduced to viability (i.e. the fact that the farm will still be there in the close future). This is usually assessed by profitability and indebtedness for short-term analyses (Sridhar and Mandyam, Reference Sridhar and Mandyam2010).
Economic sustainability is what contributes to making the farm, the system, the whole chain perennial. It can range from short-term performances (profitability) to longer-term analysis, such as transferring the farm to future generations. As seen in Figure 1, it also has interactions with environmental or social issues. Such indicators can be found in studies by the Environmental Protection agency of the United States of America (http://www.epa.gov/sustainability/). They put forward the use of indicators such as the water use per gross domestic production unit, as a sustainability indicator for water resources (use of water with respect to economic output). These researches are, however, conducted at country level and often cover many fields and sectors (industry, services, agriculture, etc.). Many voices also call to take Natural Capital into consideration when estimating the economic pillar of sustainability. Natural Capital can be defined as the total of natural resources (earth, minerals, water, etc.) needed for the production of goods either renewable or non renewable (United Nations et al., 2005). In Classic (Smith, Reference Smith1776) or Neoclassic economy theories, farm land is considered as a production factor and is composed of all natural resources (water, soil, minerals, but also fauna and flora). It is separate from capital, which is defined as man made goods, such as buildings, machinery, tools. There are many opinions referring to its correct indicators, analysis method and even its sustainability. Since the Rio summit in 2012, works are being carried out to present common Natural capital indicators, based on already available variables and that can be used at a global or continental scale (WAVES program, begun in 2010). They take into account land composition (pasture land, crops, forests, wetlands, etc.), protected areas, energy and minerals criterion. In this study, the choice was made to focus on the farm/system economy exclusively to assess its economic sustainability.
This economic sustainability analysis, as for the other themes, was carried out a farming system level (Bonneau et al., Reference Bonneau, de Greef, Brinkman, Cinar, Dourmad, Edge, Fàbrega, Gonzàlez, Houwers, Hviid, Ilari-Antoine, Klauke, Phatsara, Rydhmer, van der Oever, Zimmer and Edwards2014a) through several kinds of indicators (Gibbon,Reference Gibbon1994; Spedding, Reference Spedding1994). The approach of developing an economic sustainability tool at farm level should be holistic (Gibon et al., Reference Gibon, Sibbald, Flamant, Lhoste, Revilla, Rubino and Sørensen1999): the farm must be considered as a whole and the assessment should not focus on the pig unit only. If in some European countries, pork production is issued from farms specialized in pig production, in some others, such as France, they are much more varied (Boschma et al., Reference Boschma, Joaris and Vidal1999; Ilari et al., Reference Ilari, Daridan, Desbois, Fraysse and Fraysse2004). At farm level, it is important to consider what the aims of the farmer are: pleasure in his work, lifestyle, environmental issues, supporting a family, etc. (Loevinsohn et al., Reference Loevinsohn, Sumberg and Diagne2012). There is often more than one reason and they often interact to form a complex objective (Gartforth and Rehman, Reference Garforth and Rehman2005). However, to reach these diverse ends, it is essential to consider the farm’s global economic health and profitability as a major mean to provide an income allowing the farmer to reach his aims correct and regular income and to be able to pass on a viable farm (Anderson et al., Reference Anderson, Hachfeld and Weness2003). Lien et al. (Reference Lien, Hardaker and Flaten2007) have also underlined the importance of resilience for a farm to be able to continue operating in the future. When applied to agriculture, it could be translated as the capacity of a farm to survive various risks and shocks and therefore, studies on farm/system sustainability need to integrate their dynamic nature, which can be done through stochastic models.
There are some general rules for the development of economic indicators. They have to be simple, practical, pragmatic, easy to use and to communicate, reproducible, comparable and understandable by the farmers; indeed, they should be SMART,that is, specific, measurable, available, relevant and timely (Doran, Reference Doran1981). The data set to be collected must be available for each of the studied system in the various countries. In this paper, the chosen tool assessing economic sustainability will be described. An analysis of the relationship between variables will allow identifying similar systems but more importantly highlight the possibility offered by the tool to underline the most important variables that contribute to the variability between systems. The other aspects of this study, common to all the tools, are addressed in the introductory paper (Bonneau et al., Reference Bonneau, de Greef, Brinkman, Cinar, Dourmad, Edge, Fàbrega, Gonzàlez, Houwers, Hviid, Ilari-Antoine, Klauke, Phatsara, Rydhmer, van der Oever, Zimmer and Edwards2014a).
Material and Methods
The first step of this work was to identify an adapted economic sustainability evaluation tool and from it to derive a standard operating procedure. This was then used during farm interviews, on a small sample issued from contrasted European pig farming systems. A statistical analysis of the collected data was then carried out with the main objective of analysing the relationships between variables and identifying which of those variables are the most significant to account for the observed variability between farms.
Economic tool definition
The scope of the economic tool should comprehend assessments of viability, efficiency and transferability of pig farms. The initial review of literature for such a tool considered possible options including: the IDEA method (Briquel et al., Reference Briquel, Vilain, Bourdais, Girardin, Mouchet and Viaux2001; Vilain et al., Reference Vilain2003), the Sustainability Diagnosis (Réseau Agriculture Durable – Sustainable Agricultural Network, 2002), the study on agricultural sustainability indicators for regions of South Australia (Duncombe-Wall et al., Reference Duncombe-Wall, Moran, Heysen and Kraehenbuehl1999). The most appropriate tool for Q-PorkChains was identified in the IDEA method, as it is a comprehensible, reproducible and pragmatic tool, already validated in the field, and used as a reference for sustainability assessment on farm. IDEA (Indicators of sustainability of the farms) is a tool developed by agricultural teaching professionals and agronomic researchers. It is composed of three main scales (agro-ecological, socio-territorial and economic). Each scale is equal in weight and is represented by a score from 0 to a 100 sustainable units or points.
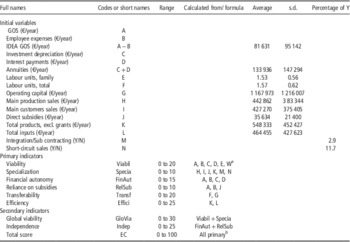
The economic sustainability scale of IDEA aims to go further than the traditional short-term economic performance, and also take into account the farm’s degree of independence, its capacity of being transmitted and the efficiency of its production process. The scale is based on four main dimensions, divided into six primary indicators and three secondary indicators calculated from the primary ones (Zahm et al., Reference Zahm, Viaux, Vilain, Girardin and Mouchet2008). These indicators are calculated through 14 initial variables (collected data) and the subsequent mark is benchmarked to produce a final Total Economic Score (EC) out of 100 as described in Table 1. The W variable stands for the yearly national legal minimum wage (NLMW) and is specific to each country, common to all sectors.
Procedure for calculating the economic indicators from the initial variables

GOS=gross operating surplus; EC=economic score.
a W=national legal minimum wage (NLMW).
b Sum of all the primary indicators.
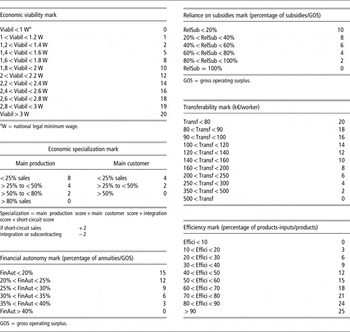
For each indicator, the higher the score, the more sustainable the farm is. The indicators were chosen through a scientific literature review and validated by experts and through practice tests. The minimal value associated with most indicators is zero, though this score can simply signify that the farm is not concerned by the indicator. However, in some cases, negative scores can be obtained, underlying a critical situation in regard of sustainability. The economic indicator benchmarking thresholds were based either on the distribution of the Farm Accountancy Data Network (FADN) data or on known ‘critical’ values of frequently used economic ratios. They were selected not as an optima to be achieved, but to identify practices or results with no negative effects on sustainability. These maximal scores give different weighs to the indicators, though most of them are close. Those considered as more fundamental are given a slightly heavier weight, particularly in the economic scale. This scoring benchmark (Table 2) was also thoroughly tested, to discriminate farms as much as possible.
Benchmarking used to calculate the economic indicator scores from the economic indicator marks (issued from the initial variables)
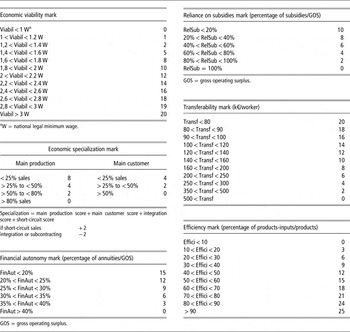
The global economic viability indicator (GloVia=Viabil+Specia) characterizes the economic situation of the farming systems in the short-term economic performance. Viability (Viabil) is the available income per family worker (variable E) in relation to NLMW. It is based on several variables. The global operating surplus (GOS) is one of the intermediate balances calculated in the earnings report. It is the potential cash flow generated by the main activities (in our case, pig production), after having paid the costs of salaried work but before amortization. In this particular case, IDEA does not take salaried work into consideration. So the IDEA GOS calculation is GOS=[total sales (goods+products)+grants+compensations]−[purchases (sold goods+animals+inputs)+taxes]. Therefore, employee expenses (variable B) had to be identified to be taken out of the standard GOS data (variable A).
Annuities amount are defined as the sum yearly paid to the bank to reimburse investments, usually composed of the investment depreciation (variable C) and the interest paid to the lender (variable D).
 $${\rm C}{\plus}{\rm D}={\rm annuities}$$
 $$\left( {{\rm C }/{\rm 2}} \right){\plus}{\rm annuities}={\rm Borrowing\ need}\,\left( {{\rm BN}} \right)$$
 $$\left[ {\left( {{\rm A}{\minus}{\rm B}} \right){\minus}{\rm BN }} \right]/{\rm E}={\rm Economic}\,{\rm viability}\,{\rm mark}$$
The Viabil mark is then benchmarked in comparison with the national legal minimum wage (W) to produce the Viabil score (Table 2).
Specia illustrates the economic specialization of the farm. It is benchmarked through the percentage represented by the main production sales (variable H) and the main client sales (variable I) compared with the total sales. Total sales are the total value of the sales of products of the farm (animals, vegetables, etc.), goods and services, including subcontracted fattening, taking animals in pension (e.g. horses), renting land and on-farm tourism. It is estimated by adding the total product (variable K) and the direct subsidies (variable J). A specialized farm (only one main production, only one client) will get no points while a more diversified one can get up to 12 points (Table 2). The presence of an integrated production (the farmer rears animals that do not belong to him) is translated into negative sustainability points (variable M) and can lead to a negative score, if there are no correcting factors on the farm. On the other hand, the presence of short-circuit sales (sales on the farm, on markets, or through catering, at a farm inn) will give an extra two points to the Specia score (variable N). The GloVia indicator can represent up to 30 points of the total score. It has got a slightly heavier weight than the three other main indicators (Indep, Tranf and Effici), as the IDEA designers underline that the absence of economic viability can considerably impact the immediate future of the farm, while the others are more medium to long-term indicators.
The global Independence indicator (Indep=FinAut+RelSub) characterizes the economic and financial independence, which generally guarantees the medium-term future of the farms. It allows farming systems to adjust more easily to the inevitable changes in public subsidies, mainly with the successive CAP reforms (1984 and the creation of milk quotas, 1992 and the reduction of guaranteed prices, 2003 and the decoupling of the direct payments, and the current reform begun in 2013) and to have the capacity to adapt the farm through new investments. FinAut characterizes its financial autonomy, through the ratio between annuities and GOS.
 $$\left( {{\rm C}{\plus}{\rm D}} \right)/\left( {{\rm A}{\minus}{\rm B}} \right)={\rm Financial}\,{\rm autonomy}\,{\rm mark}$$
This mark is expressed in percentage to estimate the final FinAut score from the benchmarking. RelSub illustrates its reliance on direct subsidies (variable J) from the Common Agricultural Policy or other bodies, through the importance of their amount compared with the GOS. It is also expressed in percentage before benchmarking (Table 2).
Transferability (Transf) addresses long-term analysis issues, illustrating the farm’s ability to carry on from one generation to the next. The high amounts currently reached can lead to a farm being broken up or sold in case of succession issues. It is assessed by the variable G or operating capital (global value of the farm, excluding land, i.e., the capital immobilized by the buildings, the equipment, animals destined to reproduction), divided by the number of family workers and paid associates (variable F). This result, expressed in thousands of Euros per worker, is then benchmarked (Table 2).
The efficiency of the production process indicator (Effici) is used to assess autonomy and the capacity of the production systems to make optimum use of their own resources as well as to guarantee their sustainability over the very long term. It is estimated via the total products, variable K (total amount of sales linked to production (animal, animal product and vegetable sales), excluding grants) and the total inputs, variable L (costs directly linked to the farm activity: energy, water, fertilizers, seeds, pesticides, feed/feedstuff, drugs, etc. and other labour such as specific temporary employees or subcontracting) through the following procedure:
 $$\left( {{\rm K }{\minus}{\rm L}} \right)/{\rm K }={\rm Efficiency}$$
The Efficiency mark is then benchmarked to produce the Effici score (Table 2).
Data collection
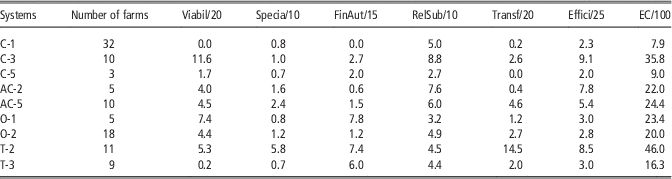
Three contrasted systems in each of five major European pig producing countries were selected for analysis: one conventional system and two alternative ones, as described in the introductory paper (Bonneau et al., Reference Bonneau, de Greef, Brinkman, Cinar, Dourmad, Edge, Fàbrega, Gonzàlez, Houwers, Hviid, Ilari-Antoine, Klauke, Phatsara, Rydhmer, van der Oever, Zimmer and Edwards2014a). A sample of 10 farms/system was initially planned but sometimes less farmers were interviewed as not enough farms were available for some specific systems (see Table 3). In 9 of the 15 systems (listed in Table 3), there were no major difficulties with the data collection as efficient technical-economic management exist for these chains and producers were quite willing to provide the required data. The results presented in this study refer to these nine systems. The interviews were carried out on the farm, mostly during one visit and the data collected refers to the fiscal year 2008. For countries with different currency than the Euro, a yearly average exchange rate was applied.
Number of farms interviewed and average values of the indicators and total EC per farming system
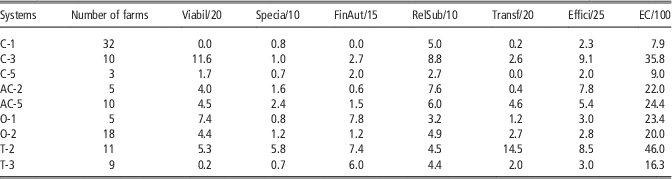
Viabil=viability; Specia=specialization; FinAut=financial autonomy; RelSub=reliance on subsidies; Transf=transferability; Effici=efficiency; EC=economic score.
Tool analysis
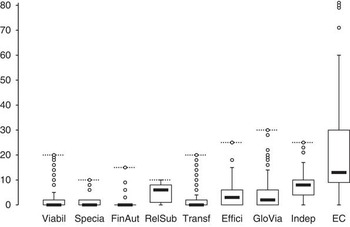
In this study, some systems were represented by very few farms (five or less), so that the results of a statistical analysis of system differences could hardly be significant. Therefore, the main goals of the statistical analysis of the data were to show relationships between variables (correlation matrix and principal component analysis (PCA)) and identify which of them contributed most to the observed variability between farms (PCA and cluster analyses). The statistical analyses were carried out with the R software (R Development Core Team, 2008). The correlation matrix was calculated using the COR procedure. PCA was performed, using the PCA procedure, on the six primary indicators as active variables. The secondary indicators were used as supplementary variables, appearing in the result but not participating in the analysis. As the population did not follow a normal distribution for the chosen variables (Figure 3), a PCA based on ranks was performed. Clustering analysis was conducted on the basis of the results of the PCA analysis, using the agglomerative nesting (AGNES) procedure. Finally, the significance of differences between cluster groups and the overall population was investigated, using the categorical description (CATDES) procedure.
Simple statistics (Boxplot) of the indicators. The horizontal bold line denotes the median. The box denotes the first and third quartile. The whiskers extend 1.5 times the interquartile range from the box. Open circles represent individual values extending out of the whiskers. The horizontal dotted lines denote the maximum possible range for the indicator. For economic score , the maximum possible value was 100.

Results
Analysis of farms and systems
The representation of the variability of the farms population of farms for each indicator (Figure 3) showed that, except for EC, the scores for individual farms explored all or most of the possible range. It also hinted at a non-normal distribution for the variables. The total economic sustainability score for each system (EC) ranged between 8 and 46 (Table 3), all below the ‘medium’ score of 50, with only two well above ‘poor’ (a score of 20). In each of the six basic indicators, scores varied greatly between each system, underlining the ability of the IDEA tool to give an extensive overview of a variety of systems (Table 3). It was also quite sufficient to translate the reality of pig producing farms. Globally, the ‘reliance on subsidy’ scores were quite high, reflecting the fact that most pig farms are very little subsidized. Quite at the opposite, the ‘economic specialization’ scores were low, with the exception of system T-2, meaning that most pig farms were highly specialized.
Relationships between variables and their contribution to the observed variability
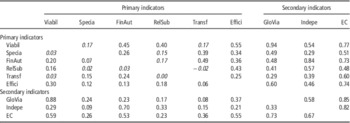
The correlations between the six primary indicators (Table 4) were rather low (−0.02⩽r⩽0.55), showing that they were not redundant. Viability (Viabil), Financial Autonomy (FinAut) and process efficiency (Effici) were the most closely related to the Total EC.
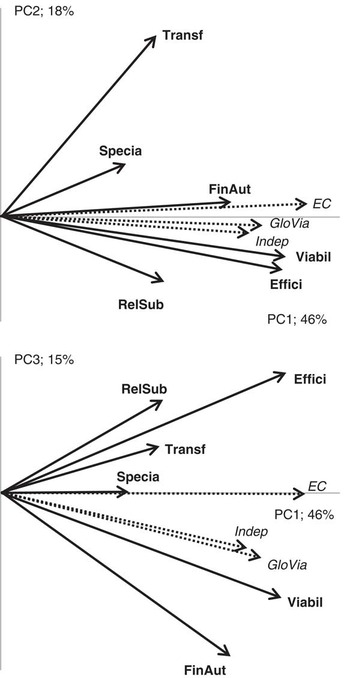
The first two components of the PCA analysis accounted for 64% of total variability (Figure 4, left panel). The first component, accounting for 46% of the observed variability, represents the variations in Total EC, which was closely linked to Viability (Viabil), Efficiency (Effici) and Financial Autonomy (FinAut), as confirmed by the correlations presented in Table 4. The second component, accounting for 18% of the observed variability, mostly represents the variations in Transferability (Transf). The third component (Figure 4, right panel), accounting for 15% of the variability, opposes Financial Autonomy (FinAut) and Viability (Viabil) to Efficiency (Effici) and Reliance on Subsidies (RelSub).
Map of the variables on the plane defined by the first two components (left panel) and by the first and third components (right panel) of the principal component analysis.

Coefficients of correlation (above diagonal) and coefficients of determination (below diagonal) between indicatorsFootnote a

Viabil=viability; Specia=specialization; FinAut=financial autonomy; RelSub=reliance on subsidies; Transf=transferability; Effici=efficiency; GloVia=global viability; Indep=independence; EC=economic score.
a Non-significant correlations are in italics.
The cluster analysis carried out on the individuals’ rank PCA values highlighted the variables that contributed most to the observed variability. Five groups were identified in the cluster analysis. Group 1 is mainly composed of farms from AC-5 and C3 systems, group 2 is more varied, but ‘traditional’ system T-2 stands out. Group 3 is the smallest, with only 9% of the total number of interviewed farms; the two main systems represented are C-3 and O-2. The largest group is number 4 with close to half the surveyed farms. System C-1 is the main system represented but AC-2, T-3, O-2 and C-5 are also present, in important proportions, considering the total of surveyed farms per system. Finally, group 5 is composed mainly by T-2 and O-2 system farms. There are a few systems that can be found in important proportion in more than one group; the main one is the O-2 system, divided between three groups, but also T-2 and C-3.
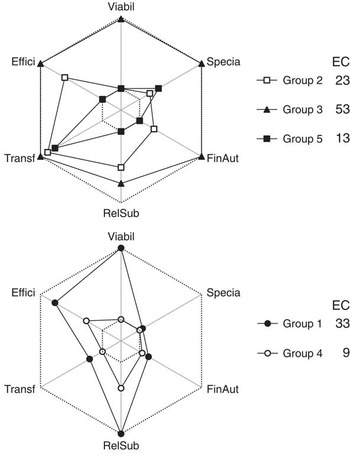
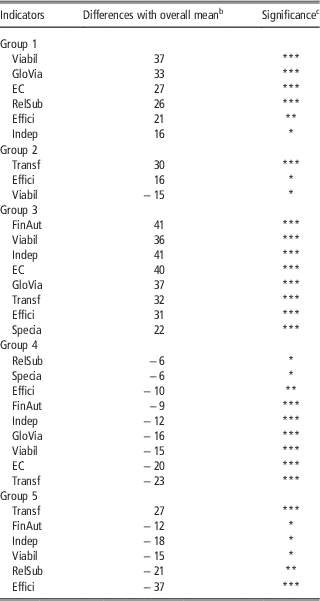
The farms of these five groups identified in the cluster analysis were mapped individually on the plane defined by the first and second components of the PCA analysis (Supplementary Figure S1); a first graphic analysis suggests that groups 4 and 5 had low scores for most indicators, as shown in Figure 5. This is confirmed by the results of the CATDES procedure (Table 5). Group 4, composed by two-thirds of farms with conventional production systems, had lower than average scores for all indicators. Group 5, composed of more alternative systems, had higher than average Transferability (Transf) but lower than average scores for most of the other indicators, especially Efficiency (Effici). Group 2 was mostly characterized by higher than average Transferability (Transf). Group 1 had higher than average results in Viability (Viabil), Global Viability (GloVia), Total EC, Reliance on Subsidies (RelSub), Efficiency (Effici) and Independence (Indep). Group 3 had higher than average scores on all indicators but Reliance on Subsidies (RelSub). It is apparent from these results that all six primary indicators differ significantly between the various groups.
Spider graphs of the average scores achieved in each of the five groups identified in the cluster analysis. For clarity, the indicators were normalized in order to range from 0 to 1 (dotted lines). The average economic score per group are indicated in the legend.

Significant differences between the group means and the overall mean for each of the five groups identified by the cluster analysisFootnote a

Viabil=viability; GloVia=global viability; EC=economic score; RelSub=reliance on subsidies; Effici=efficiency; Indep=independence; Transf=transferability; FinAut=financial autonomy; Specia=specialization.
a Within group, indicators are listed from the most significant positive difference (group mean>overall mean) to the most significant negative difference (group mean<overall mean).
b Difference between the group means and the overall mean.
c Significance of differences between the group means and the overall mean: *P<0.05, **P<0.01,***P<0.001.
As mentioned in the introductory paper, systems are kept anonymous so more detailed analyses were not carried out.
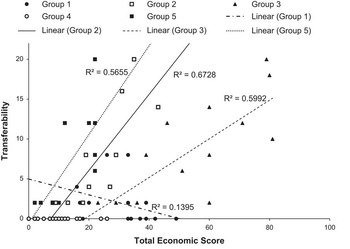
The relationships between Transferability (Transf) and Total EC is illustrated in Figure 6. All farms in Group 4 had low EC and a null score for Transf. In Group 1 both EC and Transf were low and very weakly related. On the other hand, a close positive relationship was observed between Transf and EC in the other three groups, the same levels of Transf being achieved with much higher EC scores in Group 3 than in Groups 2 and 5.
Plot of Transferability (Transf) against Total Economic Score (EC). Farms are identified by the groups determined from the cluster analysis.

Contribution to the integrated evaluation of farming systems
The economy theme contributed to the integrated analysis of 15 farming systems (Bonneau et al., Reference Bonneau, Klauke, Gonzàlez, Rydhmer, Ilari-Antoine, Dourmad, de Greef, Houwers, Cinar, Fàbrega, Zimmer, Hviid, van der Oever and Edwards2014b), with the six primary indicators. In six systems, the data were not available as the farmers were reluctant, or simply refused to reply to economic and financial questions. The primary indicators from these farms were then estimated through more global sources. Data from the FADN were used to characterize production levels of conventional systems as well as prices (pigs, feed, etc.). The FADN (http://ec.europa.eu/agriculture/rica/) is an official European Community instrument for evaluating the income of agricultural holdings and the impacts of the Common Agricultural Policy throughout Europe. These data were combined with Interpig results, furnishing valuable information on productivity results, production costs, slaughter weights as well as financial details. Interpig is a European workgroup whose aim is to provide comparable technical and economic information in the main European pig producing countries; yearly production cost reports are published by the BPEX, cofounding member of the group (http://www.bpex.org/prices-facts-figures/reports/InterpigReports.aspx). BPEX is the pig section of the British Agriculture and Horticulture Development board. These results for the conventional systems were combined with expert information for the differentiated systems. The data estimates were based on the number of animals present on each farm (sows for farrow-to-finish units and number of pigs produced for fatteners).
Discussion
Results
As mentioned in the introductory paper, the aim of this work was to build a comprehensive tool for the evaluation of pig farming systems, robust enough to accommodate the large variability of systems existing in Europe. The results were therefore a highlight of the differences between farms and systems rather than system comparison. The IDEA method applied to farms from varied and contrasted systems gave a fairly realistic overview of the characteristics of pig production. The farms globally had good Reliance on Subsidies scores (RelSub) as pig production is not the object of CAP subsidies (as beef production, for example). They also had rather poor economic specialization scores (Special); these low scores were linked to the specificities of pig marketing as most conventional pig producing systems are specialized in pig production (above 80% in sales) and have only one main client (above 50% in sales).
The correlation analysis identified three variables that contributed the most to the Total EC: Efficiency (Effici), Viability (Viabil) and Financial Autonomy (FinAut). By construction, they weigh more on the total score than Specialization (Specia) and Reliance on subsidies (RelSub). However, Transferability (Transf), which has a rather high weight, is not very highly related to EC. A specific analysis of the relationship between Transf and EC showed that there is indeed a strong link between them in the subgroups where Transf is not null (groups 2, 3 and 5). Transf seems a fairly significant indicator for separating pig producing farms as its score is either null or very important. There is only one way to get a high economic sustainability score, and that is to get good scores for each indicator, as in group 3, whereas there are several ways to achieve poor EC scores: having very low scores all over (group 4), having high Viability and reliance on Subsidies scores but poor scores in the other indicators or average Efficiency, Transferability and Reliance on subsidies scores and low scores elsewhere; these different profiles are very instructive as to where the main improvement efforts should be focused.
Methodological approach
The statistical analysis of the six indicators has shown that they are all important to describe the farm and system variability. Indeed, they were not redundant, as shown by the correlation analysis, and they all participated in characterizing significant differences between the groups identified in the cluster analysis. Moreover, they are based on only 14 initial economic variables. However, even so little data was difficult to obtain in some systems. Therefore, close collaboration with national or regional government is important in order to apply this sustainability evaluation method. Another possibility would be working with farmers’ organization (as the ‘groupements’ in France or the NFA in the United Kingdom), or with private techno-economic analysis firms, such as Agrovision in the Netherlands or SIPP consulting in Spain.
In the IDEA tool, the data for 3 years is required, to dilute the effects of the event of very good or very bad years. For this study, only the 2008 economic data was collected, mainly to save time during the on-farm interviews. Unfortunately, it was a difficult financial year, as feedstuff prices had been very high and well over the pig selling values in most European pig producing countries. So the Efficiency score, for example, will have been lower than during a more ‘average’ year. It is thus vital for representativeness of the data to collect the data for the required 3 years. Even better, collecting data over 5 years would be ideal, as it corresponds to the current pig price cycle in Europe.
Some indicators, though identified through the literature review, were not directly addressed by the IDEA tool. The analysis of farm/system resilience, their ability to resist shocks, is dynamic, but most of the models found during the initial review and able to assess short, medium and long-term sustainability issues were static. The IDEA tool is therefore strongly linked to the moment it is carried out, even if a minimum of three fiscal years (see above) must be collected during the farm interviews. The Financial Autonomy and Transferabilty indicators give some indications of the future of the farm. If heavily indebted, it will be less able to resists shocks, and if very costly to transfer, it could get dismantled when transmitted.
The notion of risk aversion could also have been taken into account as it can structure the investments on the farms and the amount of loans the producers will take. More detailed information on investments and indebtedness could give more hindsight in this matter. The idea of Natural capital could also be integrated, simply by taking into account the value of the land possessed by farmers in the operating capital. It could be modulated by its biodiversity, in regards to the presence or not of crops, pastures, protected areas, as well as the visual integration of the farm in the countryside, its added value to the scenery (well kept fields, hedges, trees, etc.).
Another important point is that it is quite vital to be sure that all the economic definitions are homogeneous and, if necessary, provide a detailed description with an example. Some work has been carried out to adapt the IDEA method to the FADN data (Girardin et al., Reference Girardin, Mouchet, Schneider, Viaux and Vilain2004); while some difficulties appeared for the other two pillars of IDEA, the economic sustainability score turned out to be compatible with the FADN data. It can allow a first basic comparison of the economic sustainability of pig production in the EU 27 countries.
Very contrasted systems were selected for the present study with the aim of fully representing the high diversity of situations that can be found in Europe. Such a large variability in our data set is an important part for the robustness of the tools. The analyses carried out show that the IDEA method was able to highlight differences between systems and why these systems were different or similar. However, when comparing farms or systems in widely differing countries, some benchmarks could need to be adapted to each country or type of country (EU or not, new EU member, etc.). Indeed, when comparing transferability or efficiency levels, it is important to bear in mind the economic level of the country considered. The benchmarking is not specific to pig production but the farm approach is holistic, taking into account mixed production farms (fairly frequently found in France, for example). It could allow future comparisons with other systems (cattle or crops).
Finally, it has to be reminded that the comparison of systems was not the purpose of this study but a side-effect to check the IDEA tool’s capacity to characterize the economic sustainability of contrasted systems. To achieve that, each system should be represented by a higher number of farms in a more balanced way.
Conclusions
As a conclusion, the IDEA method has been well adapted to characterize the economic sustainability of pig farms throughout Europe, with clearly different scores between systems, underlining the tool’s robustness. The results were also consistent with the known reality of pig farms in major European pig producing countries. The following statistical analysis was effective, even on a small sample of farms, in successfully identifying five significantly different subgroups in the total population.
Its reduced number of initial variables makes the IDEA method easy to implement, provided that farmers or organizations are willing to share the required economic data, and the six indicators then obtained have been shown to be all important.
This method could be proposed as a robust tool to carry out an evaluation of the economic sustainability of any pig farming system, provided that a sufficient number of farms are investigated to ensure representativeness. We believe the tool to be robust enough to allow comparison of contrasted systems, from conventional to traditional ones. For an optimal use of this tool, a good collaboration with bodies strongly involved in pig production is necessary, considering the sensitive nature of sharing economic data for the farmers in many countries.
Acknowledgements
The authors gratefully acknowledge from the European Community financial participation under the Sixth Framework Programme for Research, Technological Development and Demonstration Activities, for the Integrated Project Q-PorkChains FOOD-CT-2007-036245. The views expressed in this publication are the sole responsibility of the author(s) and do not necessarily reflect the views of the European Commission. Neither the European Commission nor any person acting on behalf of the Commission is responsible for the use, which might be made of the information. The information in this document is provided as is and no guarantee or warranty is given that the information is fit for any particular purpose. The user thereof uses the information at its sole risk and liability.