Milk production in Ireland, as well as some other countries, including New Zealand, is seasonal, in contrast to most other countries in the world. Milk production in Ireland reaches a peak in May–June, with a trough in December–January when most cows have reached the end of lactation (Donnelly & Barry, Reference Donnelly and Barry1983; Auldist et al. Reference Auldist, O'Brien, Cole, Macmillan and Grainger2006). The seasonality of milk supply in Ireland is the biggest obstacle for the dairy industry, especially Irish cheese manufacturers, as the production of high quality products in the winter months cannot be guaranteed (Lucey & Fox, Reference Lucey and Fox1992). Seasonal changes in milk composition reflect both lactational and nutritional influences. High quality cheese is produced throughout most of the lactation but, in seasonal countries, it can be difficult to produce good quality cheese during the late autumn/winter period, due to the reduced volume and the poor quality in late lactation milk (Lucey, Reference Lucey1996).
Lactation stage is the major factor affecting the characteristics of milk, such as fat, protein, lactose and main mineral contents (Decaen & Adda, Reference Decaen and Adda1970; Schutz et al. Reference Schutz, Hansen, Steuernagel, Reneau and Kuck1990). As lactation progresses, levels of protein, fat, plasmin and free fatty acids and somatic cell count (SCC) increase, and levels of lactose and casein, as a percentage of total protein, decrease (Lucey et al. Reference Lucey, Kindstedt and Fox1992). The most significant compositional changes occur in late lactation and should therefore be observed in milk for manufacturing in Ireland in the months from September to December. Such changes may directly affect the processing properties in terms of the quality and yield of certain dairy products, e.g., cheese. Late-lactation milk is characterised by a long rennet-clotting time and low gel firmness (White & Davies, Reference White and Davies1958b; Lucey et al. Reference Lucey, Fox and Kindstedt1991) which leads to decreased syneresis and quality defects in Cheddar cheese, e.g., a high moisture content (O'Keeffe, Reference O`Keeffe1984). Compositional changes in casein from milks of herds in late lactation resemble those associated with the secretory disturbance in milk from individual cows, and have been attributed predominantly to selective proteolysis of individual casein components by the alkaline milk proteinase (Barry & Donnelly, Reference Barry and Donnelly1981). Traditionally, most Irish Cheddar cheese factories stopped production during the winter months due to these quality problems and the lack of sufficient good quality milk (Lucey, Reference Lucey1996).
A number of studies have been undertaken in relation to Cheddar cheese yield and stage of lactation (Donnelly & Barry, Reference Donnelly and Barry1983; O'Keeffe, Reference O`Keeffe1984; Barbano et al. Reference Barbano, Rasmussen and Lynch1991; Kefford et al. Reference Kefford, Christian, Sutherland, Mayes and Grainger1995; Ostersen et al. Reference Ostersen, Foldager and Hermansen1997; Sapru et al. Reference Sapru, Barbano, Yun, Klei, Oltenacu and Bandler1997; Coulon et al. Reference Coulon, Verdier, Pradel and Almena1998; Hickey et al. Reference Hickey, Kilcawley, Beresford, Sheehan and Wilkinson2006), but no study has examined in detail the changes in proteolysis during ripening at different lactation stages, particularly using two-dimensional electrophoresis (2-DE) in combination with Matrix-Assisted-Laser-Desorption/Ionization Time-of-Flight (MALDI-ToF) mass spectrometry. Therefore, Cheddar cheese was made on a one-litre laboratory scale over a complete lactation cycle between April and December. Cheddar cheese samples were ripened over a period of 6 months and regularly sampled to follow the ripening process. Proteomic tools were applied to study the changes in milk and cheese which occur over a full lactation period.
Materials and Methods
Milk
Fresh raw milk was obtained from a spring calving Friesian herd (245 cows) at 6 different time points (April, May, July, August, October and December, 2006) from the Teagasc Dairy Production Research Centre, Moorepark (Fermoy, Ireland) over a full lactation period. Diet consisted of grazed grass for most of the lactation with concentrate supplementation at early and late lactation. During the main grass-growing period (major portion of the lactation), cows grazed to a post-grazing grass height of 60 mm. The cows received 3 kg of concentrate per day from calving to 1 May and 2 kg of concentrate per day from 1 October to 20 December.
Cheese manufacture
The milk obtained was standardised prior to making miniature cheeses; part of the milk was separated at 55°C and the resultant skim milk was added to whole milk to give a standardised milk with a casein:fat ratio of 0·7:1·0. Milk was then batch-pasteurised at 63°C for 30 min and held overnight at 4°C prior to processing. Maxiren 180 (DSM Food Specialties, Delft, The Netherlands) was used as coagulant. A defined strain starter culture (DVS, R604 Y, Chr. Hansen, Roskilde, Denmark) was added to the milk (200 μl/l) at 30°C and Cheddar cheese was manufactured according to the procedure described by Shakeel-Ur-Rheman et al. (Reference Ur-Rheman, McSweeney and Fox1998) with the modification that cheeses were produced on a 1-litre laboratory scale. Cheeses were subsequently ripened at 8°C for 6 months.
Milk sampling and analysis
Each milk sample was analysed for gross composition using a Milkoscan 605 instrument (Foss Electric, Hillerød, Denmark). The somatic cell count (SCC) of the milks was measured once per sample using a Somacount 300 (Bentley Instruments, Inc., USA). Plasmin activity in milk was determined in duplicate using the method by Richardson & Pearce (Reference Richardson and Pearce1981), and expressed in AMC units (nanomoles of AMC released per minute)/ml.
Chymosin and plasmin hydrolysis
A chymosin hydrolysate was prepared by making up a 3% (w/v) solution sodium caseinate (Kerry Ingredients, Listowel, Ireland) in distilled water (3 l). The pH of this solution was adjusted to 5·6 using a 2 m HCl and 900 ml Maxiren (Carbon Group, Ringaskiddy, Ireland) was added. This solution was incubated at 37°C in a water bath for 40 min and then the enzyme was heat-inactivated at 70°C for 10 min. The sample was then freeze-dried (Manifold, Edwards Modulyo 4K, Crowley, West Sussex, UK) and used for two-dimensional gel electrophoresis (2-DE).
For the plasmin hydrolysate, plasminogen was first activated to active plasmin. An activation buffer containing 0·05 m Tris, 0·02 m lysine, 0·1 m NaCl, and 25% glycerol (v/v) (Sigma-Aldrich) was made up and adjusted to a final pH of 8·5 using 1 m HCl. Bovine plasminogen (50 mg) (Sigma-Aldrich, St. Louis, MO, USA) was dissolved in 6 ml of this buffer and the solution was filtered through a 0·45 μm filter (Sartorius AG, Goettingen, Germany). Separately, 25 μg urokinase (Sigma-Aldrich, St. Louis, MO, USA) was dissolved in 40 ml of the activation buffer. A sample consisting of 5 ml of this urokinase solution was filtered through a sterilised 0·45-μm filter. The filtered urokinase solution was then added to the plasminogen solution and the mixture incubated at 37°C for 17 h. A 2% sodium caseinate solution (1 litre) was adjusted to pH value 7·5 using 1 m NaOH. The plasmin solution was added to the sodium caseinate solution and incubated at 37°C for 8 h and was then freeze-dried and used for 2-DE.
Cheese sampling and analysis
One-day-old cheeses were analysed in triplicate for fat (International Dairy Federation (IDF), 1986a), salt (IDF, 1988), total nitrogen (macro-Kjeldhal method; IDF, 1986b) and moisture content by drying to a constant weight at 102°C (IDF, 1982). Cheeses after 1 d and 6 months ripening were also analysed for plasmin activity using the above method (Richardson & Pearce Reference Richardson and Pearce1981) and results are expressed as AMC units/g cheese.
Proteolysis in cheese
One-dimensional gel electrophoresis
One dimensional urea-polyacrylamide gel electrophoresis (PAGE) was used to study the proteolysis occurring in cheese over the ripening period (1 d, 2 and 4 weeks, 3 and 6 months). Urea-PAGE of cheese samples, loaded on a total protein basis, was performed as described by Rynne et al. (Reference Rynne, Beresford, Kelly and Guinee2004). Gels were then scanned using a calibrated GS-800 densitometer (Bio-Rad Laboratories Ltd, Hemel Hempstead, Herts, UK).
Two-dimensional gel electrophoresis (2-DE)
2-DE was performed on the cheese samples taken at 1 d, 3 and 6 months of age. Isoelectric focusing (IEF) was carried out using a PROTEAN IEF cell (Bio-Rad, Hercules, CA, USA) according to the manufacturer's instructions. Cheese samples (10 mg) were mixed with a rehydration buffer (8 m urea, 2% CHAPS, 50 mm DTT, 0·2% Bio-Lyte 3/10 ampholyte, 0·001% Bromophenol Blue). Mixed samples (125 μl) were loaded on to immobilised pH gradient (IPG) strips (pH 4–7, 7 cm, Bio-Rad) which were then passively rehydrated for 8 h, followed by active rehydration for 8 h. The IPG strips were then focused at 20°C until 20 kV was reached. After focusing, the strips were immediately used for second-dimension sodium dodecyl sulphate polyacrylamide gel electrophoresis (SDS-PAGE), which was carried out under reducing conditions using 15% acrylamide gels, in a Criterion© Dodeca Cell unit (Bio-Rad, USA). The focused IPG strips were equilibrated with 50 mm Tris/HCl, pH 8·8, 6 m urea, 30% glycerol, 2% SDS and 130 mm DTT and alkylated in the same buffer containing 130 mm iodoacetamide instead of DTT. The gels were then run at 200 V for 50 min, stained using colloidal Coomassie blue (Chevalier et al. Reference Chevalier, Rofidal, Vanova, Bergoin and Rossignol2004) and images from stained gels were digitised at 300 dpi with a calibrated GS-800 densitometer (Bio-Rad Laboratories).
In-gel digestion and matrix-assisted-laser-desorption/ionization time-of-flight
Relevant protein spots were excised from the 2D-gels and 50 μl acetonitrile was added to each gel spot and left at room temperature for 15 min (Shevchenko et al. Reference Shevchenko, Wilm, Vorm and Mann1996). Acetonitrile was then removed and 25 μl of 25 mm ammonium bicarbonate was added for 10 min to rehydrate the spots. This procedure was repeated twice more and then the spots were dehydrated with 50 μl acetonitrile. The acetonitrile was subsequently removed and the spots were dried at 37°C for 20 min in a heating block.
Sequencing-grade modified trypsin (Promega Corporation, Madison, WI, USA) was dissolved in 25 mm ammonium bicarbonate up to a final concentration of 10 ng/μl. A 3 μl aliquot of trypsin solution was added to each spot and this was allowed to absorb fully into the spot before further 3 μl aliquots of trypsin were added until the spot was fully rehydrated. Ten microlitres of 25 mm ammonium bicarbonate was added to cover the spots. Each gel spot was kept on ice during rehydration with trypsin to prevent trypsin autodigestion peaks. Gel spots were digested in a Discover Microwave (CEM Corporation, Mathews, NC, USA) at 50 W at 55°C for 15 min. Digests were allowed to cool and supernatant was removed to a fresh Eppendorf tube. To each gel spot, 10 μl of 25 mm ammonium bicarbonate in 50% acetonitrile was added, after 15 min this was added to the original supernatant.
Mass spectrometry was performed on the gel spot extracts with an Axima TOF2 MALDI-ToF mass spectrometer (Shimadzu Biotech, Manchester, UK). A 0·5 μl aliquot of matrix solution (α-cyano 4-hydroxy cinnamic acid, 10 mg/ml in 50% acetonitrile–0·1% (v/v) trifluoroacetic acid) was deposited onto the target and left for 5 s before being removed. The residual solution was allowed to air-dry and 0·5 μl of the sample solution was deposited onto the pre-coated sample spot. A 0·5 μl aliquot of matrix solution was added to the deposited sample and allowed to air-dry. The sample was subsequently analysed in positive-ion reflectron mode.
Protein identification was carried out via peptide mass fingerprinting (PMF) using the Mascot search engine (http://www.matrix-science.com). The monoisotopic, positive ion data±0·25 Da was searched using the following parameters: NCBInr database or Swiss Prot, taxonomy mammalian, trypsin digest with one missed cleavage. Variable modifications, including cysteine modified by carbamidomethylation, and methionine modified by oxygen were also checked.
Tandem mass spectrometry (MS/MS) was carried out on peaks from spots that did not score well using PMF. The MS/MS positive ion, averaged data±0·8 Da was again searched using the Mascot search engine (http://www.matrix-science.com) and the following parameters: NCBInr database or Swiss Prot, taxonomy mammalian trypsin digest with one missed cleavage or semi trypsin with one missed cleavage, variable modifications including cysteine modified by carbamidomethylation, methionine modified by oxygen and/or Acetyl N-terminal.
Results and Discussion
Milk composition
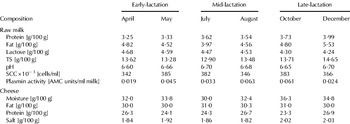
The composition of raw milk over the course of lactation is presented in Table 1. The concentration of protein and fat in the raw milk increased from early-lactation (April and May) to late-lactation (October and December), while lactose concentration decreased over the same time period. These results are in agreement with previous studies (Sapru et al. Reference Sapru, Barbano, Yun, Klei, Oltenacu and Bandler1997; Hickey et al. Reference Hickey, Kilcawley, Beresford, Sheehan and Wilkinson2006). The SCC of milk remained consistent over the trial period. Typically, late-lactation milk has elevated SCC, even in the absence of mastitis, as lactation progresses towards involution (Auldist & Hubble, Reference Auldist and Hubble1998). However, a strict cow drying-off regime was in place in this trial, where all the cows were dried off at a yield of 7 kg milk per day. The pH of raw milk increased slightly over the lactation cycle. The lower lactose level and slightly increased pH of milk are characteristic of both elevated SCC and late lactation (Auldist & Hubble, Reference Auldist and Hubble1998).
Composition of raw milk used for cheese manufacturing and composition of Cheddar cheese on day 1 after manufacture at various stages of a full lactation

Cheese composition
The gross composition of the prepared miniature Cheddar cheeses (made on a one-litre laboratory scale) is given in Table 1; cheeses made in April or May (early-lactation milk) had the lowest moisture content and cheeses made in October or December (late-lactation milk) had the highest moisture content. There were no major differences in the fat content of cheese between the different lactation stages. The protein content of miniature Cheddar cheese made in April–May (early-lactation milk) was slightly lower than that of cheese made in July–August. However, the protein content of cheese made in October was the lowest and the protein content of cheese made in December was the highest of the miniature cheeses made. The salt content and pH of cheeses were not affected by stage of lactation. Moisture content was thus the major compositional difference between the cheeses, and the higher moisture content found in cheeses from late-lactation milk is in agreement with earlier studies (O'Keeffe, Reference O`Keeffe1984; Lucey Reference Lucey1996, Hickey et al. Reference Hickey, Kilcawley, Beresford, Sheehan and Wilkinson2006). It is thought that the increased moisture content in cheese from late-lactation milk is related to diet (Lucey et al. Reference Lucey, Kindstedt and Fox1992; Kefford et al. Reference Kefford, Christian, Sutherland, Mayes and Grainger1995) and may influence biochemical reactions, due to increased activity of micro-organisms and enzymes (Lawrence & Gilles, Reference Lawrence and Gilles1980; Hickey et al. Reference Hickey, Kilcawley, Beresford, Sheehan and Wilkinson2006).
Plasmin activity
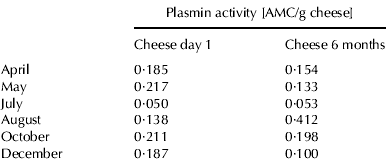
Plasmin assays on raw milk samples showed the highest plasmin activity in August and October (Table 1). Plasmin is primarily secreted in normal milk as plasminogen and is activated during storage (Driessen & van der Waals, Reference Driessen and van der Waals1978; Alichanidis et al. Reference Alichanidis, Wrathall and Andrews1986) or while milk is held in the mammary lumen before milking (Donnelly & Barry, Reference Donnelly and Barry1983; Schaar, Reference Schaar1985). Plasmin activity in milk increases at the end of lactation (Bastian & Brown, Reference Bastian and Brown1996), probably because of increased transport of plasminogen into the mammary gland (Schaar, Reference Schaar1985; Bastian et al. Reference Bastian, Brown and Ernstorm1991). Saeman et al. (Reference Saeman, Verdi, Galton and Barbano1988) correlated plasmin activity with increasing SCC; however, such a correlation was not found in this study.
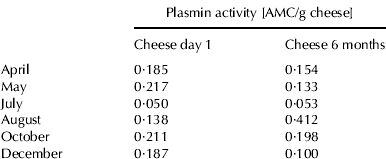
Cheddar cheese samples taken 1 d or 6 months after manufacture showed no clear seasonal trend in plasmin activity (Table 2). The comparison of plasmin activity on a protein basis in Cheddar cheese samples after 6 months ripening and plasmin activity of the original cheese milk showed that the plasmin activity in Cheddar cheese was up to 8 times higher than in the original cheese milk in this study. Ollikainen & Nyberg (Reference Ollikainen and Nyberg1988) showed that, on a protein basis, plasmin activity in Swiss-type cheese was 2–3 times higher than that in cheese milk. They suggested that, because the level of casein in their assay mixtures was higher for milk than for cheese, casein may behave as an inhibitor in the assay mixture. Another reason for observing higher plasmin activity in cheese than in milk is that inhibitors of plasmin and plasminogen activator are removed from cheese when the whey is drained (Bastian & Brown, Reference Bastian and Brown1996). Rynne et al. (Reference Rynne, Beresford, Guinee, Sheehan, Delahunty and Kelly2008) reported that plasmin activity in cheese increased over a 6 months ripening period, presumably due to activation of plasminogen (Barrett et al. Reference Barrett, Kelly, McSweeney and Fox1999), but this was not consistently observed in this study.
Plasmin activity of cheddar cheese samples made in different months on 1 d and 6 months ripening
Gel electrophoresis
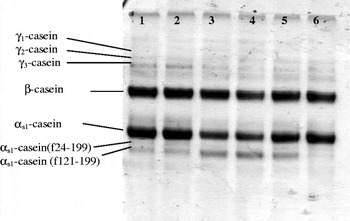
Urea-PAGE electrophoretograms of Cheddar cheese samples were obtained at different time points of the ripening process. The hydrolysis of β-casein in all cheeses was clearly indicated by the decrease in the intensity of the β-casein band and the formation of γ1-caseins (β-casein f106–209), γ2-casein (β-casein f29–209) and γ3-caseins (β-casein f108–209) (Figs. 1 & 2) which are the primary breakdown products of β-casein by plasmin (Bastian & Brown Reference Bastian and Brown1996; Sousa et al. Reference Sousa, Ardo and McSweeney2001). Protein patterns on day 1 after manufacture (Fig. 1) of cheeses in October and December showed less intact β-caseins in parallel with increased levels of γ-caseins, compared with cheeses on the same day of ripening but manufactured in early lactation. Hydrolysis of αs1-casein was minimal in all of the cheeses at day 1.
Urea-PAGE electrophoretograms of 1-d-old Cheddar cheese made in (1) April; (2) May; (3) July (4) August; (5) October; or (6) December.

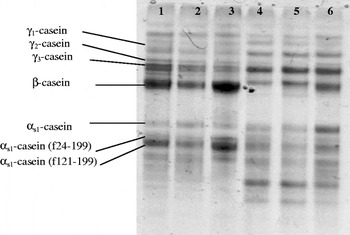
Urea-PAGE electrophoretograms of 6-months-old Cheddar cheese samples made in (1) April; (2) May; (3) July; (4) August; (5) October; or (6) December.

Cheese samples taken after 6 months ripening showed more extensive hydrolysis of the caseins (Fig. 2). Cheeses made in April or May showed no difference in the intensity of the hydrolysis of αs1-casein, while cheeses made in August showed the most extensive proteolysis of αs1-casein after 6 months ripening. Hydrolysis of αs1-casein is primarily due to chymosin, while hydrolysis of β-casein is mainly due to plasmin (Barrett et al. Reference Barrett, Kelly, McSweeney and Fox1999). Cheese made in December showed less hydrolysis of αs1-casein than cheese made in August or October. Hydrolysis of β-casein was slower than that of αs1-casein in all cheeses, which is in agreement with the trends reported previously for full-fat Cheddar cheese (Kelly et al. Reference Kelly, Fox and McSweeney1996; Fenelon & Guinee, Reference Fenelon and Guinee2000). Cheese made in July showed the highest level of residual intact β-casein. Cheese made in August and October showed the most extensive proteolysis of β-casein, with increase in the intensity of bands for the γ-caseins. Those results are consistent with the higher plasmin activity found in this cheese (Table 2). Cheeses made in August, October or December showed a higher degree of proteolysis of β-casein compared to cheese made in April, May or July. This is also in agreement with the plasmin activity found in those cheeses. A clear increase in the intensity of γ-caseins can be observed in the cheese made in August.
Comparison of the 2-DE electrophoretic patterns of cheddar cheese
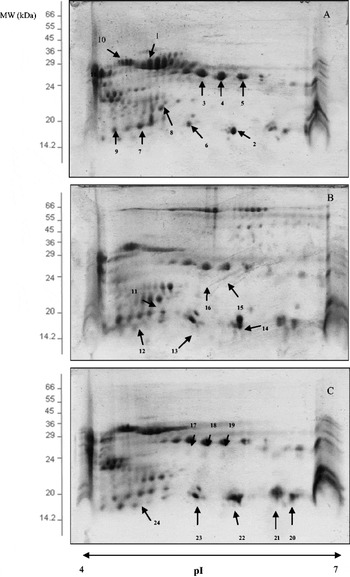
The protein patterns in Cheddar cheese ripened for 6 months and produced at different lactation stages were analysed by using 2-DE. The resulting protein maps (Fig. 3) compare Cheddar cheese made in April (A), August (B), and December (C). The pattern of spots found in cheese produced in April was different compared with that of Cheddar cheese produced in August or December. During ripening, both αs1- and β-casein were progressively hydrolysed in all cheeses. However, more low-molecular weight spots, presumably proteolysis products, can be seen in the 2-DE electrophoretogram of cheese produced in August and December, which is in agreement with observations by urea-PAGE (Fig. 2) results for those cheeses.
Two-dimensional gel electrophoretograms of cheeses made in April (a), August (b) or December (c) separated under reducing conditions using a 7 cm pH 4–7 pI range for the first dimension and a 12% gradient acrylamide SDS-PAGE gel for the second dimension.

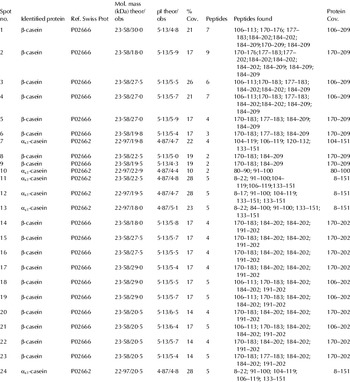
To identify some of proteolysis products in cheeses made in April, August and December MALDI-ToF mass spectrometry was performed. Identification of the 24 spots analysed are shown in Table 3. Of the polypeptides identified, 5 spots were identified as αs1-casein products with apparent molecular masses from 18·0 to 22·9 kDa and apparent isoelectric points from 4·4 to 5·1; 18 spots were identified as β-casein products (18·0–29·0 kDa, pI=4·3–6·5). The spots identified here for β-casein include molecular masses which are higher than the parent proteins, which is in agreement with the study of Creamer & Richardson (Reference Creamer and Richardson1984), who found that molecular masses of bovine casein found in SDS-PAGE were too high compared with the sequence calculated estimates. However, intact αs1-casein has a molecular mass of 22 974 kDa, while β-casein has a molecular mass of 23 583 kDa. There were far more proteolysis products originating from β-casein than from αs1-casein, which is as expected as plasmin mainly hydrolyses β-casein in cheese (Fox & McSweeney, Reference Fox and McSweeney1996). Most of the spots identified corresponded to proteolysis products of the caseins (e.g., 3, 4, 5, 15, 16, 17, 18, 19), probably originating from the activity of the principal indigenous milk protease plasmin and chymosin, and spots 14, 20 and 21 are apparently low molecular weight breakdown products of β-casein that have a very high isoelectric point.
Identification of spots from the 2-D gels of cheeses produced at different lactation stages, by peptide mass fingerprinting using MALDI-ToF†

† Protein reference (Ref.) correspond to the Swiss-Prot/NCBI accession number;% cov. refers to sequence coverage. Theoretical molecular mass and isoelectric point (pI) of proteins are as according to the amino acid and without consideration of degradation or modifications. Observed molecular mass and isoelectric point (pI) are as observed with the position of the corresponding spots on the 2-DE gels
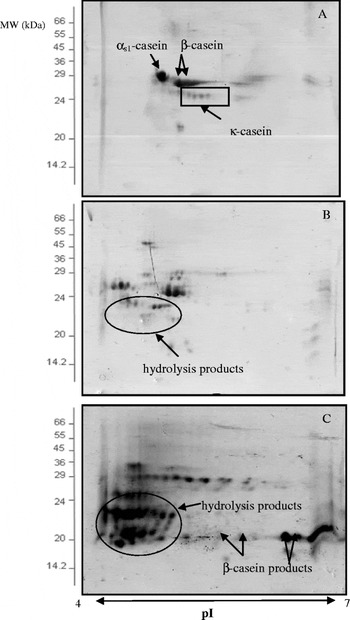
The identification of the proteolysis products in cheeses (Table 3) suggests that they are mainly products of plasmin. However, to further verify if the proteolysis products were mainly due to plasmin, a 2-DE comparison of hydrolysis of sodium caseinate by plasmin or chymosin was undertaken. The protein pattern of sodium caseinate is shown in Fig. 4a. In comparison, sodium caseinate incubated with chymosin (Fig. 4b) showed proteolysis products occurring in the lower pI region of the 2-D gel. However, the 2-D gel of sodium caseinate incubated with plasmin was clearly different compared with that of sodium caseinate or sodium caseinate incubated with chymosin; more proteolysis products can be seen below the αs1-casein region and in the lower molecular weight and higher pI region of the gel. Moreover, a comparison of Fig. 3 with Fig. 4c shows that proteolysis products present in sodium caseinate incubated with plasmin might show similar electrophoretic behaviour to those present in the 2-D gel of Cheddar cheese samples (e.g., spots 2, 5, 13, 14, 21, 22, 23, 24). This further substantiates the previous identification of spots as originating from hydrolysis by plasmin or chymosin.
Two-dimensional gel electrophoretograms of sodium caseinate (a) sodium caseinate incubated with (b) chymosin for 40 min or (c) plasmin for 8 h, separated under reducing conditions using a 7 cm pH 4–7 pI range for the first dimension and a 12% gradient acrylamide SDS-PAGE gel for the second dimension. Spots in (a) were tentatively identified by reference to Holland et al. (Reference Holland, Deeth and Alewood2004) and Larsen et al. (Reference Larsen, Hinz, Jørgensen, Møller, Wellnitz, Bruckmaier and Kelly2010).

Conclusion
There were clearly differences in milk samples obtained over lactation stage. The major compositional difference between cheeses manufactured at different stages of lactation was moisture, which correlated positively with advancing lactation. One- and 2-DE gels showed proteolysis during 6 months ripening was more developed in later lactation stages. The proteomic patterns of Cheddar cheeses produced at different lactation stages were investigated in detail and 24 spots were identified. The data suggests that the variability in hydrolysis of caseins and derived low molecular mass products in cheese is mainly due to plasmin. This finding may be of interest to the cheese manufacturers as the seasonality of milk supply in some countries cannot guarantee the production of high quality products (e.g., Cheddar cheese) in certain months.
Funding for this research was provided under the National Development Plan 2007–2013, through the Food Institutional Research Measure, administered by the Department of Agriculture, Fisheries and Food, Ireland.