What happens after Brexit?
In this study we estimate the permanent effects on the British economy once Brexit has actually materialised. There are several channels through which Brexit can affect the British and European economies.Footnote 1
Trade and foreign investment
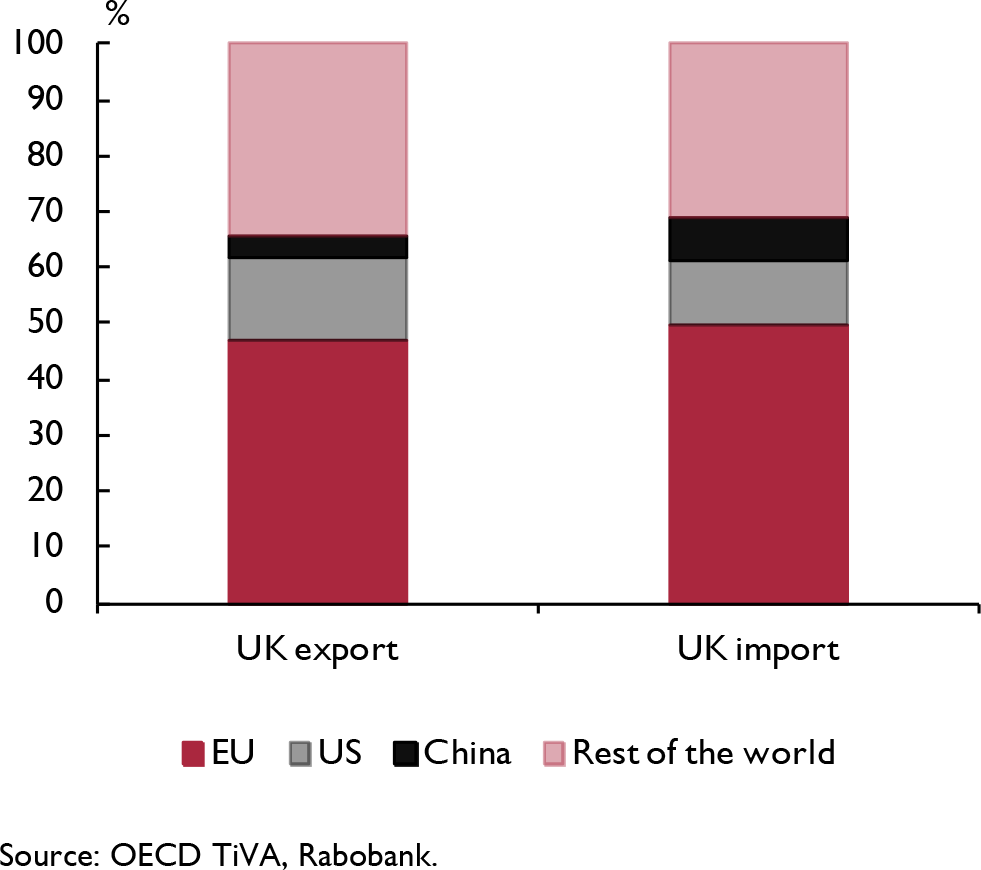
A first important channel is trade, as the EU is the UK's most important trading partner (figure 1). The introduction of tariffs on goods and non-tariff barriers on goods and services, such as customs controls, raises trade costs on UK exports for the EU and vice versa. Higher import inflation due to these increased trade costs also results in a lower real disposable income of households, which will squeeze their purchasing power. In addition, the UK purchases about half of its imported intermediate products from the EU.Footnote 2 Imports of intermediates would become more expensive due to trade barriers, which means that British companies would face a deterioration of competitiveness, higher export prices and a lower global market share.
The EU is the UK's most important trading partner
Source: OECD TiVA, Rabobank.

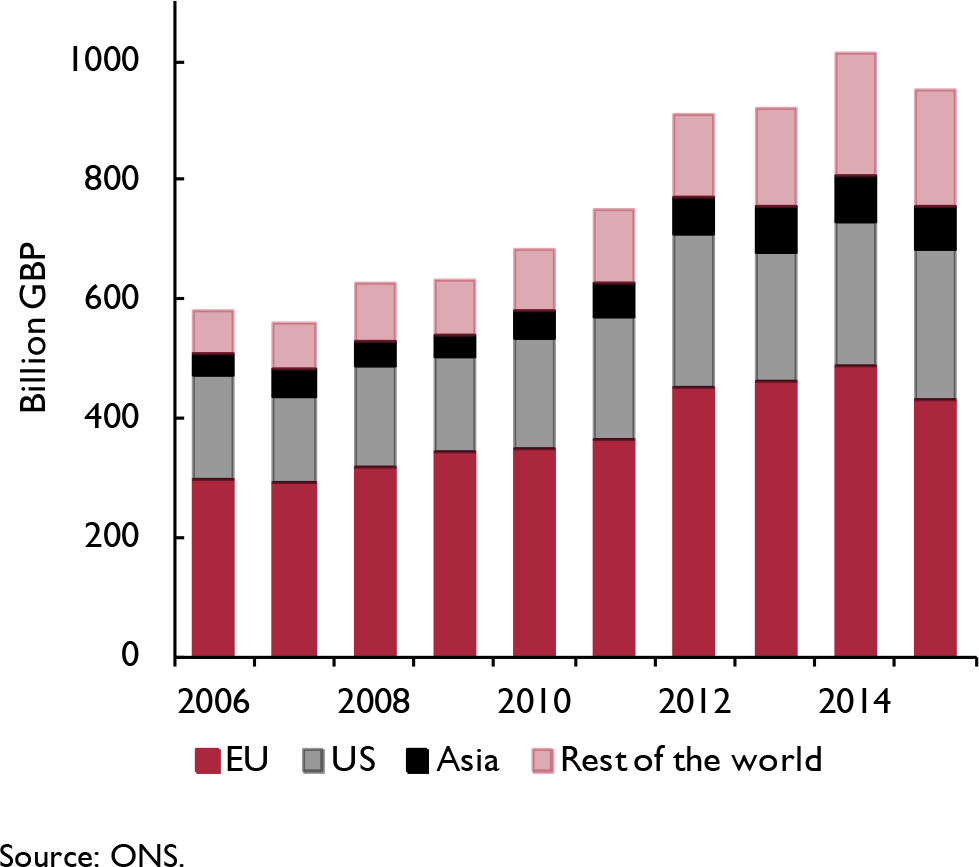
Half of all foreign FDI in the UK finds its origin from the EU
Source: ONS.

An exit from the EU also means that the UK is at risk of losing its position as a gateway to Europe, which will come at the expense of foreign direct investment. Currently, many firms are already putting investment plans on hold, while others will even decide to cease business activities in the UK. A recent survey of 1,200 major European companies, of which 80 per cent are active in the UK, shows that half of these companies are planning to invest less in the UK after Brexit.Footnote 3 In addition, 28 per cent indicate that they plan to move a large part of their capacity and 15 per cent say that they intend to stop all activity in the UK.
Moreover, the UK runs the risk of losing its ‘financial services passport’ for UK financial institutions. These passport rights ensure that European and non-European financial institutions located in the UK can serve the entire European Single Market from one location. If the UK loses these rights, London will most likely have to give up its current position as the financial centre of Europe, which would not only have implications for foreign direct investment but would also have negative implications for all kinds of economic activity related to financial intermediation, such as legal advice and accountancy. It is still questionable whether the UK will retain these passport rights after Brexit. Even Switzerland, which is integrated in the EU internal market to a large extent, does not have these financial service passport rights.
Although the strong depreciation of the pound gives some relief to British exporters, only 40 per cent of exchange rate fluctuations usually feed into export prices.Footnote 4 Thus, the deteriorating effect of imported cost-push inflation on relative export prices outweighs the effects of the depreciation of the pound.
Productivity
Lower foreign direct investment will have negative implications for growth of the capital stock, which will hold back productivity growth directly. However, labour productivity developments in the UK can be affected by Brexit via other channels as well. Lower foreign direct investment in Research & Development could have negative implications for domestic innovative capacity. Moreover, it is well known that international knowledge developed abroad has a larger impact on domestic productivity if a country is more open to either foreign tradeFootnote 5 or foreign direct investments.Footnote 6 The uncertainty surrounding the post-Brexit world has a major impact on the scientific community, which depends on long-term funding, cross-border mobility and international collaboration. Stricter migration policies and a deterioration of the UK business climate could result in an exodus of highly-skilled immigrants as well, or at least a lower net inflow of migrants. Results from a survey conducted among 2,000 EU immigrants working in the UK show that 8 per cent of the respondents are planning to leave and 35 per cent are considering leaving.Footnote 7 In particular, younger, higher-paid and better qualified people are considering an exit from the UK, which increases the risk of a brain drain. Furthermore, openness to foreign trade fosters market competition, which stimulates firms to reduce their X-inefficiencies and increase efforts to innovate.Footnote 8 A key contribution of our work is to estimate the impact of Brexit on productivity, which will be discussed later in this study.
Mitigating factors
The British government does have policy options that may mitigate the negative effects of Brexit on the British investment climate. A reduction of corporate taxes could generate positive effects on private investment and could prevent companies from relocating their activities. The downside is that this reduction has to be compensated for somehow by raising taxes on other fronts, such as income tax. Without compensation, public debt ratios would rise even further than the worrisome levels seen since the Great Recession of 2008. Second, deregulation could benefit firms. Then again, the OECD (2016) states that regulation of both network industries and the labour market has already been the least restrictive among OECD countries, which limits the scope for improvement.
Another benefit for the UK is a reduced contribution to the EU budget. The UK contributes roughly £8 billion pounds on an annual basis and this is the largest net payment to the EU budget after Germany. In the case of a hard Brexit, the government will have £8 billion net budgetary savings. However, if the UK wants to keep access to the EU internal market, it will most likely have to keep contributing to the EU budget. Norway, for instance, is a member of the European Economic Area but still contributes marginally less than the UK (83 per cent of the UK contribution). Moreover, the UK also has to pay a financial settlement, the ‘Brexit bill’, which could be as large as €60 billion.
Another potential benefit for the UK from exiting the EU is that it can make separate trade agreements with countries outside the EU, such as the US and China. It is, however, quite uncertain whether the UK will be able to adopt the FTAs that the EU currently has with third parties or whether the country will have to build a completely new trade framework. In the latter case, the UK will have to enter into lengthy and tough negotiations. This also implies that before the instalment of new FTAs, trade costs with these ‘third countries’ will rise. UK trade with third countries that have an FTA with the EU represents 14 per cent of UK exports.Footnote 9 Besides, it is questionable whether the UK will be able to get a better trade deal with the US and China than it could with an entire trading block like the EU. The US has recently imposed a tariff of 219 per cent on British aircraft maker Bombardier. In addition, the US and, amongst others, Brazil and New Zealand, have filed a formal complaint at the WTO against a deal between the UK and EU to divide the agricultural quotas post-Brexit. When the WTO validates this objection the UK may be forced to open up the market for many agricultural products to foreign competition. These two examples illustrate that the UK may come off worst in a dispute with bigger trading partners.
Methodology, a two-step approach
In this study, we use a two-step approach to assess the economic impact in our scenarios. We combine calculations using NiGEM together with calculations using a UK productivity model developed by RaboResearch.
NiGEM
Using NiGEM for scenario analyses has three main benefits. First, the model allows us to assess the impact of several key variables in the short to medium term, such as exchange rate fluctuations, trade flows, foreign direct investment and the labour market. Second, NiGEM ensures that the global trade flows are viewed within a closed accounting setting. Thus, trade flows between countries add up to global trade and possible trade or economic shocks, such as a Brexit, are accounted for via the global world trade matrix. Third, NiGEM is an error correction model (ECM), which ensures that short-term deviations of GDP from a country's growth potential are made up eventually. We use the expanded tariff version of NiGEM.
Endogenous productivity
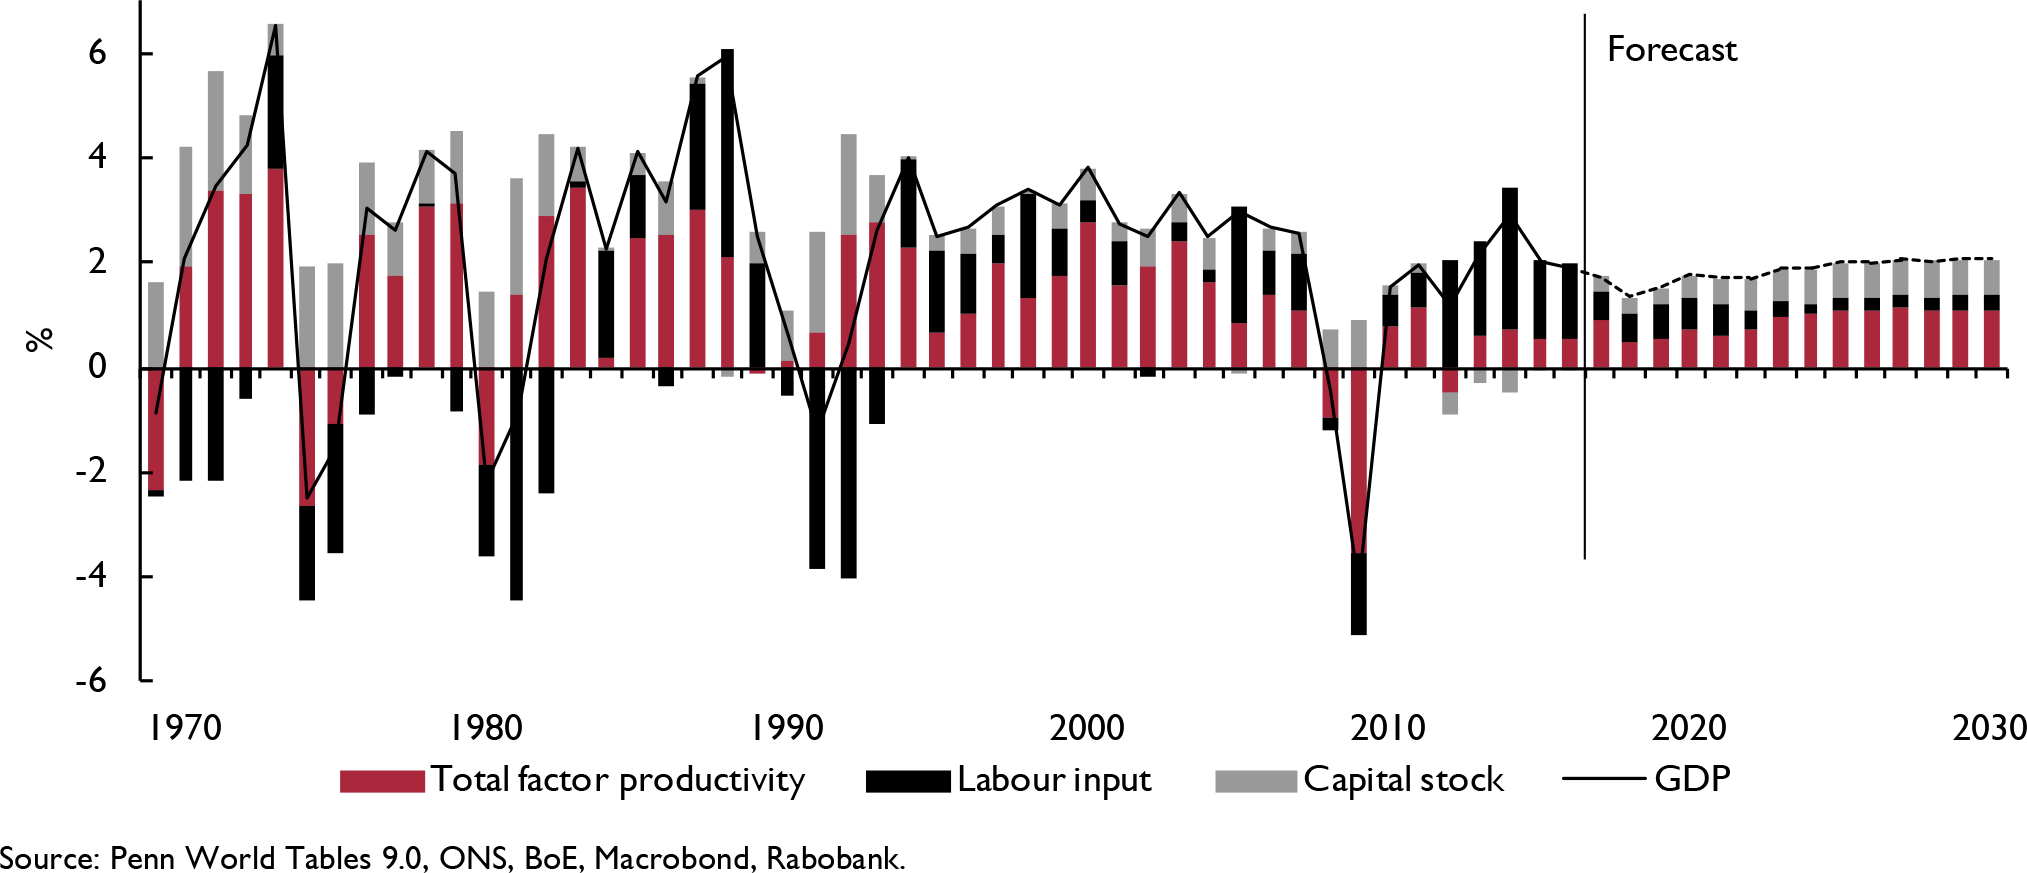
NiGEM has its merits for conducting scenario analyses, but a major impediment is that long-term effects via an important channel of productivity are disregarded, that is, labour-augmented technological change. This variable (UKTECHL) is more or less exogenous in NiGEM. This impediment applies to many macroeconometric models, which explains why HM Treasury (2016), OECD (2016) and CPB (2016) adopt exogenously-imposed TFP effects. We are also forced to use this workaround to assess dynamic productivity effects in the tariff model of NiGEM. However, we do assess these productivity effects endogenously, for which we have developed a dynamic productivity model. This model specifically applies to the UK, based on almost half a century of macro data. A full overview of technicalities on this model can be found in Reference Erken, Hayat, Heijmerikx, Prins and de VreedeErken et al. (2017). It is highly important to take stock of productivity effects properly, as labour productivity has been the key pillar of increasing wealth in the UK historically (figure 3). In our productivity model, we are able to explain 75 per cent of the variance in total factor productivity growth over the period 1969–2016. Factors that have been included are: domestic R&D capital, technological catching-up interacted with openness of the economy, human capital, the impact of the business cycle, hours worked per person employed, labour participation, openness, the corporate tax level and entrepreneurship.
GDP growth in Bremain scenario
Source: Penn World Tables 9.0, ONS, BoE, Macrobond, Rabobank.

We have adopted the framework used by Reference Erken, Donselaar and ThurikErken et al. (2016), where we adopt a flexible output elasticity of capital in the traditional growth accounting methodology developed by Robert Reference SolowSolow (1957). Under the neoclassical conditions of perfect competition in product markets and constant returns to scale in the production factors of capital and labour, the marginal products of capital and labour are equal to the return on capital and the wage rate, respectively. It can be derived that, in that case, the output elasticities of capital and labour are equal to the shares of capital income and labour income in total factor income. The annual growth of TFP can then be calculated as follows:

where Y denotes gross domestic product, K and L denote (physical) capital input and labour (measured in physical units such as hours worked) and ωK is the share of capital income in total factor income, or stated differently, the share of capital income in the gross domestic product. From (1), we can define the following TFP model for the UK:

where t is year and log represents the natural log. In the equation, α1 measures the effect of growth of domestic R&D capital (S) on TFP growth. The term α2 is the effect of our knowledge catching-up variable (CU), which picks up the effect of the technological distance of the UK from the technological leader (i.e. the US). The term α3 measures the impact of human capital and α4 is the effect of our business cycle indicator.
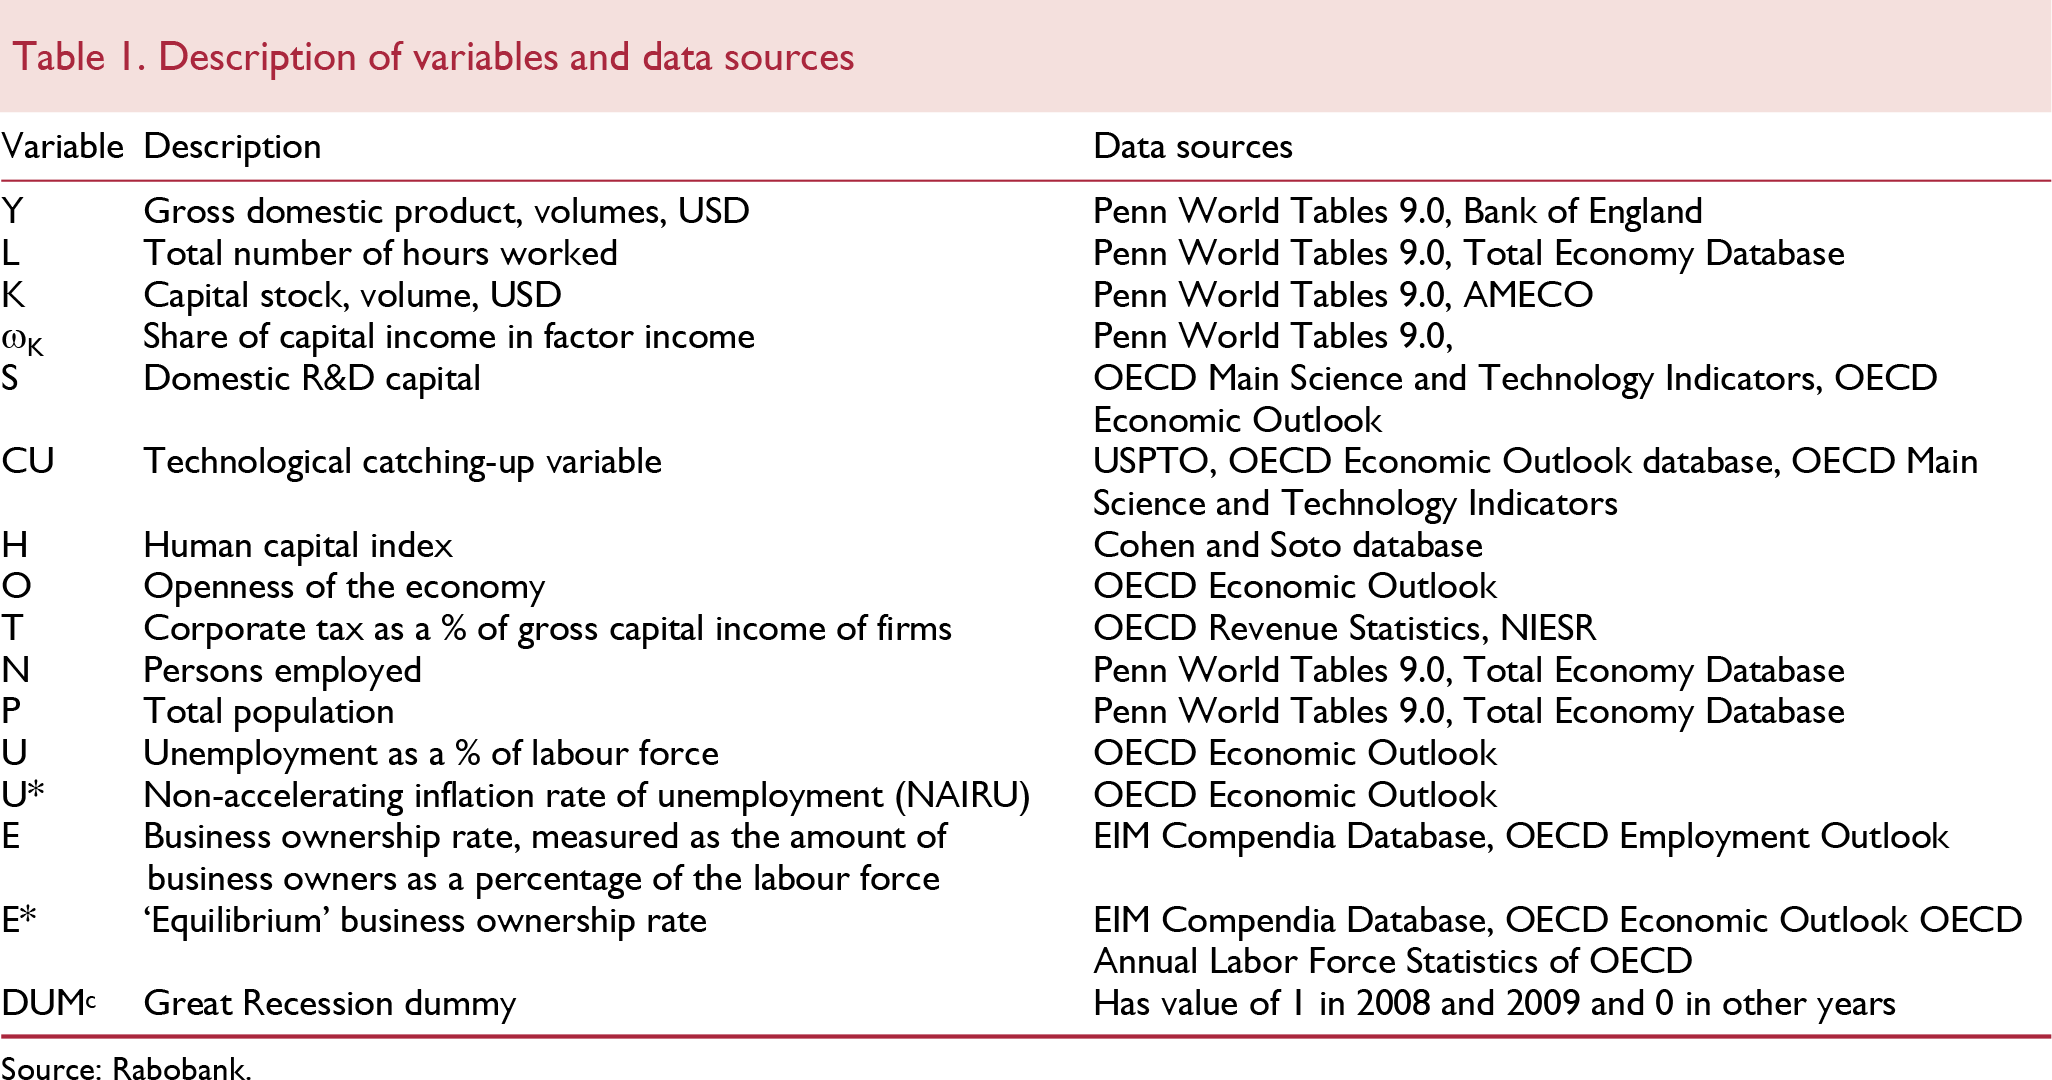
Term α5 measures the effect of the amount of hours worked (L) per person employed (N). Term α6 measures the effect of the participation rate measured as the number of persons employed (N) as a share of the total population (P). Term α7 measures the effect of the openness of the economy, which is based on trade exposure encompassing a weighted average of export intensity and import penetration, see Reference Bassanini, Scarpetta and HemmingsBassanini et al. (2001).Footnote 10 We use calculations by Reference DonselaarDonselaar (2011) to adjust trade exposure for country size, as small economies are by definition more exposed to foreign trade, regardless of their trade policy or competitiveness. Term α8 measures the corporate tax level as a per cent of total business capital income. Finally, α9 measures entrepreneurship and α10 is a dummy to take into account the extreme effects of the Great Recession in 2008 and 2009. Table 1 sums up the description of all individual variables in equation (2) and their data sources. For technicalities on variable construction, we refer to Reference ErkenErken (2008), Reference DonselaarDonselaar (2011) and Reference Erken, Donselaar and ThurikErken et al. (2016).
Econometrics and estimation results
We take first differences of variables to prevent the danger of spurious regression results when estimating relations between trended variables (Reference WooldridgeWooldridge 2003, p. 615). In our model, there are several trended variables, including TFP. We use several indicators to obtain the optimal lag structure to enhance the quality of our models: the Akaike info criterion, the Schwarz criterion and Hannan-Quinn criterion.
Our base estimation is illustrated in column (1) of table 2 and consists of domestic R&D capital, technological catching-up and human capital. If we add labour input variables in column (2), domestic R&D capital becomes statistically significant, but for the catching-up this is no longer the case. The labour input variables show the expected negative signs and coefficients in line with general findings in the literature. Moreover, the business cycle variable also seems to be important in explaining TFP growth. All in all, the explanatory power of our second model improves drastically: from 11 per cent to 43 per cent and the magnitude of the coefficients from the base model remain fairly stable.

As our catching-up variable is not significant in the second model, we add our openness variables in column (3), which might serve as a better mechanism to pick up the effect of international knowledge spillovers on TFP growth. The openness variable does indeed seem to be important and even eats away some of the already low explanatory power of our catching-up variable. We choose to lag the variable hours worked by two years, as this improved the fit of our model markedly. In column (4), we estimate the most complete model. Although the fit improves even more to 72 per cent, catching-up and entrepreneurship have counter-intuitive signs, but are statistically insignificant anyway. The other variables have very significant and correct signs. If we remove the insignificant effects from our model in column (5), the TFP model again shows robust stable effects for all variables included. In column (6), we interact our catching-up variable with our openness variable, lagged one year. Although this model still does not produce a statistically significant effect of the catching-up, the sign is correct and the magnitude of the human capital variable is again in line with the other estimated models.
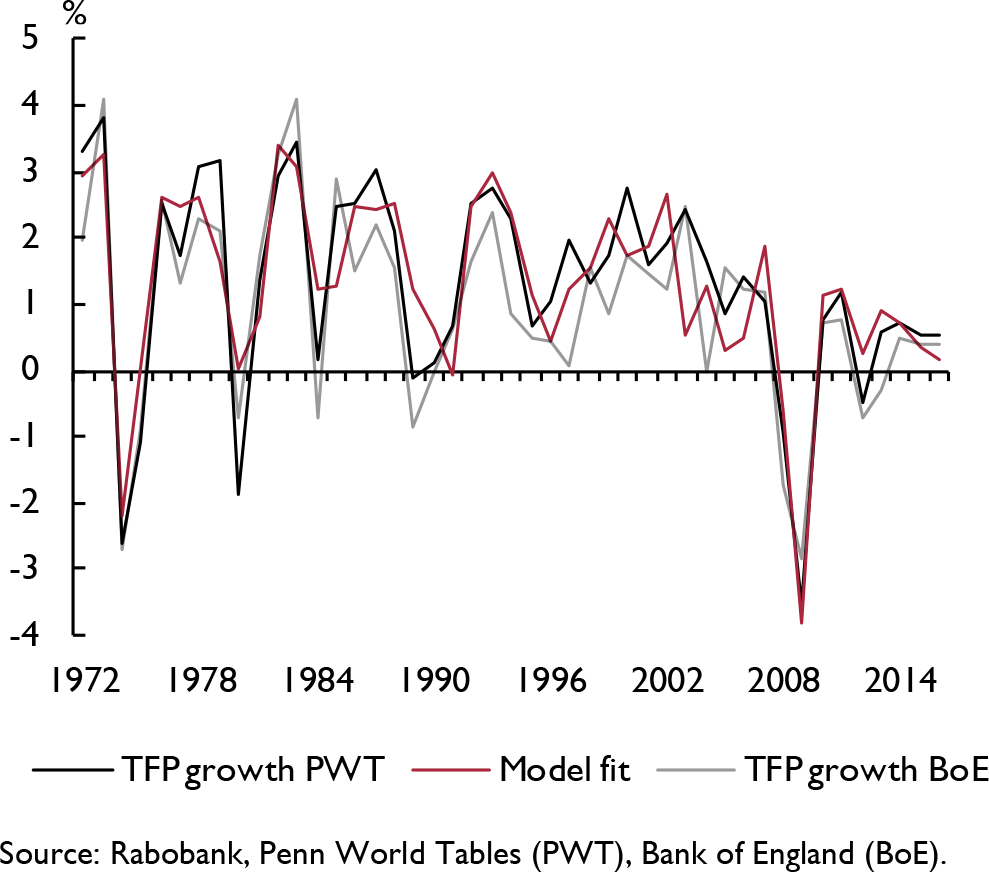
As a robustness check, we use TFP growth figures produced by the Bank of England as a substitute for our own TFP growth figures. The estimation of this model is illustrated in column (7). The BoE model also shows convincing and significant effects of domestic R&D capital, hours worked and openness. The human capital variable is also significant but the coefficient is lower than our estimated models. Similarly, the BoE model refuses to show a significant effect of catching up. Moreover, the business cycle effect and labour participation are insignificant as well. All in all, as a robustness check, the BoE model produces quite robust results compared to our model estimates. Ultimately we choose to use the model depicted in column (6) to run our Brexit scenarios, which has a solid fit (figure 4).
Rabobank TFP model has a solid fit
Source: Rabobank, Penn World Tables (PWT), Bank of England (BoE).

Three exit scenarios plus ‘Bremain’
Broadly speaking, there are three scenarios conceivable for the future trade relationship between the EU and the UK, when outside the EU.
1. ‘Soft’ Brexit: The UK remains fully part of the European Single Market and trade costs will only result from non-tariff barriers, since the UK does leave the Customs Union.
2. Bilateral Free Trade Agreement (FTA): the tariffs on products are expected to remain zero, but the increase in non-tariff barriers will be larger than in the soft scenario. Services will no longer be able to move freely.
3. ‘Hard’ Brexit: negotiations between the EU and the UK break down in this scenario and the UK leaves the EU without any trade agreement. The WTO agreements will form the basis of the hard Brexit scenario. It is assumed that the UK will be able to copy the EU's WTO schemes for tariffs and quotas.
We compare these scenarios against the alternative of ‘Bremain’: If the weakness in the British economy continues and the purchasing power of British households is further eroded, the British population may still rethink its decision to leave the EU. Via a second referendum or new elections a Brexit could be averted. We use this ‘Bremain’ scenario as our benchmark scenario, as it lends itself better to a comparison of the damage of the Brexit scenarios.
Although a transition period after Brexit is likely, it is still uncertain whether such a period will set in, and if so, on what terms. Therefore, we have not included a transition period in our analysis. A full overview of all assumptions and technicalities can be found in Reference Erken, Hayat, Heijmerikx, Prins and de VreedeErken et al. (2017).
Results: economic impact on the UK
Economic growth
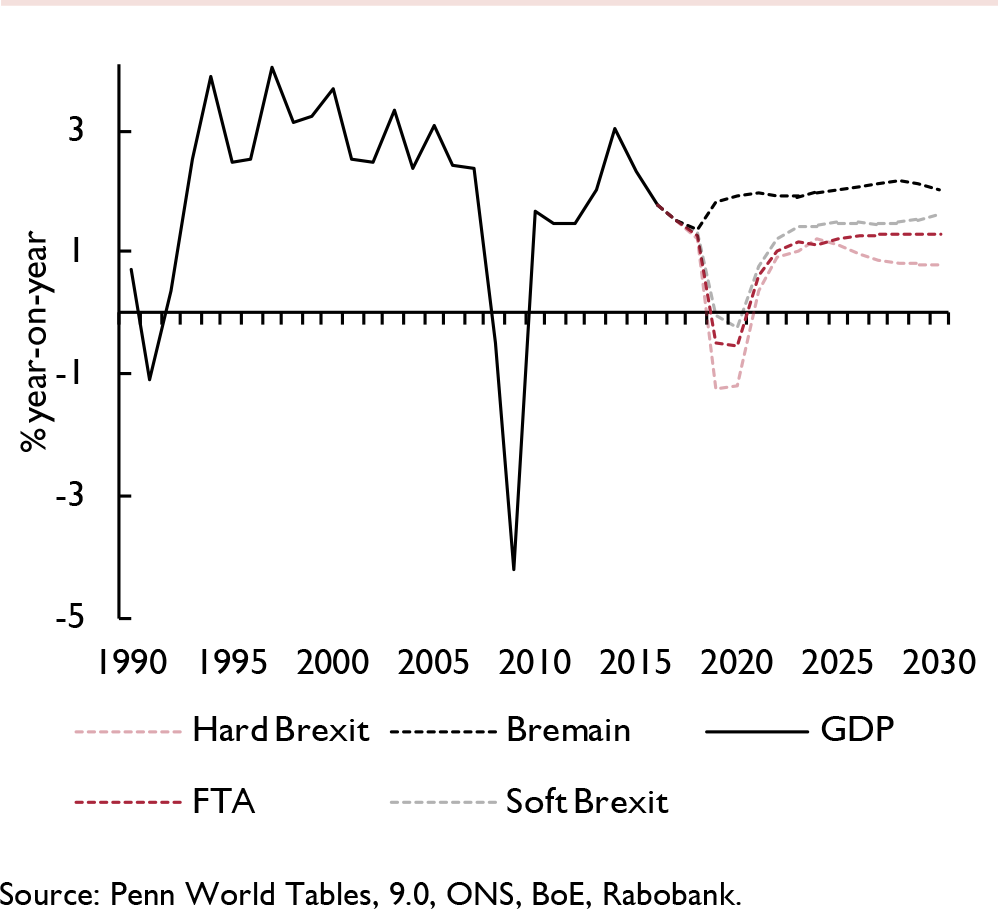
In all three Brexit scenarios, the UK ends up in a two-year recession right after Brexit has materialised in 2019. The magnitude of the recession varies considerably in the scenarios, with a GDP decline over two years of 2.4 per cent in a hard Brexit scenario, 1.1 per cent in the FTA scenario and 0.3 per cent in a soft Brexit scenario. Although recovery sets in after the initial shock, growth remains below potential over a long period of time. In the hard Brexit and FTA scenarios there is still a substantial output gap even in 2030. Our results are much larger than most existing studies.
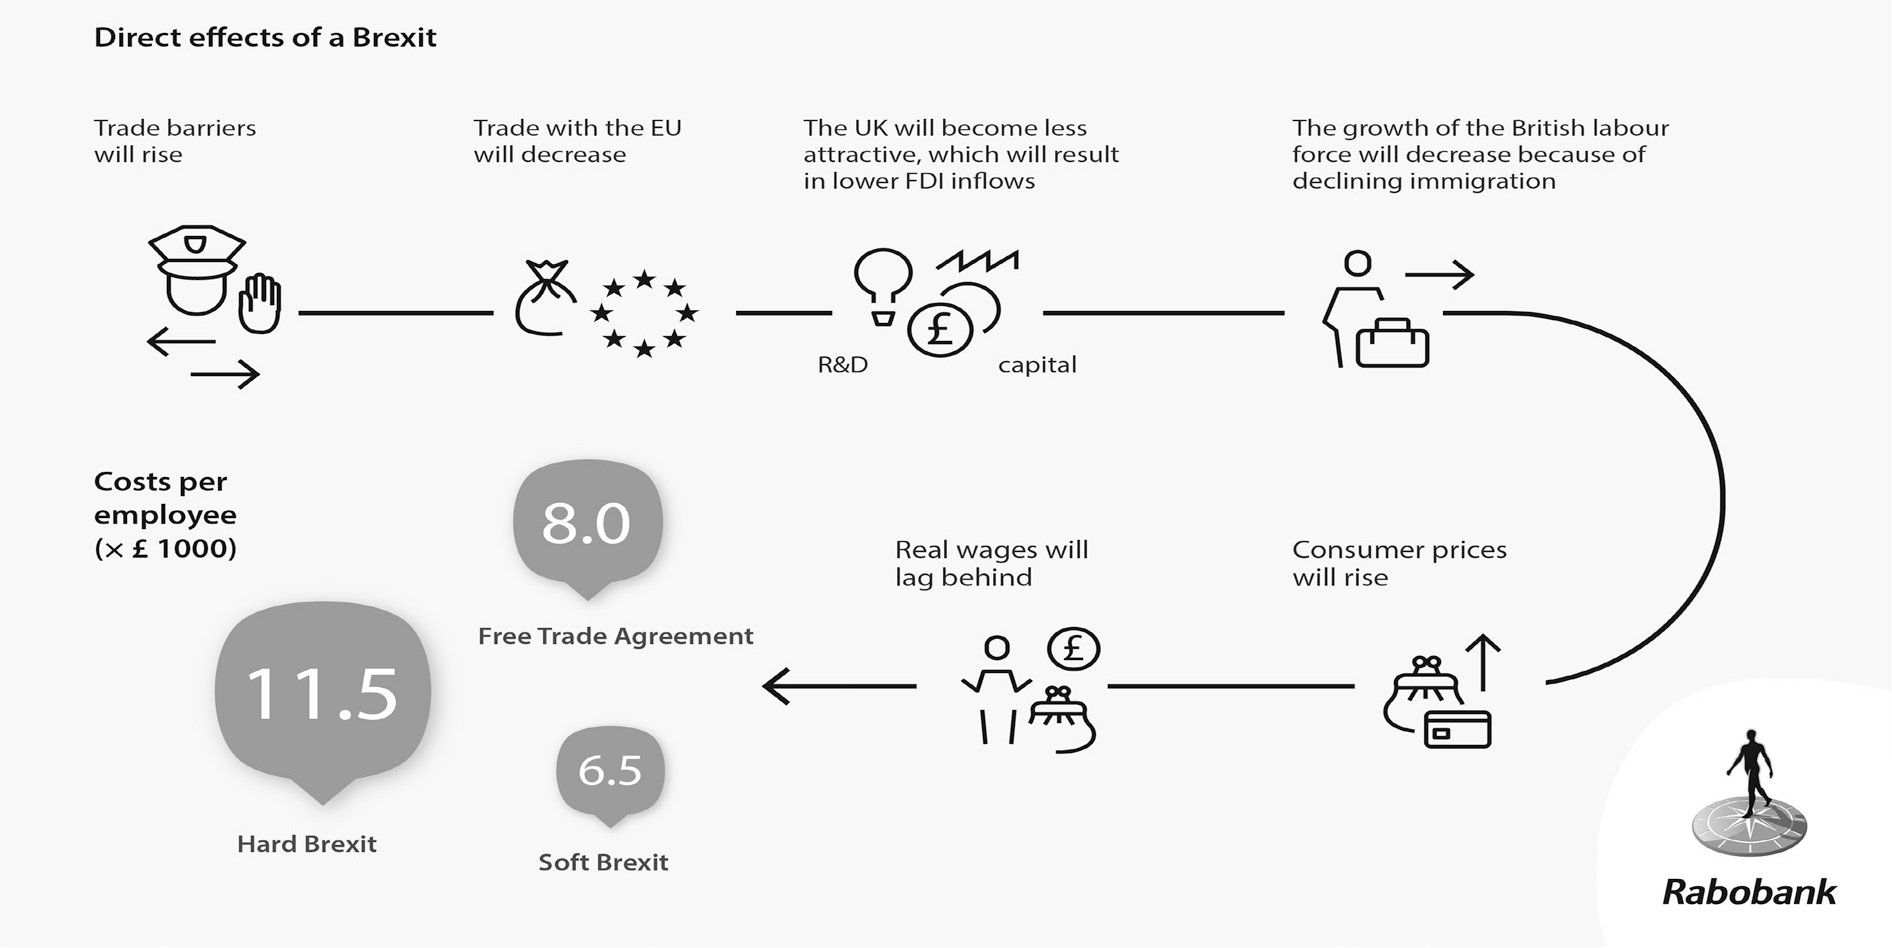
Ultimately, a hard Brexit will cost the UK 18 per cent of cumulative GDP growth by 2030, compared to a situation where the UK would continue its EU membership. In absolute terms, this comes down to £400 billion by 2030, which is equal to £11,500 per British worker. A FTA and soft Brexit will cause less harm but will still cost the UK economy roughly 12.5 per cent and 10 per cent of cumulative GDP growth by 2030, respectively. This is equal to £9,500 (FTA) and £7,500 (soft Brexit) per British worker.
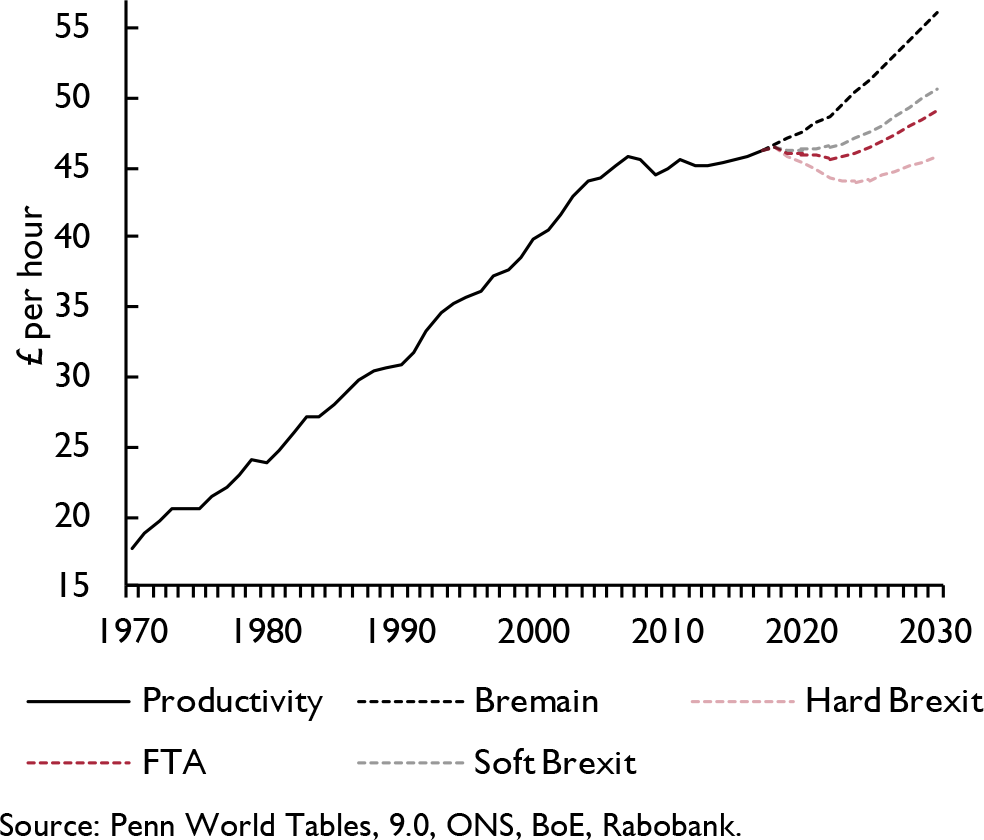
Annual potential output is affected by Brexit as well (table 3). In the hard Brexit scenario, potential output in 2030 amounts to a growth rate of 1.3 per cent, compared to a potential growth of 2.1 per cent in our Bremain scenario. The FTA and soft Brexit scenarios both show a potential growth of 1.6 per cent in 2030. In all three Brexit scenarios, the factor holding back potential growth the most is lower productivity growth (figure 6). In the Bremain scenario labour productivity in 2030 is £56 per hour, whereas in our hard Brexit this is roughly ten pounds per hour lower (£46 per hour).
Brexit effects on GDP growth
Source: Penn World Tables, 9.0, ONS, BoE, Rabobank.

Brexit effects on labour productivity
Source: Penn World Tables, 9.0, ONS, BoE, Rabobank.


The slowdown in productivity is caused in particular by lower total factor productivity (TFP).Footnote 11 Compared to the Bremain scenario, TFP drops from 1.1 per cent to 0.5 per cent in the hard Brexit scenario (table 1). The slowdown in TFP is caused by a slowdown in growth of domestic R&D capital, less openness of the economy which is an impediment to benefitting from knowledge spillovers from abroad and at the same time lower competitive pressure domestically. Finally, TFP in all three Brexit scenarios slows due to various labour market frictions (Reference Erken, Hayat, Heijmerikx, Prins and de VreedeErken et al., 2017). In the FTA and hard Brexit scenarios, the amount of hours worked by people decreases less than in our Bremain scenario, as people try to compensate for a loss of wealth by working more hours. The downside of working more hours is that it holds back productivity gains as well. This explains why the contribution of structural labour input is higher in our most pessimistic scenarios (i.e. FTA and hard Brexit). Finally, the contribution of growth of the capital stock per unit of labour is lower in the Brexit scenario, due to lower foreign direct investment.
Trade and prices
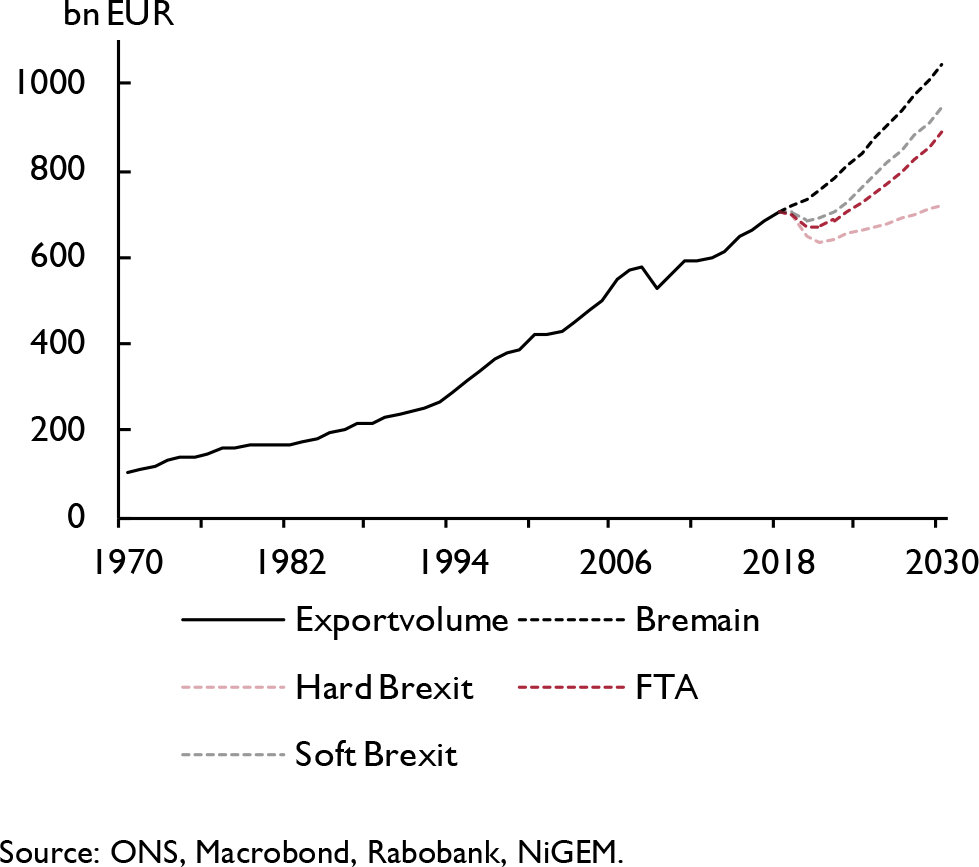
Trade volumes are determined endogenously in the model by adjusted import and export prices and trade shares. The trade volumes deviate substantially in our three Brexit scenarios, with hard Brexit export volumes in 2030 about 30 per cent lower than in our Bremain scenario and 15 per cent and 10 per cent lower in our FTA and soft Brexit scenarios, respectively. Import volumes are 27 per cent (hard), 23 per cent (FTA) and 16 per cent (soft) lower compared with our Bremain scenario. The slowdown in trade in all three scenarios is the result of higher trade barriers between the EU and the UK in the post-Brexit era. Due to imposed tariff and non-tariff barriers between the EU and the UK, export and import prices in the UK rise steeply. Export and import prices in the hard Brexit scenario are determined endogenously in the model and are 25 per cent higher than in our Bremain scenario. Export prices in the FTA and soft Brexit scenarios are roughly 20 per cent higher, whereas import prices are 14 per cent higher.
The fact that trade prices in both FTA and soft Brexit are roughly equal immediately shows that non-tariff barriers are far more important in determining the prices of future trade with Europe than direct tariffs. The consequence of the higher import prices is that it generates cost-push inflation, which will prop up inflation and weigh on domestic consumption and GDP. Moreover, higher inflation will result in nominal wage increases, which will boost unit total costs of manufacturing firms operating in the UK. This is detrimental to firm competitiveness, which will result in lower export market shares of British firms.
Labour market
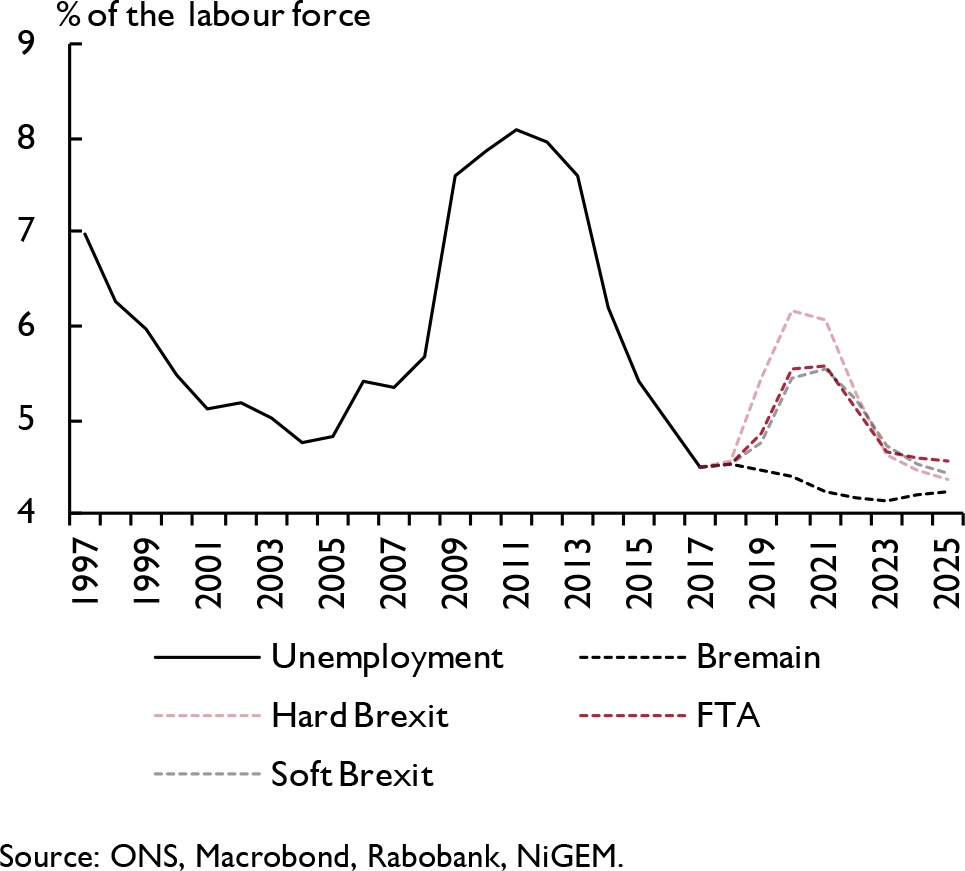
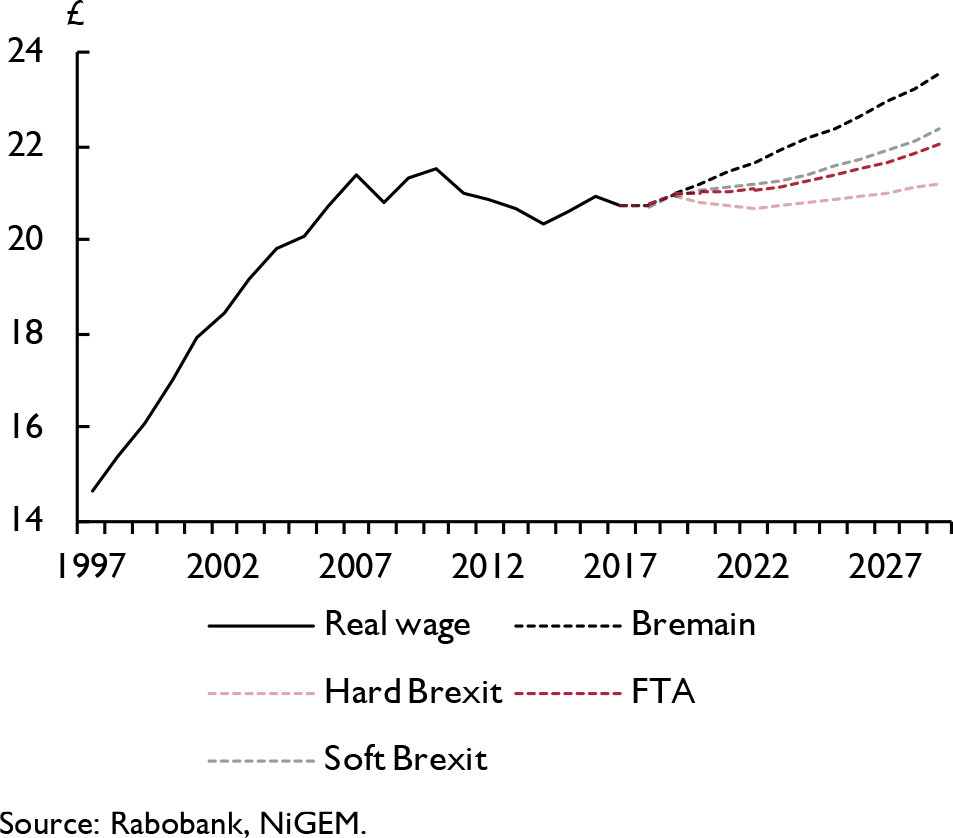
In our scenarios the labour damage will be limited in the UK, due to very flexible labour market institutions. Hence, there is no indication that a Brexit in any form will result in higher structural unemployment. Cyclical unemployment will rise in our scenarios, with a hard Brexit causing a jump from 4.6 per cent in 2018 to 6.2 per cent in 2020, whereas in our Bremain scenario, unemployment is stable, hovering just above 4 per cent (figure 8). Unemployment rates decline quite rapidly in all three scenarios. As stated, the UK labour market is quite flexible, which means deviations from structural unemployment are not persistent. Furthermore, labour-augmented technological change is growing at a slower pace in all three of our Brexit scenarios, which implies that technology will shred less jobs compared to our Bremain scenario. Finally, real wages grow less rapidly than in our Bremain scenario (and even decline slightly in the hard Brexit scenario), which is beneficial to employment growth, but weighs on private consumption (figure 9).
Brexit effects on export volumes
Source: ONS, Macrobond, Rabobank, NiGEM.

Brexit effects on unemployment
Source: ONS, Macrobond, Rabobank, NiGEM.

Brexit effects on real wage growth
Source: Rabobank, NiGEM.

Britain's exit from the EU comes at a cost

Conclusion
In this study, we evaluate the effects of a Brexit in three different scenarios: 1) a hard Brexit scenario in which negotiations between the UK and the EU fail and do not lead to a new trade agreement, 2) a free-trade agreement equivalent to the agreement that for instance Switzerland has with the EU, and 3) a soft Brexit scenario where the UK remains part of the European internal market, but exits the Customs Union. Our results show that the economic costs of a Brexit are substantial. In 2030, UK output is estimated to be lower than in a Bremain scenario by £400 billion (hard Brexit) and £260 billion (soft Brexit). This translates to £11,500–£7,500 per British worker in 2030.
We deviate strongly from previous studies in our approach and assumptions and find much higher costs associated with the Brexit scenario. This can be attributed to differences in methodology. First, we use an improved tariff version of macroeconometric model NiGEM, which enables us to assess better the negative impact of cost-push inflation resulting from imposed trade barriers between the UK and the EU. Second, we estimate a unique productivity model for the UK, which allows us to gauge adequately the UK-specific effects on productivity caused by Brexit. In this sense, we follow-up on criticism by Reference Dhingra, Ottoviano, Sampson and van ReenenDhingra et al. (2016), who state that HM Treasury has been too careful in its assumptions with respect to trade, FDI and productivity.
Lastly, we want to note that scenario analyses are always subject to a large degree of uncertainty. Despite this, we believe that the estimated economic impact of a Brexit will be severe in any case, as even in a soft Brexit scenario the associated costs for the UK are substantial.