Introduction
The DSM-IV diagnostic criteria for major depressive disorder (MDD) encapsulate a group of heterogeneous conditions that include psychotic/melancholic depression, reactive depression and personality-based depression (Parker, Reference Parker2000). Thus, it follows that multiple aetiological factors probably contribute to the pathogenesis of MDD. Although psychological and social factors are clearly relevant to MDD, neurobiological abnormalities, either secondary to such factors or operating as causal influences (‘endophenotypes’), also have a role. However, for such knowledge to contribute to the clinical definition of MDD, consensus as to the abnormalities that are most common is needed.
Magnetic resonance imaging (MRI) has been widely used to examine neurobiological correlates of MDD and has provided converging evidence in support of prevailing pathophysiological models of this disorder (Mayberg et al. Reference Mayberg1997; Drevets et al. Reference Drevets, Price and Furey2008; Marchand, Reference Marchand2010; Marchand & Yurgelun-Todd, Reference Marchand and Yurgelun-Todd2010; Pizzagalli, Reference Pizzagalli2011). According to these models, the characteristic clinical symptoms and associated cognitive deficits of MDD may arise, in part, through the corresponding dysfunction of cortico-striatal-pallidal-thalamic (CSPT) brain circuits. These circuits are composed of distributed neuroanatomical loops that connect subregions of the prefrontal cortex (PFC) and the anterior cingulate cortex (ACC), in particular, with the basal ganglia and thalamus in a highly organized and integrated manner to support diverse motor, cognitive and emotional processes (Alexander et al. Reference Alexander, DeLong and Strick1986, Reference Alexander, Crutcher and DeLong1990; Haber & Calzavara, Reference Haber and Calzavara2009). In MDD patients, structural MRI studies indicate that significant volumetric alterations of CSPT regions are common in this disorder, a general observation that is substantiated by other neuropsychological and functional neuroimaging evidence (Rogers et al. Reference Rogers, Bradshaw, Pantelis and Phillips1998; Marchand & Yurgelun-Todd, Reference Marchand and Yurgelun-Todd2010). Neurodegenerative and vascular conditions affecting CSPT regions have been associated with an increased prevalence of depression (Lauterbach et al. Reference Lauterbach, Cummings, Duffy, Coffey, Kaufer, Lovell, Malloy, Reeve, Royall, Rummans and Salloway1998; Marchand, Reference Marchand2010; Walterfang et al. Reference Walterfang, Evans, Looi, Jung, Danek, Walker and Velakoulis2011), and late-onset depression (LOD) has also been associated with vascular abnormalities in CSPT regions (Herrmann et al. Reference Herrmann, Le Masurier and Ebmeier2008). Therefore, it is likely that volumetric changes in CSPT, despite having different neurobiological causes, might be one of the common markers of MDD. However, the precise nature of these regional volumetric changes in MDD patients has varied between studies, meaning that a consensus view of such CSPT alterations has yet to be reached.
The substantial clinical heterogeneity of MDD and the different characteristics of patients included in imaging studies, such as differences in age of onset and duration of illness, makes it difficult to form a common description of CSPT volumetric changes in MDD. In this regard, meta-analytical techniques can help to overcome some of these issues. Although several meta-analyses have examined various brain regions affected by MDD (Campbell et al. Reference Campbell, Marriott, Nahmias and MacQueen2004; Hajek et al. Reference Hajek, Kozeny, Kopecek, Alda and Höschl2008; Hamilton et al. Reference Hamilton, Siemer and Gotlib2008), only one has included most of the regions that encompass the CSPT circuits (Koolschijn et al. Reference Koolschijn, van Haren, Lensvelt-Mulders, Hulshoff Pol and Kahn2009). That study found volume reductions in the frontal lobes, especially in the anterior cingulate cortex (ACC) and the orbitofrontal cortex (OFC), and moderate volume reductions in the caudate and putamen. However, the study did not examine the effect of factors such as late-life depression (LLD) or antidepressant use on the observed findings. The effects of depression that starts later in life (geriatric depression) should be considered because a later onset of depression has been associated with more severe cognitive deficits and structural MRI abnormalities (Schweitzer et al. Reference Schweitzer, Tuckwell, Ames and O'Brien2001; Herrmann et al. Reference Herrmann, Goodwin and Ebmeier2007, Reference Herrmann, Le Masurier and Ebmeier2008). In addition, antidepressant treatment might influence volumetric findings in MDD as antidepressant-using patients have been reported to have larger OFC volumes compared to medication-naive patients (Lavretsky et al. Reference Lavretsky, Roybal, Ballmaier, Toga and Kumar2005).
In this work, we systematically reviewed the evidence for volumetric abnormalities in CSPT regions in MDD patients. This was achieved by using a meta-analytical method suitable for the analysis of published structural MRI studies. We also performed meta-regression and subgroup analyses to test the influence of confounding factors on the patterns of CSPT alterations described in the literature; namely age, gender, duration, medication and current severity of illness.
Method
Study selection
Meta-analyses were conducted according to the Preferred Reporting Items for Systematic Reviews and Meta-Analyses (PRISMA) guidelines (Moher et al. Reference Moher, Liberati, Tetzlaff and Altman2009). Potential articles were identified by a comprehensive literature search in PubMed, Scopus and PsycINFO in the period from January 1980 to December 2010. The following keywords were used: major depression, major depressive disorder, MRI. The reference lists of identified published studies were also cross-checked for additional studies. Studies were included if they: (1) compared an MDD sample to a healthy control group using a region-of-interest (ROI) approach; (2) reported sufficient data to calculate effect sizes (means and standard deviations or standard errors); and (3) examined ROIs in the PFC, ACC, caudate, putamen, thalamus or globus pallidus. Regions were only included in meta-analytical calculations if there were at least four studies available for each ROI.
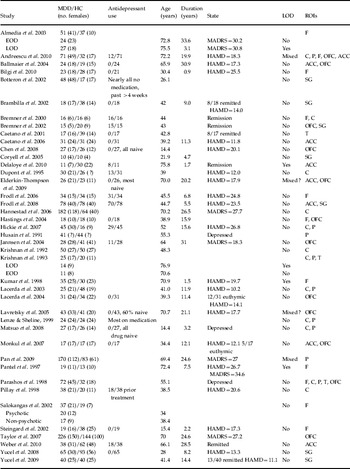
Studies that examined physical illness and depression co-morbidity were excluded. For those studies that examined the same ROI with overlapping samples, the study with the largest sample size was included. Overlapping samples were only included if they examined different ROIs. The flowchart shown in the online supplementary figure (Fig. S1) summarizes the study inclusion process. Data from three studies (Bremner et al. Reference Bremner, Vythilingam, Vermetten, Nazeer, Adil, Khan, Staib and Charney2002; Yucel et al. Reference Yucel, McKinnon, Chahal, Taylor, Macdonald, Joffe and MacQueen2008, Reference Yucel, McKinnon, Chahal, Taylor, Macdonald, Joffe and MacQueen2009) were not included in the meta-analysis of the ACC because the reported ROIs were limited to only part of this structure. There was an insufficient number of studies of the globus pallidus volume. The OFC (in the PFC) and subgenual ACC were the only subregions for which there were sufficient numbers of studies to be included in the meta-analysis. Forty-one studies comparing patients with MDD and healthy controls were included in the final meta-analysis (Table 1). Although previous ROI meta-analyses in MDD have reported their sample sizes of patients and controls by summing the sample sizes of the studies included (1845 patients versus 1527 controls in our analysis), this is misleading because different ROIs were examined using the same or overlapping samples. In the analysis, the ranges for numbers of patients included for each region were 185–605 for MDD patients and 129–453 for healthy controls.
Characteristics of the studies included in the meta-analysis

MDD, Major depressive disorder; HC, healthy control; LOD, late-onset depression; EOD, early-onset depression; ROI, region of interest; ACC, anterior cingulated cortex; F, prefrontal cortex; P, putamen; SG, subgenual ACC; OFC, orbitofrontal cortex; C, caudate; T, thalamus; HAMD, Hamilton Depression Rating Scale; MADRS, Montgomery–Asberg Depression Rating Scale.
Statistical analysis
For each ROI an effect size (Cohen's d) and a standard error were calculated based on the reported means and standard deviations of volumetric change. In the event that standard errors were reported, these were converted to standard deviations. A failure to do this in a previous meta-analysis that included a study by Botteron et al. (Reference Botteron, Raichle, Drevets, Heath and Todd2002) led to an exaggerated effect size estimate for the ACC region (Koolschijn et al. Reference Koolschijn, van Haren, Lensvelt-Mulders, Hulshoff Pol and Kahn2009). For preliminary analyses, separate effect sizes for grey matter (GM), white matter (WM) and left and right ROIs were also calculated. Effect sizes were weighted using the inverse variance method. We used a random effects model (DerSimonian–Laird estimate) because the distributions of effect sizes are likely to be heterogeneous.
The Q test was used to measure the heterogeneity of the distribution of effect sizes. When the Q test was significant, I 2, a measure of the degree of inconsistency in the studies' results, was used to quantify heterogeneity (Higgins & Thompson, Reference Higgins and Thompson2002). I 2 describes the percentage of total variation across studies that is due to heterogeneity rather than chance. I 2 values between 0 and 0.25 suggest small magnitudes of heterogeneity, I 2 values in the range 0.25–0.50 suggest medium magnitudes, and those >0.50 indicate large magnitudes. Publication bias was assessed by Egger's test and meta-analyses were performed using MIX software version 1.7 on a Windows platform (Bax et al. Reference Bax, Yu, Ikeda, Tsuruta and Moons2006).
We also calculated homogeneity statistics using Q bet to test for differences between LLD and early-onset depression (EOD), and between antidepressant-free [AD(−)] and medicated [AD(+)] groups. The LLD group comprised elderly subjects whose age of onset was in later life (onset after 50–65 years, depending on the study). In some studies, samples of both EOD and LLD patients were reported. These samples were analysed separately if they provide data for both groups. For studies that reported both EOD and LLD in elderly patients without providing separate data for each group, the study was classified as LLD. As studies did not report separate data for their antidepressant-free and medicated patients, studies in which more than 80% of the patients were not taking antidepressants were classified as AD(−).
Meta-regression analyses were used to estimate the impact of demographic (age, gender) and clinical (age at onset, duration of illness, severity of current depression) variables on between-group differences. Meta-regression analyses that are based on group rather than individual subject data were necessary because the vast majority of the individual studies did not report correlations with volumetric findings and these variables. The severity of current depression was based on reported Hamilton Depression Rating Scale (HAMD) and Montgomery Asberg Depression Rating Scale (MADRS) scores. For this analysis, studies were classified according to patient status, as euthymic (HAMD <7 or MADRS <10), mild (HAMD 8–15 or MADRS 11–18), moderate (HAMD 16–25 or MADRS 19–30) and severe (HAMD >25 or MADRS >30). Meta-regression analyses (weighted generalized least squares regressions) were conducted using SPSS version 11.0 (SPSS Inc., USA). Meta-regression analyses performed with a random effects model were conducted using the restricted-information maximum likelihood method with a significance level set at p<0.05.
Results
Volumetric differences between patients and controls
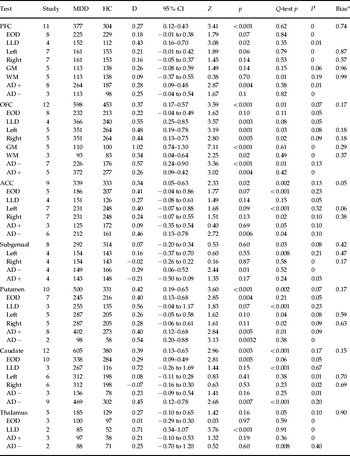
Across studies, significant volumetric reductions in MDD patients compared to healthy control subjects were consistently reported for the PFC (d=0.27), ACC (d=0.34), putamen (d=0.43) and caudate nucleus (d=0.39) but not for the thalamus (Table 2). In subregional analyses, the OFC volume was significantly reduced (d=0.37) but there was no significant volume reduction for subgenual ACC. The Q test and I 2 analyses did not suggest heterogeneity for the distribution of effects sizes of PFC volume. The Q test analyses were significant for all other regions that were found to be significantly volumetrically reduced in MDD patients; however, the magnitude of this apparent heterogeneity was small: ACC (I 2=0.13), OFC (I 2=0.05), putamen (I 2=0.09), caudate (I 2=0.17), subgenual ACC (I 2=0.09), and thalamus (I 2=0.1). There was no evidence for a publication bias for any of these significant ROIs.
Mean weighted effect sizes for ROI volume differences between MDD and healthy controls

ROI, Region of interest; MDD, major depressive disorder; HC, healthy control; D, effect size of between-group difference; CI, confidence interval; ACC, anterior cingulated cortex; PFC, prefrontal cortex; OFC, orbitofrontal cortex; GM, grey matter; WM, white matter; AD, antidepressant; LLD, late-life depression; EOD, early-onset depression.
a p value of Egger's test.
EOD v. LLD
It was possible to compare EOD and LLD for the ROIs in the PFC, OFC, ACC, putamen, caudate and thalamus. Volumetric reductions tended to be more pronounced in LLD patients in all regions except the ACC. However, the LLD–EOD difference only reached significance for the thalamic ROI (Q bet=8.48, p<0.05).
AD+ v. AD−
Antidepressant-free (AD−) patients had significantly smaller volumes compared to patients taking antidepressants (AD+) in the OFC (Q bet=4.51, p<0.05), ACC (Q bet=7.31, p<0.05) and subgenual ACC (Q bet=9.50, p<0.05). Unlike the previous analysis of all patients, AD− patients had significantly reduced subgenual ACC volumes compared to control subjects (d=0.29). Among these three regions, AD+ patients had significantly smaller volumes in the OFC compared to healthy controls. There was no significant effect of antidepressant use on PFC, caudate, putamen or thalamic ROI volumes.
Laterality effects
In general, the magnitude of effect sizes for right- and left-brain structures were similar. Only for the ACC (0.52 v. 0.32) and subgenual ACC ROIs (0.33 v. 0.17) did the volumetric reductions tend to be more severe in the left compared to the right hemispheres. However, the distribution of effect sizes was also more heterogeneous in the left ACC and subgenual ACC compared to the right hemisphere ROIs.
GM v. WM
It was possible to examine GM and WM separately for ROIs in the PFC and OFC. Reduction in GM volume was more pronounced than WM volume in the PFC (d=0.26 v. 0.09), and especially so in the OFC (d=1.02 v. 0.34).
Meta-regression analyses for other confounders
There were no significant effects of gender (female ratio of the patient group), age, age of illness onset, duration of illness or severity of current depression on any of the significant ROI volumetric differences reported between MDD patients and controls.
Discussion
Our meta-analytical review confirmed evidence of decreased regional brain volumes in the prefrontal, orbitofrontal and anterior cingulate cortices and basal ganglia structures in patients with MDD. Antidepressant use and LOD moderated these volume reductions in opposing directions, normalizing (or increasing) and reducing volumes respectively.
Primary findings
PFC volume reductions were associated with MDD. The PFC is a vast area of the brain and it is likely that only certain subregions are affected by depression. In our subregional analysis, OFC volume was significantly reduced in both hemispheres in MDD. The region has an important role in assessing the affective characteristics of stimuli (i.e. their reward value) and interacting with some limbic regions (i.e. the amygdala) (Holland & Gallagher, Reference Holland and Gallagher2004; Rolls, Reference Rolls2004). This is consistent with findings of post-mortem studies in MDD (Rajkowska et al. Reference Rajkowska, Miguel-Hidalgo and Wei1999). Other PFC subregions, which we were unable to examine in this meta-analysis, may also show volumetric abnormalities. For instance, previous post-mortem, functional imaging and voxel-based morphometry (VBM) studies have suggested that structural abnormalities in dorsolateral and dorsomedial PFC might also be associated with MDD (Rajkowska et al. Reference Rajkowska, Miguel-Hidalgo and Wei1999; Fitzgerald et al. Reference Fitzgerald, Laird, Maller and Daskalakis2008; Bora et al. Reference Bora, Fornito, Pantelis and Yucel2011).
Modest volume reduction of the ACC was associated with MDD, which is consistent with VBM studies (Bora et al. Reference Bora, Fornito, Pantelis and Yucel2011). The ACC comprises important subregions with putatively distinct roles, and can be subdivided into an ‘affective’ subdivision (pregenual and subgenual ACC) and a ‘cognitive-motor’ subdivision (dorsal ACC) (Mayberg et al. Reference Mayberg1997; Bush et al. Reference Bush, Luu and Posner2000; Yücel et al. Reference Yücel, Wood, Fornito, Riffkin, Velakoulis and Pantelis2003). Functional imaging studies have found that acute depression is associated with reduced activity in the dorsal ACC and increased activity in the subgenual ACC (Mayberg et al. Reference Mayberg1997; Pizzagalli, Reference Pizzagalli2011). In the model proposed by Mayberg et al. (Reference Mayberg1997), the pregenual ACC has an intermediate role between the subgenual ACC, which supports autonomic and interoceptive functions, and the dorsal ACC, which supports ‘higher-order’ goal-directed processes, and thus facilitates the interaction between emotional feeling states and cognition. In acute depression, hyperactivity of the pregenual ACC has been shown to predict better response to antidepressant treatment (Pizzagalli, Reference Pizzagalli2011). As a consequence of this functional segregation, it is reasonable to expect that MDD would be associated with volume reductions in specific subregions of the ACC. However, in this work we were only able to examine the subgenual ACC, which was not found to be associated with consistent volume reductions. This observation is in keeping with our recent meta-analysis of VBM studies, which found GM reductions in pregenual ACC and rostral regions of the dorsal ACC as the most robust finding in MDD. It is relevant to note that volumetric studies of the subgenual ACC have been markedly variable, and it seems that only certain subgroups of patients, such as those with familial MDD, may show consistent volumetric alteration of this region (Drevets et al. Reference Drevets, Ongür and Price1998). Medication also seems to be another important factor. Consistent with this idea, we observed that the subgenual ACC was significantly reduced in patients who were not being treated with antidepressant medications.
Secondary findings
There were significant volume reductions in the caudate nucleus and putamen in MDD patients, which might be consistent with evidence linking depressive symptomatology to neuropsychiatric disorders involving the caudate and putamen (Lauterbach et al. Reference Lauterbach, Cummings, Duffy, Coffey, Kaufer, Lovell, Malloy, Reeve, Royall, Rummans and Salloway1998; Marchand, Reference Marchand2010). The striatum has an important role in reward processing, and depressed patients have been reported to show decreased activation to rewarding stimuli. Decreased striatal volume may therefore reflect depressive symptoms such as psychomotor retardation and reduced hedonic drive. The globus pallidus and thalamus, which complete the CSPT circuit, have not been assessed in as much detail in volumetric studies of MDD patients; indeed, we were unable to examine the globus pallidus region because of a lack of sufficient studies. The number of studies that examined the thalamus was also small, and there were no significant differences between MDD and healthy controls for this structure. However, it is possible that examining the thalamus as a whole might be insensitive to changes in relevant subregions because only some parts of the thalamus are expected to play a role in the experience of affect.
Some of these regions, including the striatum and the OFC, are strongly interconnected and have been reported to show increased activation in depression (Drevets et al. Reference Drevets, Price and Furey2008). The relationship between these volume losses and functional changes is unclear. It is possible that volume loss occurs as a result of neuroplastic responses mediated by excitotoxicity and inflammatory cytokines, or that it is related to compensatory changes associated with functional changes in connected regions. It was of interest to test whether observed volume reductions corresponded to specific GM or WM abnormalities, although not many studies reported these separately. Accordingly, it was only possible to calculate separate effect sizes for the prefrontal and orbitofrontal cortex regions. In both regions, but especially the OFC, GM volume reduction was significantly more pronounced. However, more studies are needed to show whether GM or WM volume reductions (or both) lead to the observed volume reductions in the PFC and ACC.
Heterogeneity and moderating influences
Although this meta-analysis found an association between MDD and volume reductions in fronto-subcortical structures, the effects were fairly small (d=0.27–0.42) and suggested an estimated 70–80% overlap between MDD patients and healthy controls. Together with the heterogeneity of the findings, this suggests that only a subgroup of patients with MDD have structural abnormalities within CSPT regions. It could be argued that volumetric methods are not sensitive enough to reveal subtle microstructural abnormalities in the GM and WM of these structures, and more sensitive methods such as magnetization transfer imaging (MTI) or diffusion tensor imaging (DTI) should be used. The clinical heterogeneity of MDD is another factor that helps to explain these findings because volume abnormalities within CSPT regions might only be related to certain subgroups of MDD. Most published MRI studies have not considered the heterogeneity of the condition, and in this meta-analysis it was not possible to examine the effects of psychosis, melancholia, bipolarity or family history on observed structural abnormalities in CSPT circuits. However, we were able to examine the effects of LLD and medication status on volume reductions in CSPT regions.
Although the small number of studies with late-onset MDD limited the power of these analyses, late-life MDD was associated, in general, with more pronounced volume reductions in most of the frontal and subcortical structures that were examined, and in the thalamus the between-group difference reached significance. Moreover, EOD was only significantly associated with volume reductions of the ACC, caudate and putamen. For the prefrontal and orbitofrontal cortices, the volume reductions (d=0.18–0.22, 83–86% overlap with the controls) fell short of statistical significance. A higher percentage of patients with late-life MDD are likely to have volume reductions in CSPT structures (d=0.71–0.72, 56% overlap with controls in the caudate and thalamus). This is consistent with the more severe cognitive deficits observed in these patients (Herrmann et al. Reference Herrmann, Goodwin and Ebmeier2007). Vascular changes in WM have also been shown to be associated with LLD (Herrmann et al. Reference Herrmann, Le Masurier and Ebmeier2008) and these abnormalities are associated with volume reductions in CSPT regions (Taylor et al. Reference Taylor, Macfall, Payne, McQuoid, Steffens, Provenzale and Krishnan2007). It is likely that microstructural abnormalities in WM can cause changes in dendritic arborization and integrity of axons and neuronal soma, leading to a decrease in volume in GM.
Medication use is another confounding factor. We found significant associations between antidepressant use and volumes of the ACC, subgenual ACC and OFC. Antidepressant-free patients had significantly smaller volumes in these ROIs. It is possible that antidepressant use normalized the volume deficits in these regions. One potential candidate for such an effect is the neuroplastic effect of increased levels of neurotrophic factors (i.e. brain-derived neurotrophic factor) induced by specific or secondary (decrease in stress, anxiety) effects of antidepressants (Castrén et al. Reference Castrén, Võikar and Rantamäki2007). It would have been interesting to examine the cumulative effects of medication, but this was not possible because of lack of data. Another potential limitation of the meta-analytical ROI approach relates to the need to combine data from various studies in which the precise anatomical boundaries of specific ROIs may have differed. Although this is a generic limitation of the approach, we nevertheless note the overlap between the current results with the findings of VBM studies (see analysis of quartiles in Bora et al. Reference Bora, Fornito, Pantelis and Yucel2011), which suggest that both techniques are capable of reliably representing the primary volumetric changes observed in MDD. Finally, the current meta-analysis includes a small number of studies for some regions and differences in imaging methods.
Conclusions
Volume reductions in structures of the CSPT circuit are associated with MDD. The available evidence suggests that these abnormalities are more pronounced in some regions in patients with LOD, and in those not taking medication. The effect sizes for volume reductions are modest, suggesting that only a subgroup of MDD patients show volumetric abnormalities in CSPT regions, which is consistent with the heterogeneous nature of MDD as defined in classification systems such as the DSM and ICD. Identifying meaningful neurobiological markers associated with MDD is important because it could lead to better subtyping of the currently heterogeneous MDD syndrome. Longitudinal studies, starting from early phases of the illness (i.e. first-episode, high-risk populations), will also be important for revealing the nature of CSPT abnormalities in MDD.
Note
Supplementary material accompanies this paper on the Journal's website (http://journals.cambridge.org/psm).
Acknowledgements
Dr B. J. Harrison is supported by a National Health and Medical Research Council of Australia (NHMRC) Clinical Career Development Award (I.D. 628509), Dr C. G. Davey is supported by a National Health and Medical Research Council (NHMRC) Training (Postdoctoral) Fellowship (ID no. 628922), and Dr M. Yücel (ID no. 509345) is supported by an NHMRC Clinical Career Development Award.
Declaration of Interest
None.