


Glycation involves the covalent attachment of reducing sugars to available –NH2, essentially the lysine residues (although the α-NH2 and other amino acids can also take part) of a protein. This conjugation is the first step of a complex series of reactions, known collectively as the Maillard reaction (glycation) (Maillard, Reference Maillard1912). The reaction is accelerated by heat and can occur in both the solid state or in aqueous systems (Morgan et al. Reference Morgan, Léonil, Mollé and Bouhallab1999). The conjugation of sugars to proteins results in changes to the functional properties of the protein (Oliver et al. Reference Oliver, Melton and Stanley2006a). As the reaction occurs naturally, it is a promising approach to alter the functional properties of proteins for food purposes. Information on the extent of glycation and changes to protein structure are of interest as they may be related to the functional properties of glycated proteins.
Matrix-assisted laser desorption ionization time-of-flight mass spectrometry (MALDI-TOF-MS) and electron spray ionization mass spectrometry (ESI-MS) have been successfully applied to analyse glycated proteins (Guy & Fenaille, Reference Guy and Fenaille2006; Kislinger, Reference Kislinger2004; Sanz et al. Reference Sanz, Corzo-Martinez, Rastall, Olano and Moreno2007). Use of other techniques such as electrophoresis (Steffan et al. Reference Steffan, Balzer, Lippert, Sambor, Bradbury and Henle2006), nuclear magnetic resonance spectroscopy (Oliver et al. Reference Oliver, Melton and Stanley2006b) and circular dichroism (Chevalier et al. Reference Chevalier, Chobert, Dalgalarrondo, Choiset and Haertlé2002; Wooster & Augustin, Reference Wooster and Augustin2007) have been used to examine structural and conformational changes to milk proteins on glycation. Fourier Transform Infra Red (FTIR), by virtue of its ability to provide information on the structure and environment of proteins, also has potential for investigating structural changes to proteins caused by glycation. The purpose of this work was to examine the extent of glycation in heated aqueous systems of sodium caseinate and glucose by mass spectrometry and to determine the usefulness of FTIR for probing changes to protein structure.
Materials and Methods
Preparation of Glycated Sodium Caseinate
Sodium caseinate (ALANATE 810 from New Zealand) and glucose (Merck, Germany) were used. Aqueous mixtures (20% total solids (TS), pH 6·7) of sodium caseinate (10% TS) and glucose (10% TS) were heated at 90°C for 10, 20, 40 and 60 min. An unheated solution (0 min) was prepared as the control. Samples of protein and sugar alone were subjected to the same treatment. All samples were subsequently freeze-dried to obtain the products in a powder form. The powders were stored at −18°C until analysis.
Fourier Transform Infra Red (FTIR) Spectroscopy and Data Analysis
Spectra were acquired using a Specac Ltd (Orphington, UK) Golden Gate Mk II attenuated total reflectance (ATR) accessory with Diamond Top-plate and ZnSe lenses coupled to a Bruker (Erlingen, Germany) Eqinox 55. Twenty individual spectra of 64 scans were recorded for each sample at 4 cm−1 resolution. Second derivative spectra were calculated in Opus (Bruker) software using 13 point Savitsky-Golay smoothing. Principal Component Analysis (PCA) and Soft Independent Modelling of Class Analogy (SIMCA) was performed using the computer software program, The Unscrambler® V9.2 (Camo, Norway).
Mass Spectrometry
For MALDI-TOF-MS, the samples were desalted using C18 Zip tips (Millipore), according to the manufacturer's recommendations, and eluted with 50% acetonitrile containing 0·1% TFA. Analysis was performed on a Voyager-DE STR (Applied Biosystems, Framingham, MA) operating in linear mode. Sinapinic acid was used as matrix solution. Briefly, matrix was spotted on the sample plate and allowed to air-dry; sample in acetonitrile/water (1:1 v/v) containing 0·1% v/v formic acid was subsequently spotted onto the dried matrix and allowed to air-dry. Data from 500 laser shots (337 nm nitrogen laser) were collected, and the signal averaged and processed with the instrument manufacturer's data Explorer software. ESI-TOF-MS was performed on an Agilent LC/MSD TOF mass spectrometer (Agilent Technologies, Palo Alto, CA). Samples were injected orthogonally into the MS via auto sampler in 20% acetonitrile/0·1% formic acid at 0·25 ml/min. All data were acquired in positive ion mode and reference mass corrected via a dual-spray ESI source. Each data point on the total ion chromatograms (TIC) is an average of 10,000 transients, producing a scan every second. Spectra were created by averaging the scans across each peak. Scans were acquired over 100–2500 m/z.
Results
Fourier Transform Infra Red Spectroscopy
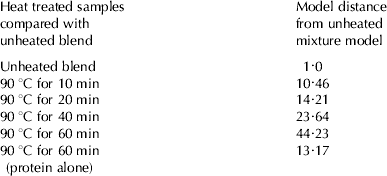
The FTIR spectra for sodium caseinate, glucose, unheated sodium caseinate/glucose mixture and a heated sodium caseinate/glucose mixture (glycated sample) are shown in Fig 1a–d, respectively. The sodium caseinate spectrum shows all the normal features of a protein spectrum with strong amide I and amide II features between 1700–1500 cm−1 and is identical to recent literature with the amide I of the powder form centred at 1660 cm−1 (Pereda et al. Reference Pereda, Aranguren and Marcovich2007). The glucose spectrum likewise shows the normal features of glucose as recently described (Heise, Reference Heise, Chalmers and Griffiths2002). The spectra of the mixtures in Fig 1c & 1d appear at first glance to be simple linear combinations of the spectra of caseinate and glucose and the minute changes that occur from molecular interactions require careful analysis. The changes in the FTIR spectra of the mixtures subjected to heat treatment were examined initially using visual peak picking of spectral second derivatives of the averaged individual spectra. This derivative approach, which removes baseline effects and highlights small changes in band shape and slope, proved that the changes to spectral bands were too small to be easily discerned and that analysis required a multivariate statistical approach to extract the spectral changes. PCA of the entire data set of 120 spectra was performed on the unheated and glycated samples (heated 90°C for 10, 20, 40 and 60 min) and a protein heated sample using the spectral region where the major amide and carbohydrate bands appear (600–1800 cm−1). PCA essentially breaks the dataset down into orthogonal components that describe the variance in the dataset and allow one to examine only the spectral differences (Esbensen, Reference Esbensen2001). The PCA scores plots showed that the spectra from the different samples clustered individually and the loadings plots showed that the largest differences between glycated and non-glycated samples were due to changes in the amide I and II region, hence subsequent PCA analysis used only the region 1400–1800 cm−1. Following PCA, a supervised pattern recognition technique SIMCA, (Esbensen, Reference Esbensen2001) was used to classify the 6 sample types (one untreated mixture, 4 mixtures treated for different times and a protein only sample heated for 60 mins) into class models. Cooman's plots, which show the orthogonal distances from all objects to the class models were examined and it was apparent that the models for the unheated and heated for 10, 20, 40 min, whilst forming defined groups (clusters) in the Cooman's plots did overlap each other, whilst the sample heated for 60 min was clearly separated. This is most likely due to the state of glycation varying through the course of the heat treatment. Further, class model distances were determined in order to measure the degree of separation between the classes into which the samples fell. The model distance is found by fitting objects from different classes to their own model and then all other models in turn and the distance measures calculated from the pooled residual standard differences. The distance of a model to itself is 1 whilst a large inter-model distance indicates a clear separation between models with a model distance of >3 an indicator of significant difference (Esbensen, Reference Esbensen2001). Table 1 summarises the results of this analysis where the model distance (distance between the model centres) of each class from the unheated sample mixture class is listed. It is apparent that the model classes, based on bands due to protein, are distinctly separated from the untreated blend. The model for the protein only sample heated for 60 min is also significantly different from the 40 & 60 min heated protein-glucose samples showing that the observed differences are due to both glycation and heating.
Average vector-normalised baseline corrected ATR spectra of freeze-dried A, sodium caseinate; B, Glucose; C, Sodium caseinate/glucose, unheated (0 min); D, Sodium caseinate/glucose following heat treatment at 90°C, 60 min. NB. The region 2300–1900 cm−1 shows features due to diamond absorbance.

Class differences between unheated mixture and glycated sodium caseinate powders determined by SIMCA/PCA of FTIR data (1800–1400 cm−1). Twenty independent spectra per sample were collected for each model
Mass Spectrometry
Further analysis of the samples was performed by MS. The MALDI-TOF-MS of sodium caseinate alone, both unheated (0 min) and heated (60 min), were superimposable (results not shown). When heated in the presence of glucose, however, glycation occurred, as evident by a marked increase in the average molecular mass of sodium caseinate, which intensified with heating time. After 60 min, an increase in the average molecular mass of sodium caseinate from ∼23 361 to ∼23 847 Da was observed, corresponding to an average degree of glycation of 3 glucose moieties (162×3=486 Da) (Fig. 2). The increase in average molecular weight of the protein was due, at least in part to the attachment of glucose residues on low molecular weight peptides present in the sodium caseinate sample (results not shown). ESI-TOF-MS, which allows a more accurate determination of the protein molecular weight, showed a heterogeneous mixture of various glycoform species was produced. Such heterogeneity increased with heating time. After 60 min glycoforms were observed having 0, 1, 2, 3 and a maximum of 4 glucose moieties attached (Fig. 3).
MALDI-TOF-MS spectra (17000–27000 m/z) of non-glycated (0 min) and glycated sodium caseinate (60 min). (SCN=sodium caseinate).

Deconvoluted ESI-TOF-MS spectra (17000–27000 Da) of non-glycated and glycated sodium caseinate (10 & 60 min). Insets are total ion chromatograms (SCN=sodium caseinate).

Discussion
This work shows the ability of PCA and SIMCA to classify sodium caseinate samples based on time of heat treatment in the presence of reducing sugar i.e. extent of glycation, using FTIR. In particular, the samples could be discriminated based on spectral differences in their amide I and II regions. It is interesting to note that the model distances increased with heating time, indicating that the more extensive the heat treatment (i.e. extent of glycation) the greater the dissimilarity in the amide I and II structural regions of the samples. In particular, the class distances for samples heated at 60 min were considerably greater than that of the physical blend or for those samples exposed to shorter heating times. According to ESI-MS the longer heating time corresponded to a glycation of up to 4 glucose moieties attached. Based on the relative intensities of the different glycoforms in the ESI spectrum a 1:2·2:2·6:1·6:0·2 ratio of adducts having 0, 1, 2, 3 and 4 glucose moieties attached, respectively, was present.
Overall, the results reported herein show that FTIR can be used to discriminate between glycated and non-glycated sodium caseinate, when the data are analysed by multivariate statistical methods such as PCA and SIMCA. This is in contrast to others who found that simple FTIR spectral comparison could not distinguish between glycated and non-glycated ovalbumin (Sun et al. Reference Sun, Hayakawa and Izumori2004). The differences in protein and conditions for glycation used may also however, have contributed to the lack of discrimination by FTIR for ovalbumin samples. For example, ovalbumin is a globular protein which is relatively heat-labile, and hence it may be more difficult to differentiate structural changes due to glycation versus those due to heat-treatment alone. The use of PCA and SIMCA in our work allows improved discrimination between spectra, at least for the non-globular protein sodium caseinate. Although ESI-TOF and MALDI-TOF mass spectrometry are a more accurate and sensitive means of screening complex protein mixtures for quantification of degree of glycation, qualitative differences in protein structure due to glycation can be readily revealed by FTIR when used in conjunction with PCA and SIMCA. Hence FTIR may be an appropriate alternative to MS, depending on the detail of information required.
In conclusion, this preliminary investigation confirmed the usefulness of FTIR with PCA/SIMCA analysis and MS techniques for characterisation of whole glycated proteins. The techniques used were complementary and provided different levels of information about the glycated samples: FTIR providing a means of discriminating samples based on differences in protein structure as a result of glycation whereas mass spectrometry enabling the exact degree of glycation to be established based on protein MW differences. While MS techniques are now used for routine analysis of glycated proteins, the potential of FTIR needs to be further explored for it to be usefully exploited for quality control or as a means of probing changes to protein structure, and the extent to which it can be used to reflect changes in protein functionality. Taken together, the results confirm that an increase in the degree of glycation leads to an increase in structural change to the protein.
This research has been supported by DIAL (Dairy Innovation Australia Ltd), Food Science Australia and the CSIRO Food Futures Flagship. Thanks are due to P. Udabage and A. Puvanenthiran, Food Science Australia for providing samples and useful discussions. MALDI-TOF-MS was carried out by Simon Harris, Monash University. We would also like to thank Bio21 Australia Ltd for access and use of their ESI-TOF-MS.



