

Generalized anxiety disorder (GAD) is one of the most common anxiety disorders among older adults (Beekman et al., Reference Beekman1998; Wolitzky-Taylor et al., Reference Wolitzky-Taylor, Castriotta, Lenze, Stanley and Craske2010). Although the majority of psychological treatment studies for late-life anxiety have focused on treatment of GAD (e.g. Gonçalves and Byrne, Reference Gonçalves and Byrne2012; Gould et al., Reference Gould, Coulson and Howard2012; Hall et al., Reference Hall, Kellett, Berrios, Bains and Scott2016; Hendriks et al., Reference Hendriks, Oude Voshaar, Keijsers, Hoogduin and Van Balkom2008; Pinquart and Duberstein, Reference Pinquart and Duberstein2007; Thorp et al., Reference Thorp, Ayers, Nuevo, Stoddard, Sorrell and Wetherell2009), there is considerable variability in the assessment of treatment outcomes. The Penn State Worry Questionnaire (PSWQ; Meyer et al., Reference Meyer, Miller, Metzger and Borkovec1990) is one of the most widely used measures of worry severity among clinical trials for late-life GAD. In comparison to diagnostic clinical interviews, self-report measures are less costly and time-consuming to administer, making them desirable for use in research and clinical practice to inform treatment progression and discontinuation. Change on the PSWQ is the most commonly used metric of treatment efficacy in randomized control trials for late-life GAD. Despite this, there is considerable variability in the way this measure has been used to define treatment outcome among studies. Empirically derived guidelines for defining treatment response and remission on the PSWQ are necessary to help standardize research outcomes. These guidelines are also necessary for use in clinical practice to benchmark client progress and inform treatment decision-making.
Among older adults, the PSWQ has demonstrated good internal consistency, convergent validity, and modest test–retest reliability (Stanley et al., Reference Stanley, Novy, Bourland, Beck and Averill2001; Wuthrich et al., Reference Wuthrich, Johnco and Knight2014). However, discriminant validity from measures of depression is variable, with some studies reporting moderate correlations (r = .3–.7; Hopko et al., Reference Hopko2003; Wuthrich et al., Reference Wuthrich, Johnco and Knight2014) and others reporting small correlations (r = .2; Stanley et al., Reference Stanley, Novy, Bourland, Beck and Averill2001). At the recommended threshold of scores >50, the PSWQ is able to differentiate GAD from nonclinical samples with 62–90% sensitivity and 70–94% specificity (Stanley et al., Reference Stanley2003b; Webb et al., Reference Webb2008; Wuthrich et al., Reference Wuthrich, Johnco and Knight2014), with moderate to good agreement with presence of a GAD diagnosis on structured diagnostic interviews (κ = .5–.7; Webb et al., Reference Webb2008; Wuthrich et al., Reference Wuthrich, Johnco and Knight2014).
Originally developed with younger adults, the PSWQ demonstrates problems with factor structure in older samples. Despite being designed to assess a unitary construct, the PSWQ commonly shows a two-factor structure among older adults, with reverse-coded items loading on the second factor (Beck et al., Reference Beck, Stanley and Zebb1995), or a poor model fit demonstrated for both a one- and two-factor structure (Hopko et al., Reference Hopko2003; Wuthrich et al., Reference Wuthrich, Johnco and Knight2014). The problematic factor structure has raised concern as to the suitability of this measure for older samples, with suggestions that geriatric-specific measure may be more appropriate, such as the Geriatric Anxiety Inventory (Pachana et al., Reference Pachana, Byrne, Siddle, Koloski, Harley and Arnold2007) or Geriatric Anxiety Scale (Segal et al., Reference Segal, June, Payne, Coolidge and Yochim2010). To overcome this limitation, an abbreviated eight-item version (PSWQ-A; Hopko et al., Reference Hopko2003) was developed, which has shown similar psychometric properties to the full PSWQ, but with a single factor. At the recommended cutoff of >22, the PSWQ-A has similar predictive validity to the full PSWQ to discriminate between those with a GAD diagnosis and those without, with 66–80% sensitivity and 63–93% specificity and moderate to good agreement with diagnostic interviews (κ = .4–.7; Stanley et al., Reference Stanley2003b; Webb et al., Reference Webb2008; Wuthrich et al., Reference Wuthrich, Johnco and Knight2014). The PSWQ more accurately predicts GAD status than the PSWQ-A (Webb et al., Reference Webb2008; Wuthrich et al., Reference Wuthrich, Johnco and Knight2014).
Although several studies have examined the psychometric properties of the PSWQ and PSWQ-A as a screening measure for identifying GAD, there are no studies assessing its validity for assessing treatment outcome. The two important measures of treatment outcome are treatment response (a clinically meaningful improvement in symptoms as a result of treatment) and remission (disappearance or absence of a diagnosis). Although these terms are often used interchangeably, they reflect qualitatively different things and have different implications. Remission is the ultimate goal of treatment, reflecting that the individual no longer meets criteria for a diagnosis. However, assessing treatment response is important to determine whether a treatment is effective in reducing symptoms and to inform whether a treatment should be continued, augmented, or changed. The severity of a client’s disorder also affects these metrics. Those with higher baseline severity may show a meaningful reduction in symptoms (i.e. treatment response) but may still exceed a diagnostic threshold (i.e. not be in remission). This information is important to inform treatment planning, and indications of response but not remission status would suggest a need to continue treatment. In contrast, those with mild disorder severity may achieve remission with a smaller reduction in disorder severity. Thus, both response and remission metrics are important to assess.
Recommended cutoff scores for detecting GAD diagnosis on the PSWQ cannot be applied to determine treatment response, as these absolute values do not provide a metric of change. Further, despite the similar goal of differentiating those with a GAD diagnosis from those without, it cannot be assumed that cutoff scores derived for screening purposes will be optimal for the assessment of diagnostic remission. Cutoff scores recommended for screening purposes prioritize sensitivity – the ability of a test to accurately identify those with the disorder. Although specificity (the ability for a test to correctly identify those without the disease) is also important, the risk of a false negative test may result in a disorder going undetected and untreated. While cutoff scores aim to optimize all screening metrics, sensitivity is typically prioritized over specificity when determining thresholds for screening measures in order to avoid false negatives. In contrast, the primary concern when assessing remission status is whether people may be incorrectly classified as in remission when they are not, resulting in premature treatment discontinuation. As such, the positive predictive value (PPV) (the proportion who are classified as being remitted by the test who are actually in remission) and specificity are prioritized when assessing remission. As such, there is a need for empirically defined guidelines for assessing treatment outcome on the PSWQ.
Despite being one of the most widely used measures of treatment outcome in clinical trials for late-life GAD, there is significant variability among trials in how this measure is used to assess treatment outcome. For example, definitions of treatment response (sometimes referred to minimal clinically significant change) have included an 8.5-point reduction on the PSWQ (Bradford et al., Reference Bradford2011; Stanley et al., Reference Stanley2009; Wetherell et al., Reference Wetherell2013), or a 20% reduction on 66–75% of outcome measures, including PSWQ (Stanley et al., Reference Stanley, Beck and Glassco1996; Stanley et al., Reference Stanley2003a; Reference Stanley, Hopko, Diefenbach, Bourland, Rodriguez and Wagener2003c; Wetherell et al., Reference Wetherell, Gatz and Craske2003). One study used a reliable change index (RCI) (Wetherell et al., Reference Wetherell2005). Others have used a more conservative approach that combines traditional definitions of remission and response, defining treatment responders as those who have both an absence of GAD diagnosis and 20% reduction in 75–80% of outcome measures (Mohlman, Reference Mohlman2008, Mohlman and Gorman, Reference Mohlman and Gorman2005, Mohlman et al., Reference Mohlman, Gorenstein, Kleber, de Jesus, Gorman and Papp2003). Definitions of remission status or high end state functioning have included achieving a score within one standard deviation of the mean for normal older adults samples across 3–4 outcomes measures, although the exact threshold level on the PSWQ has again differed among studies, including a score of ≤37 (Stanley et al., Reference Stanley, Beck and Glassco1996; Wetherell et al., Reference Wetherell, Gatz and Craske2003), ≤36 (Stanley et al., Reference Stanley2003a), and ≤43 (Mohlman, Reference Mohlman2008). To date, only one study has attempted to examine the validity of different definitions; however, this study only assessed agreement between different definitions, but not against gold standard diagnostic interviews (Roseman et al., Reference Roseman2011). This study found moderate agreement (κ = .46) between an 8.5-point reduction and a 20% reduction on 75% of outcome measures that included the PSWQ. Despite this moderate agreement between these two indices, it is important to assess convergence with gold standard diagnostic interviews.
Given its more recent development and primary use as a screening measure, few studies have used the PSWQ-A to assess treatment outcome. Brenes et al. (Reference Brenes, Danhauer, Lyles, Hogan and Miller2015) defined treatment response as a 5.5 point decrease in PSWQ-A score, based on the mean reduction in symptoms from Barrera et al. (Reference Barrera2015), and Stanley et al. (Reference Stanley2014) defined response based on a 20% reduction in 75% of outcome measures. The notable variability in thresholds, and the inconsistent assessment of both treatment response and remission in studies, makes it difficult to compare results across trials and for clinicians to benchmark client progress in practice.
This study aimed to define optimal guidelines for assessing treatment response and remission among older adults with GAD using the PSWQ and PSWQ-A. Remission status was defined as loss of GAD diagnosis using a standardized diagnostic interview. Treatment response was defined using a RCI from change in GAD diagnosis severity on a standardized diagnostic interview. Raw score threshold levels are most relevant to the assessment of remission status (i.e. if an individual reaches the threshold level, they are likely to be in remission from a GAD diagnosis), thus guidelines were developed for defining treatment remission based on a threshold score. Percent reduction in symptoms, raw score reductions, and threshold values have all been used in previous studies defining treatment responder status. Only percent reduction and raw score reduction metrics were considered when developing guidelines for predicting treatment responder status given that threshold values do not provide an index of change.
Method
Participants
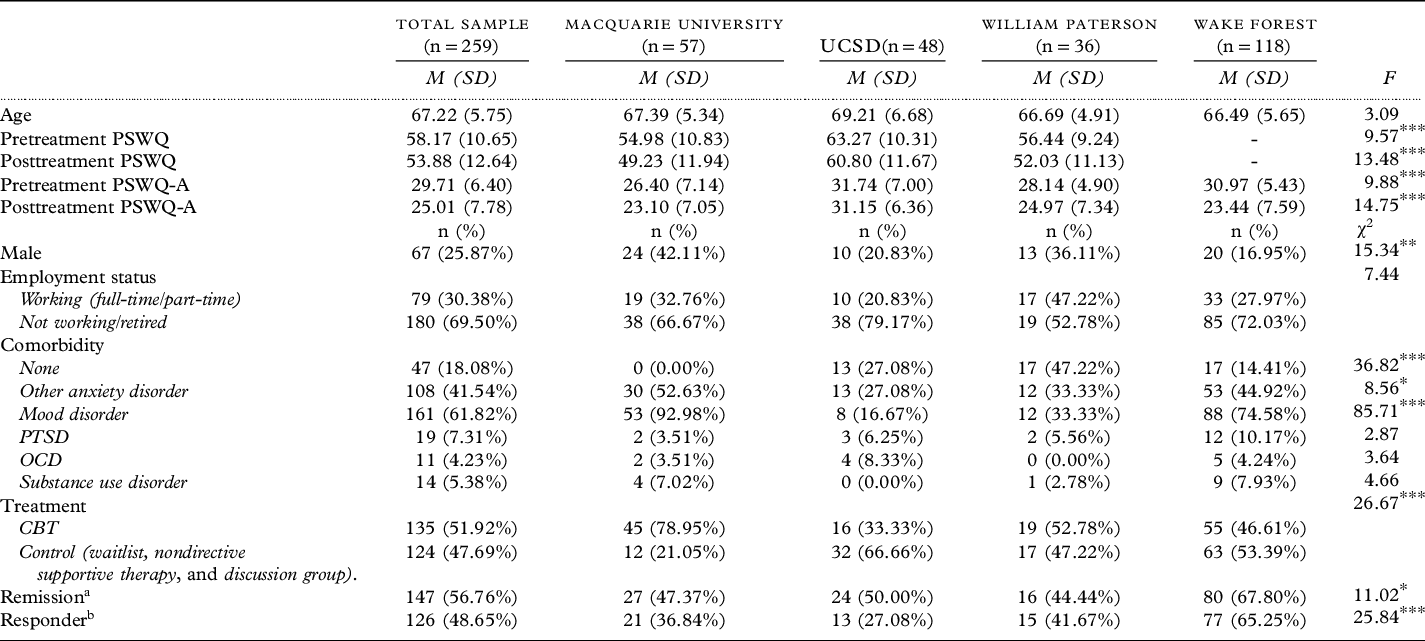
The sample utilized secondary data analysis from seven studies of cognitive behavioral therapy (CBT) for late-life anxiety disorders from four sites: Macquarie University, Australia (Johnco et al., Reference Johnco, Wuthrich and Rapee2014; Wuthrich and Rapee, Reference Wuthrich and Rapee2013), University of California San Diego, USA (UCSD; Wetherell et al., Reference Wetherell, Gatz and Craske2003), William Paterson University, USA (Mohlman, Reference Mohlman2008; , Mohlman, Reference Mohlman2020; Mohlman and Gorman, Reference Mohlman and Gorman2005), and Wake Forest School of Medicine, USA (Brenes et al., Reference Brenes, Danhauer, Lyles, Hogan and Miller2015). The total sample consisted of 259 older participants (age range 60–86 years; M = 67.22, SD = 5.75; 74.13% female). Participants had a diagnosis of GAD at entry into the respective treatment trial based on a structured diagnostic interview – either the Anxiety Disorders Interview Schedule for DSM-IV (ADIS-IV; Di Nardo et al., Reference Di Nardo, Brown and Barlow1994) or Structured Clinical Interview for the DSM (SCID; First et al., Reference First, Spitzer, Miriam and Williams2002). PSWQ data were available used from three sites: Macquarie University, UCSD (2003), and William Paterson University. PSWQ-A data were extracted from full-scale responses from Macquarie University, UCSD, and William Paterson University, with additional PSWQ-A data (n = 118) included from Wake Forest University. Thus, analyses on the PSWQ utilized a subsample of 141 participants (age range 60–86 years, M = 87.83, SD = 5.79; 66.67% female), and analyses for the PSWQ-A utilized the total sample. Table 1 summarizes demographic and clinical characteristics.
Sample demographic and clinical characteristics
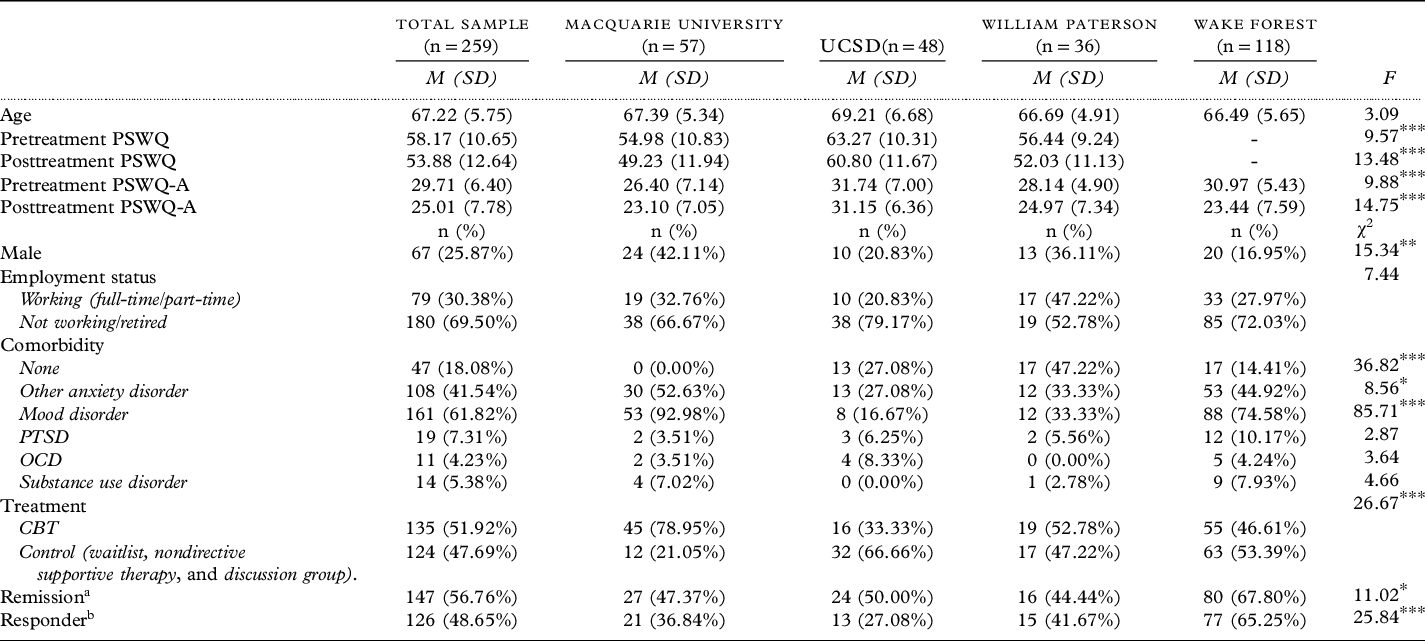
*p < .05, **p < .01, ***p < .001. PSWQ = Penn State Worry Questionnaire; PSWQ-A = Penn State Worry Questionnaire – Abbreviated; CBT = cognitive behavioral therapy; GAD = generalized anxiety disorder; OCD = Obsessive Compulsive Disorder; PTSD = Posttraumatic Stress Disorder.
aRemission was defined as loss of GAD diagnosis on diagnostic interviews.
bTreatment responder status was defined based on a reliable change index of GAD diagnosis severity ratings from diagnostic interviews.
Measures
Diagnostic interviews
Structured clinical interviews were conducted pre- and posttreatment in all studies. The ADIS-IV (Di Nardo et al., Reference Di Nardo, Brown and Barlow1994) was used at Macquarie University and UCSD, and the SCID-IV (SCID; First et al., Reference First, Spitzer, Miriam and Williams2002) was used at Wake Forest and William Paterson University. The ADIS-IV and SCID-IV are semi-structured interviews for diagnosing anxiety and related disorders according to DSM-IV criteria. GAD diagnosis severity was rated using the 0–8 Clinician Severity Ratings from the ADIS at MQ, UCSD, and Wake Forest, with scores of ≥4 indicating severity above diagnostic thresholds. The 0–3 disorder severity ratings from the SCID was used for William Paterson (0 = no diagnosis/none, 1 = mild, 2 = moderate, and 3 = severe), with scores ≥1 indicating severity above diagnostic thresholds. Diagnostic interviews were administered by graduate-level Clinical Psychology students, Psychologists, and Clinical Psychologists blind to treatment allocation and supervised by licensed Clinical Psychologists. Based on data from the original studies from which these data were drawn, interrater reliability for the diagnosis of GAD was excellent at Macquarie University (κ = 1.00), strong at William Paterson (κ = .90), and moderate at UCSD (κ = .87).
Penn State Worry Questionnaire (PSWQ; Meyer et al., Reference Meyer, Miller, Metzger and Borkovec1990) and Penn State Worry Questionnaire – Abbreviated (PSWQ-A; Hopko et al., Reference Hopko2003)
The PSWQ is a 16-item measure of worry severity and the PSWQ-A is the 8-item abbreviated version. Both measures ask individuals to rate their level of trait worry on a 5-point likert scale. Total scores range from 16 to 80 for the PSWQ and 8–40 for the PSWQ-A, with higher scores reflected greater anxiety. Internal consistency was excellent for the PSWQ and PSWQ-A at pretreatment (α = .87 and .86) and posttreatment (α = .91 and .91) in this sample.
Treatment conditions
Participants from Macquarie University were randomized to a manualized group CBT condition or a waitlist control condition (Wuthrich and Rapee, Reference Wuthrich and Rapee2013). CBT utilized the Ageing Wisely treatment program (Wuthrich, Reference Wuthrich2009) which consisted of 12x2 hours group therapy sessions for anxiety and depression in older adults and included behavioral activation, cognitive restructuring, problem-solving, exposure therapy, assertiveness, and managing bereavement.
Participants from UCSD were randomly assigned in small groups to one of three conditions: a 12x1.5 hour CBT group, discussion group, or a 12-week waitlist condition. CBT consisted of relaxation training, cognitive restructuring, and worry exposure based on the Craske et al. (Reference Craske, Barlow and O’Leary1992) manual, with minor modifications for older adults (omission of time management and benzodiazepine withdrawal and examples made relevant to older people). The discussion group consistent of group discussions focused on topics known to be worry-provoking for older adults, including memory problems, health concerns, and bereavement. Group leaders provided validation and supportive listening and encouraged peer support and information sharing, but did not teach skills or differentially reinforce coping strategies.
Participants from William Paterson University were randomly assigned to either CBT or a waitlist condition. CBT consisted of 13 individual 50-minute sessions that included relaxation, cognitive restructuring, worry exposure, activity planning, time management, breaking tasks down into small steps, communication skills, and mindfulness..
Participants from Wake Forest University were randomized to either CBT or supportive therapy. CBT consisted of 9–11 weekly sessions via telephone and included relaxation, cognitive restructuring, coping statements, problem-solving, worry control, behavioral activation, and exposure therapy. Supportive therapy consisted of 10 weekly nondirective sessions that emphasized supportive and reflective communication but avoided advice or coping methods.
Procedure
Participants were randomly allocated to a manualized CBT or a control condition within the original randomized clinical trials from which these data were drawn. Data from diagnostic assessments and PSWQ/PSWQ-A administered at pre- and posttreatment were used in this study.
Data analysis
There was a minimal amount of missing data (.65%), and the pattern of missingness was considered missing completely at random (Little’s MCAR χ(337)2 = 314.73, p = .803). As such, missing values were imputed using the expectation maximization algorithm.
A Receiver Operating Characteristic (ROC) curve analyses were used to assess optimal thresholds on the PSWQ and PSWQ-A for defining treatment remission and response status based on diagnostic interviews. Remission was defined as loss of GAD diagnosis on diagnostic interviews. Treatment responder status was defined based on a RCI utilizing GAD diagnosis severity ratings from diagnostic interviews, with a RCI (Jacobson and Truax, Reference Jacobson and Truax1991) calculated separately for severity ratings on the ADIS (range 0–8) and SCID (range 0–3) to determine responder status.
The area under the curve (AUC) statistic was used to assess the accuracy of the PSWQ and PSWQ-A to differentiate those who were remitted/responders and those who were not, with values of 1 representing perfect prediction and values of .5 being no better than chance. AUC of .5–.6 is considered poor, .7–.8 is acceptable, .8–.9 is excellent, and >.9 is outstanding (Mandrekar, Reference Mandrekar2010). Consistent with previous signal detection studies (e.g. Caporino et al., Reference Caporino2013; Houghton et al., Reference Houghton2015; Johnco et al., Reference Johnco, De Nadai, Lewin, Ehrenreich-May, Wood and Storch2015a; Reference Johnco, Salloum, Lewin and Storch2015b; , Skarphedinsson et al., Reference Skarphedinsson, De Nadai, Storch, Lewin and Ivarsson2017; Storch et al., Reference Storch, Lewin, De Nadai and Murphy2010, Reference Storch2011), six metrics were used to evaluate various cutoff scores. Sensitivity (i.e. true positive rate) is the proportion of participants who meet remission status based on diagnostic interviews who would be correctly classified as in remission based on the cutoff score (true positive/[true positive + false positive]). Specificity (i.e. true negative) is the proportion of participants who do not meet remission status and who would be correctly classified as not remitted based on the test cutoff score (true negative/[false positive + true negative]). PPV is the proportion of participants who are identified as being remitted by the test and who are also classified as remitted based on clinical interviews (true positive/[true positive + false positive]). Negative predictive value (NPV) is the proportion of participants who are identified as not remitted based on the test cutoff and who are also not considered remitted based on diagnostic interviews (true negative/[true negative + false negative]. Percent agreement (agreement) between remission status as classified by clinical interviews and test cutoff scores was calculated. Finally, agreement between clinical interviews and test cutoff scores was also evaluated using Cohen’s κ, given this metric accounts for chance agreement and is a preferred metric to simple percent agreement. A κ of .2–.4 indicates fair agreement, .4–.6 indicates moderate agreement, .6–.8 indicates substantial agreement, and ≥.8 indicates almost perfect agreement (Landis and Koch, Reference Landis and Koch1977).
When deciding on optimal cutoffs, the purpose of test use was considered, and a conservative approach was adopted. Classifying an individual as “remitted” would indicate treatment success and likely prompt treatment discontinuation. Given the risk of prematurely discounting treatment, κ, PPV, and specificity metrics were prioritized when evaluating cutoff scores. Given that classifying an individual as having “responded” to treatment would indicate the need for continued treatment but not necessarily discontinuation, metrics were weighted more equally when evaluating optimal cutoff scores.
Results
Preliminary analyses
Demographic and clinical differences between samples are noted in Table 1. There were no significant group differences in age or employment status. There was some sample differences in sex distribution, with a greater proportion of males in the MQ sample and the lowest proportion in the Wake Forest sample. There were also some sample differences in comorbidity, with a greater proportion of comorbid mood disorders and a lower proportion with no comorbid disorder in the Macquarie and Wake Forest samples. There was no evidence that these sample differences in sex distribution influenced core variables of interest, with no significant sex differences in PSWQ or PSWQ-A scores at pre- or posttreatment, or in remission or responder status (all p’s > .05). Similarly, there were no differences in remission or responder status based on having a comorbid mood disorder or no comorbidity, and no differences in pre- or post-PSWQ scores based on having no comorbidity (all p’s > .05). However those with a comorbid mood disorder reported significant lower pre- and posttreatment PSWQ (t(139) = 2.60, p = .010, and t(139) = 3.56, p = .001) and lower posttreatment PSWQ-A scores (t(257) = 2.80, p = .006), but not pretreatment PSWQ-A scores (t(139) = .54, p = .590). Given that differential treatment efficacy based on comorbidity status was not a primary outcome of interest in this study, samples were combined for all analyses.
To examine change in symptoms from pre- to posttreatment based on diagnostic interviews, 56.78% of the sample were remitted from their GAD diagnosis at the end of treatment, with a significantly greater proportion of these from the CBT conditions (n = 94, 69.63%) compared with the control conditions (n = 53, 42.74%; χ(1)2 = 19.04, p < .001). Similarly, there was a significantly higher proportion of participants in the CBT conditions (n = 79, 58.52%) compared with the control conditions (n = 47, 37.90%) that were classified as treatment responders, χ(1)2 = 11.00, p = .001. Symptom change on PSWQ and PSWQ-A showed a similar pattern, with a significant decrease in PSWQ (t = 4.25, p < .001) and PSWQ-A scores (t = 9.71, p < .001) from pre- to posttreatment. Repeated measures ANOVA showed a significant time by condition interaction for PSWQ scores (F(1, 139) = 16.47, p < .001), with those in the CBT conditions showing a significant reduction in PSWQ scores over treatment (Mdiff = −7.71, SE = 1.28, F(1,139) = 36.28, p < .001, η p 2 = .21), but no significant change in PSWQ scores among those in the control conditions (Mdiff = −.19, SE = 1.47, F(1,139) = .02, p = .898, η p 2 = .02). Based on PSWQ-A scores, there was a significant time by condition interaction (F(1, 257) = 15.77, p < .001) showing a greater reduction in PSWQ-A scores among those in the CBT conditions (Mdiff = 6.50, SE = .65, F(1,257) = 99.21, p < .001, η p 2 = .28) compared with the control condition (Mdiff = −2.75, SE = .68, F(1,257) = 16.37, p < .001, η p 2 = .06).
Prediction of remission status using the PSWQ
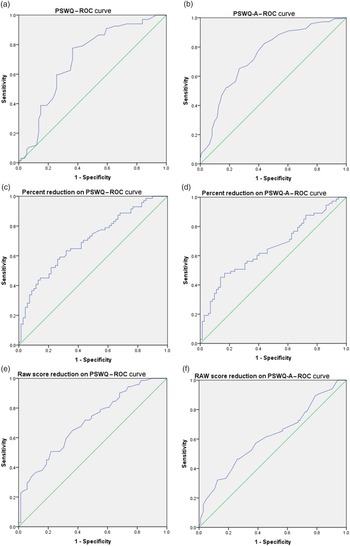
An ROC analysis assessed the predictive validity of scores on the PSWQ and PSWQ-A at posttreatment to identify remission status. The AUC was fair for both measures, .70 (SE = .05, p < .001) for the PSWQ and .74 (SE = .03, p < .001) for the PSWQ-A (see Figures 1a and 1b).
ROC curves for predicting remission from generalized anxiety disorder for PSWQ (a) and PSWQ-A (b). ROC curve for predicting treatment response based on percent reduction in scores on PSWQ (c) and PSWQ-A (d) and raw score reduction in scores on PSWQ (e) and PSWQ-A (f).

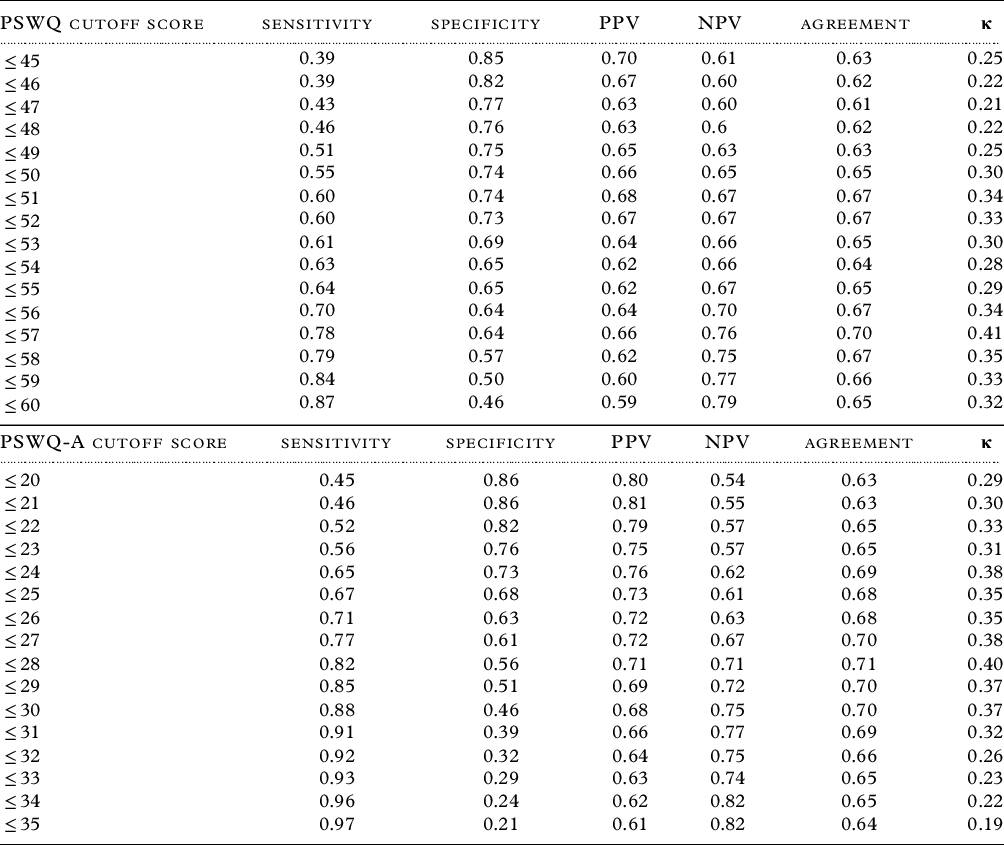
Table 2 summarizes the metrics for predicting GAD remission status using raw cutoff scores on the PSWQ. Results suggest that a cutoff score of ≤51 was the optimal cutoff score for defining remission, with a minimal level of agreement between the cutoff score and diagnostic criteria (κ = .34). At this cutoff score, 60% of those who were remitted would correctly be identified as such (sensitivity = .60), 74% of those who were not remitted would be correctly classified as such (specificity = .74), 68% of those who would be classified as remitted based on PSWQ scores would also be classified as such based on clinical interviews (PPV = .68), and 67% of those who would be classified as not remitted based on PSWQ score would also be classified as such based on clinical interviews (NPV = .67). Although a cutoff score of ≤57 was also considered on the basis of higher κ (.41), NPV (.76) and sensitivity (.78), the more conservative criteria of ≤51 was chosen on the basis of the higher specificity value and similar PPV (.66). Specificity and NPV were both chosen a priori as the prioritized statistics; however, the two cutoff scores differed in their superiority on each metric. Given the risk of premature treatment discontinuation in a client who is not in remission, optimizing specificity was considered the priority. In comparison, the implication of a lower NPV would be additional treatment in a client who was actually in remission. On balance, premature discontinuation was prioritized, along with the specificity metric.
Prediction of clinical remission based on loss of generalized anxiety disorder diagnosis using the PSWQ
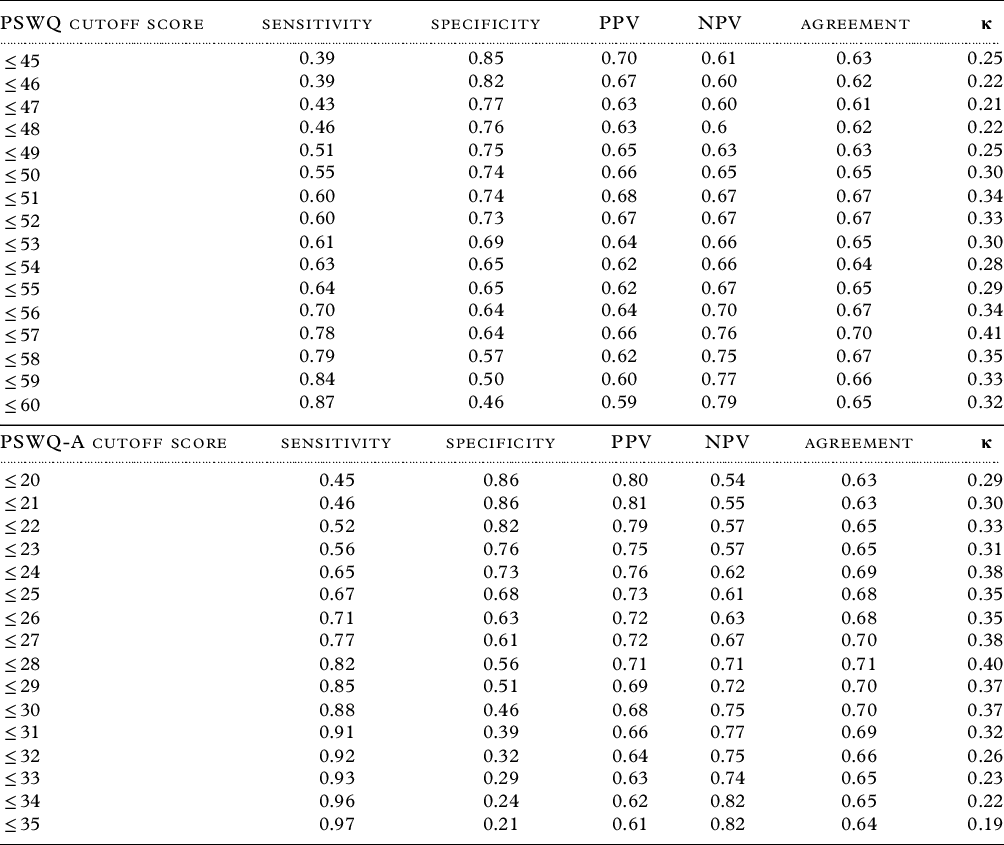
κ = kappa; NPV = negative predictive value; PPV = positive predictive value; PSWQ = Penn State Worry Questionnaire; PSWQ-A = Penn State Worry Questionnaire – Abbreviated.
Prediction of remission status using the PSWQ-A
The lower section of Table 2 summarizes results for predicting GAD remission status using PSWQ-A cutoff scores. Results suggest an optimal cutoff score of ≤24, with this cutoff resulting in 69% agreement with diagnostic interviews, κ = .38, sensitivity = .65, specificity = .73, PPV = .76, and NPV = .62. Cutoff scores of ≤27 and ≤28 were also considered due to their slightly higher κ, sensitivity, and NPV statistics; however, ≤24 was chosen as the optimal cutoff given higher specificity and PPV values for the same reasons noted above for the full PSWQ.
Prediction of treatment response
Four ROC analyses examined the predictive validity of changes in scores on the PSWQ and PSWQ-A to identify treatment response status, using percent reduction in scores from pretreatment to posttreatment, as well as raw score reductions. The AUC was fair for percent reduction on the PWSQ, .70 (SE = .04, p < .001), but poor for percent reduction on the PSWQ-A (AUC = .65, SE = .05, p = .001; see Figures 1c and d). Similarly, the AUC was acceptable for predicting treatment response based on raw score reductions on the PSWQ (AUC = .70, SE = .04, p < .001) but poor for predicting response based on PSWQ-A raw sore reduction (AUC = .62, SE = .04, p = .007; see Figures 1e and f).
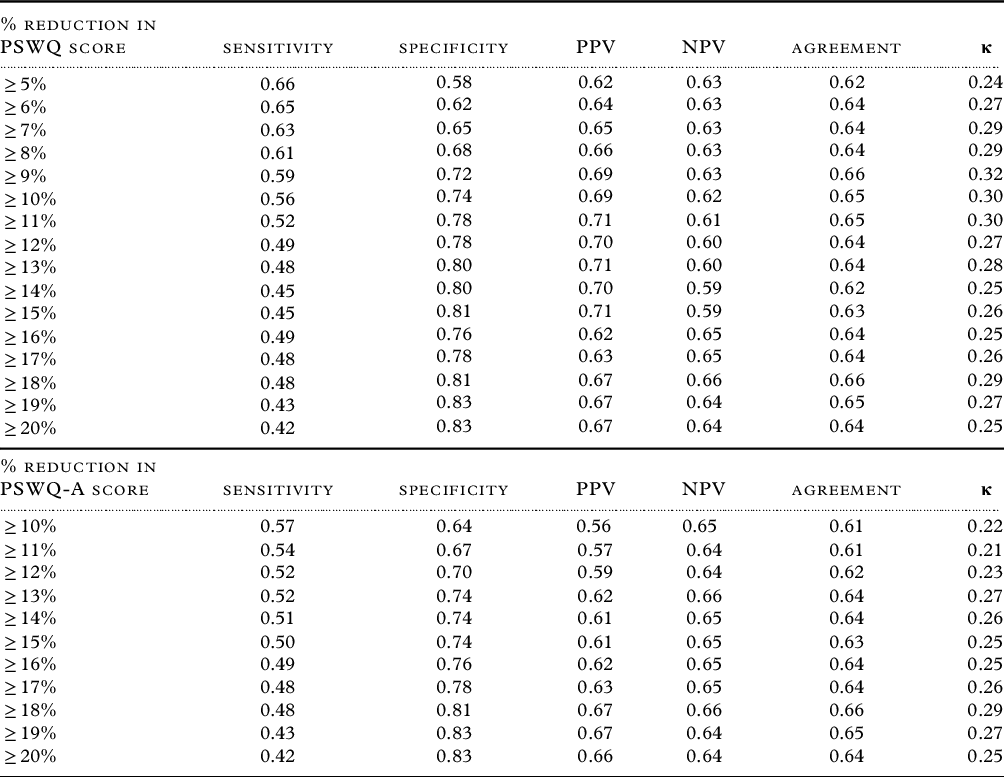
The upper section of Table 3 summarizes statistics for the percent reduction in PSWQ scores to predict treatment responder status. A 9% reduction in PSWQ score optimally predicted treatment response, with fair agreement with diagnostic assessments (κ = .32), sensitivity = .59, specificity = .72, PPV = .69, NPV = .63, and agreement = .66. At the previously used threshold of 20%, sensitivity = .42, specificity = .83, PPV = .67, NPV = .64, agreement = .64, and κ = .25.
Prediction of treatment response based on reliable change in GAD diagnostic severity from percent reduction in PSWQ score from pre- to posttreatment

κ = kappa; NPV = negative predictive value; PPV = positive predictive value; PSWQ = Penn State Worry Questionnaire; PSWQ-A = Penn State Worry Questionnaire – Abbreviated; GAD = generalized anxiety disorder.
The ability for the percent reduction in PSWQ-A scores to predict treatment response is summarized in the lower section of Table 3. A 13% or 14% reduction were the best cutoff scores; however, both showed suboptimal metrics, with 51–52% of treatment responders identified (sensitivity = .52 and .51, respectively), 74% of nonresponders correctly identified (specificity = .74 for both cutoffs), PPV = .62 and .61, NPV = .66 and .65, agreement = .64 for both, and κ = .27 and .26.
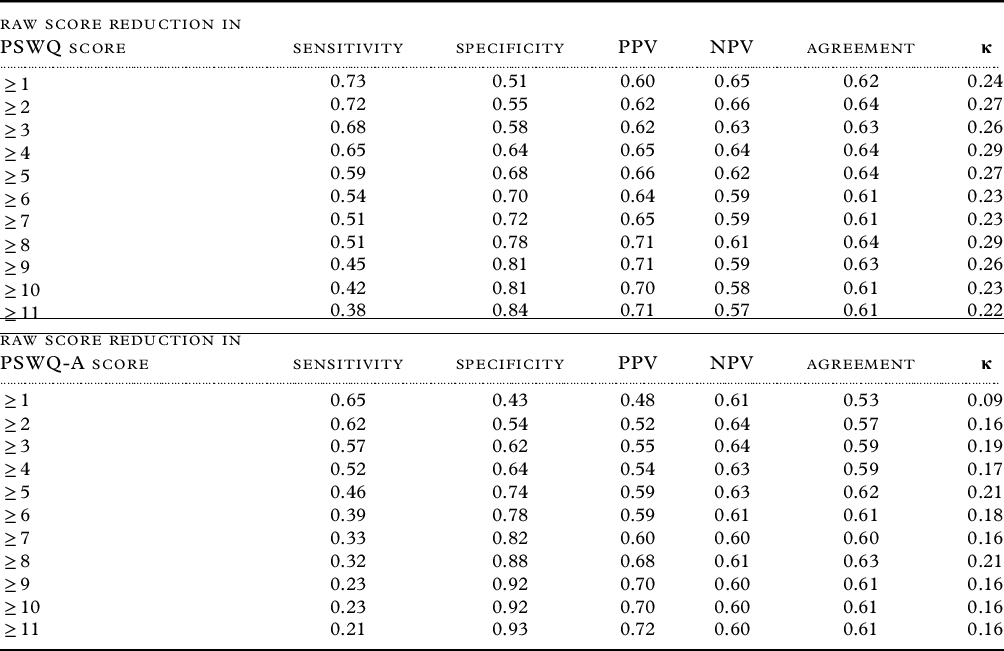
The upper section of Table 4 summarizes prediction of treatment response based on a raw score reduction on the full PSWQ. The optimal cutoff was ≥4, which had sensitivity of .65, specificity of .64, PPV of .65, NPV of .64, agreement of .64, and κ = .29. At the previously used threshold of ≥8.5, sensitivity = .51, specificity = .78, PPV = .71, NPV = .61, agreement = .64, and κ = .29.
Prediction of treatment response based on reliable change in GAD diagnostic severity from raw score reduction in PSWQ score from pre- to posttreatment
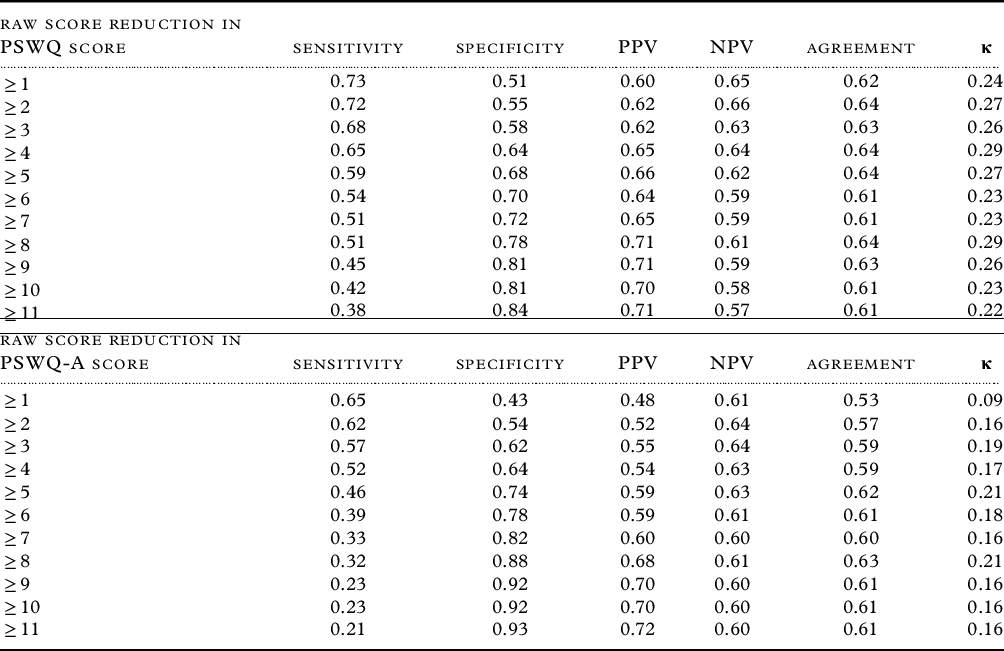
κ = kappa; NPV = negative predictive value; PPV = positive predictive value; PSWQ = Penn State Worry Questionnaire; PSWQ-A = Penn State Worry Questionnaire – Abbreviated; GAD = generalized anxiety disorder.
The lower section of Table 4 summarizes the prediction of treatment response based on a raw score reduction on the PSWQ-A. Consistent with the poor AUC, there were no cutoff scores that were considered appropriate. The highest κ value was .21 and even the highest sensitivity value (≥5: κ = .46) indicated that fewer than 50% of those who had responded to treatment would be identified using this measure.
Discussion
Given the considerable variability in the definitions and use of the PSWQ to define treatment outcome in previous studies, this study aimed to develop empirically derived guidelines for defining treatment response and remission status among older adults with GAD using the PSWQ and PSWQ-A. Results suggest that a score of ≤51 was optimal for defining remission status on the PSWQ, and a score of ≤24 was optimal on the PSWQ-A. A 9% reduction or ≥4-point reduction was optimal for assessing treatment response on the PSWQ. The PSWQ-A was poor at identifying treatment response status, and no guidelines are recommended.
The recommended thresholds for assessing remission status are similar to those recommended for screening purposes. A score of 51 or above on the PSWQ is recommended when screening for likely GAD (Stanley et al., Reference Stanley2003b). The recommendation of a threshold of ≤51 for assessing remission status is similar. The guideline of ≤24 for assessing remission status on the PSWQ-A is also similar to the threshold cutoff score of ≥23 and above for screening purposes (Stanley et al., Reference Stanley2003b). However, this is notably different from thresholds used in previous studies assessing remission or high end state functioning that have used scores of ≤37 (Stanley et al., Reference Stanley, Beck and Glassco1996; Wetherell et al., Reference Wetherell, Gatz and Craske2003), ≤36 (Stanley et al., Reference Stanley2003a), and ≤43 (Mohlman, Reference Mohlman2008) on the PSWQ. Our results suggest that these conservative thresholds are likely to have underestimated the effects of treatment in older adults, with results from this study suggesting that these conservative thresholds would have detected less than 40% of remitted cases, but would have greater than 80% specificity. The use of diagnostic interviews to assess symptom change in this study is superior to the exclusive reliance on self-report measures in these previous studies, which can be affected by self-report biases.
The recommended thresholds for defining treatment response on the PSWQ (≥9% reduction or ≥4-point reduction) are much lower than thresholds used in previous studies, which have typically utilized an 8.5-point reduction (Bradford et al., Reference Bradford2011; Stanley et al., Reference Stanley2009; Wetherell et al., Reference Wetherell2013) or 20% reduction (Stanley et al., Reference Stanley, Beck and Glassco1996; Stanley et al., Reference Stanley2003a, Reference Stanley, Hopko, Diefenbach, Bourland, Rodriguez and Wagener2003c, Wetherell et al., Reference Wetherell, Gatz and Craske2003). Given that a 20% reduction in symptoms only detected 42% of those who were classified as treatment responders, and an 8.5-point reduction detected 51%, these previous thresholds are likely to have notably underestimated treatment effects when categorical outcome measures have been reported.
Despite adequately detecting remission status, the PSWQ-A was poor at identifying treatment response. Although this measure demonstrates superior factor structure to the full PSWQ and good ability to detect GAD status (Hopko et al., Reference Hopko2003; Webb et al., Reference Webb2008; Wuthrich et al., Reference Wuthrich, Johnco and Knight2014), results suggest that the PSWQ-A would be no better than chance at determining treatment response and should only be used to determine remission status when considering treatment discontinuation. Despite this, it is important to note that this is only relevant when treatment response is a categorical outcome (i.e. treatment responder or nonresponder). The majority of research studies examine average group change in symptoms, and these results do not necessarily suggest problems when using these statistical methods. However, linear change metrics are only relevant when reporting results of research trials, given that beta-weights and p-values are of no use for evaluating treatment of an individual patient. In treatment contexts, dichotomous metrics for determining treatment effects are ideal to provide an objective measure of progress.
This study has several limitations to note. Even at optimal cutoffs, the PSWQ showed only fair to moderate ability to predict remission or response (κ = .3–.4; AUC = .7). Although these are acceptable ranges (Landis and Koch, Reference Landis and Koch1977), they are slightly lower than other signal detection studies (e.g. Caporino et al., Reference Caporino2013; Houghton et al., Reference Houghton2015; Johnco et al., Reference Johnco, De Nadai, Lewin, Ehrenreich-May, Wood and Storch2015a, Reference Johnco, Salloum, Lewin and Storch2015b; Skarphedinsson et al., Reference Skarphedinsson, De Nadai, Storch, Lewin and Ivarsson2017; Storch et al., Reference Storch, Lewin, De Nadai and Murphy2010, Reference Storch2011) and are relatively low in absolute terms. Overall, these results suggest that the PSWQ is suboptimal for evaluating treatment outcome in geriatric GAD. These findings highlight the need to consider whether geriatric-specific measures of anxiety (e.g. Geriatric Anxiety Scale/Geriatric Anxiety Inventory) may be superior for assessing treatment outcomes. However, using these empirically derived guidelines in conjunction with other measures may improve predictive capacity of the PSWQ. It is notable that most of the previous studies that have used the PSWQ in defining outcome status have used this as one of three or four measures that are used in combination to assess outcome. While this may improve accuracy, the requirement to administer and score up to four self-report measures of the same symptom cluster risks increasing client and clinician burden and may deter use of objective outcome measures in clinical practice. Combining data from multiple sites and countries improved power and generalizability of these findings; however, the inconsistent use of diagnostic interviews (e.g. ADIS vs. SCID) and the discrepant use of a 0–8 or 0–3 scale to rate disorder severity between studies was a limitation. Although the RCI used to define treatment responder status on diagnostic interviews was calculated separately for each of these, it would be advantageous for consistent use of severity ratings and diagnostic interviews. Similarly, the site differences in comorbidity profiles were reflective of different trial inclusion criteria (i.e. the requirement of comorbid depression at Macquarie University; Wuthrich and Rapee, Reference Wuthrich and Rapee2013). While differential treatment outcomes by site or based on comorbidity status was not a primary outcome of interest in this study, results warrant replication in a large and more clinically homogenous sample with consistent measurement approaches.
The PSWQ is one of the most widely used self-report measures of worry severity used in treatment trials for late-life GAD. Despite this, the definitions and thresholds used to assess treatment outcome has varied between studies. Using a large sample of older adults who received treatment for late-life GAD, this study provides empirically derived guidelines for defining remission and treatment response status. A score of ≤51 on the PSWQ and ≤24 on the PSWQ-A are recommended for defining remission. A 9% reduction or ≥4-point reduction on the PSWQ is recommended for defining treatment response, whereas the PSWQ-A was not suitable for assessing treatment response status. Findings suggest that most of the previously used definitions have underestimated the treatment effects for late-life GAD. The standardization of response and remission criteria is important for comparison between treatment trials and for the benchmarking of outcomes in clinical practice.
Conflict of interest
None.
Description of authors’ roles
Carly Johnco designed the study, collected and analyzed data, and wrote the manuscript. Viviana Wuthrich collected data, assisted with data interpretation, and provided feedback on the manuscript. Gretchen Brenes, Julie Wetherell, and Jan Mohlman collected data and provided feedback on the manuscript.
Funding
This work was supported by the National Health and Medical Research Council of Australia, National Institute of Mental Health, and National Alliance for Research on Schizophrenia and Depression (NARSAD) Young Investigator Grant.