Implications
This study demonstrates that for high yielding Holstein Friesian cows managed on a grass silage-based diet, concentrate inclusion levels in early lactation can be substantially increased or decreased, with corresponding effects on performance, energy balance (EB) and body tissue mobilization. However, concentrate level had no effect on the immune parameters examined in this study, including the ability of neutrophils to phagocytose bacteria and respond with oxidative burst, and interferon-γ (IFN-γ) production of lymphocytes following whole blood stimulation.
Introduction
The intakes of dairy cows during early lactation are often unable to keep pace with the rapid increase in energy requirements associated with milk production, and as a consequence, cows enter negative EB (Ingvartsen, Reference Ingvartsen2006). Negative nutrient balance (including negative EB) is associated with an increase in both production and inflammatory disease, leading to significant economic loss and animal welfare problems (Mulligan and Doherty, Reference Mulligan and Doherty2008). In addition, changes in blood metabolite profiles due to the catabolic state of body tissue mobilization have been shown to impair immune function. For example, in vitro studies have demonstrated that low glucose concentrations reduce the energy available for many neutrophil functions (Newsholme et al., Reference Newsholme, Curi, Gordon and Newsholme1986; Roche et al., Reference Roche, Bell, Overton and Loor2013), higher non-esterified fatty acid (NEFA) concentrations decrease neutrophil viability (Scalia et al., Reference Scalia, Lacetera, Bernabucci, Demeyere, Duchateau and Burvenich2006) and higher β-hydroxybutyrate (BHB) concentrations impair neutrophil phagocytic and bactericidal capacity (Suriyasathaporn et al., Reference Suriyasathaporn, Heuer, Noordhuizen-Stassen and Schukken2000). However, few in vivo studies have directly examined the relationship between EB and immune function in early lactation. In early lactation cows it might be expected that higher concentrate inclusion levels would improve nutrient balance (including EB), improve immune function and decrease the risk of health problems.
Achieving high energy intakes in early lactation are expected to reduce negative EB at this time, with Ferris et al. (Reference Ferris, Gordon, Patterson, Mayne and McCoy2003) advocating the use of diets with a high intake potential and/or with a high energy density. While this can be achieved by increasing the proportion of concentrates in the diet, concentrates are generally more expensive than pasture and conserved forage. Consequently, concentrate feed levels on commercial farms will be influenced by economic factors. For example, concentrate feed levels may be increased under a high milk price and/or low concentrate (LC) cost scenario or reduced under a low milk price and/or high concentrate (HC) cost scenario. Indeed, concentrate feed levels adopted in many countries have changed considerably in recent years, reflecting volatility in global dairy markets and fluctuations in the costs of feed ingredients. While many studies have examined the impact of postpartum concentrate feed levels on dry matter intake (DMI), milk production and tissue changes (e.g. Ferris et al., Reference Ferris, Gordon, Patterson, Mayne and Kilpatrick1999; Andersen et al., Reference Andersen, Friggens, Sejrsen, Sørensen, Munksgaard and Ingvartsen2003; Sterk et al., Reference Sterk, Johansson, Taweel, Murphy, van Vuuren, Hendriks and Dijkstra2011), few have examined the impact of postpartum concentrate feed level on immune function in vivo.
Therefore, the objectives of the current study were to investigate the effect of concentrate inclusion level in a grass silage-based diet on the performance, metabolic and immune function of early lactation Holstein Friesian cows. We hypothesized that increasing the proportion of concentrates in early lactation would improve EB and result in improvements in measures of immune function.
Material and methods
Animals and housing
This study was conducted at the Agri-Food and Biosciences Institute, Northern Ireland (from September 2014 to January 2015), and involved 45 multiparous (mean parity, 3.5; SD, 1.27) and 18 primiparous Holstein Friesian dairy cows. Cows had a mean predicted transmitting ability (PTA)2015 for milk yield of 132 kg (SD, 128.1), milk fat plus protein yield of 20.6 kg (SD, 9.20) and a mean profitable lifetime index (PLI)2015 of £260 (SD, 85.7). These cows were within the top 1% of UK genetics in terms of PLI.
Throughout the experiment all cows were housed together in a free stall cubicle house with concrete flooring, which was scraped every 3 h by an automated system. The cubicle to cow ratio was ≥1:1 at all times. Cubicles were fitted with rubber mats and were bedded three times each week with sawdust.
Experimental design, diets and feeding
All cows were managed identically during the prepartum period. Within 24 h of calving, cows were transferred from a maternity pen to the free stall cubicle house described earlier. Cows were randomly assigned to one of three treatments at calving, namely LC, medium concentrate (MC) and HC, with primiparous and multiparous cows being assigned separately. However, throughout the allocation process a check was made to ensure that the three treatment groups remained ‘balanced’ for parity, PTA for fat plus protein (kg), pre-calving BW and body condition score (BCS), and in the case of multiparous cows, for previous lactation 305-day milk yield.
The treatment diets were offered as a partial mixed ration comprising concentrates and grass silage in differing ratios (30:70, 50:50 and 70:30) on a dry matter (DM) basis for LC, MC and HC, respectively. The concentrates offered with each treatment (Table 1) were formulated using the FeedByte® rationing model version 3.78 (available at http://www.sruc.ac.uk/info/120110/dairy/354/dairy_services-key_features) so as to achieve a common total diet CP concentration of 150 g/kg DM with each of LC, MC and HC. Concentrate formulations were based on the quality of grass silage offered and estimated intakes of silage and concentrates by cows on each treatment. The grass silage offered was produced from a primary growth herbage that was harvested from predominantly perennial ryegrass-based swards and ensiled following a 24 to 48 h period of field wilting. Rations were prepared daily using a complete diet mixer wagon (Redrock Varicut; Redrock, County Armagh, Northern Ireland), and transferred directly to feed-boxes mounted on weigh cells. Access to treatment rations were controlled by a Calan Broadbent feeding system (American Calan Inc., Northwood, NH, USA) linked to an electronic identification system, thus enabling individual cow intakes to be recorded daily. Uneaten ration was removed daily at ~0800 h, whereas the fresh ration was offered between 0900 and 1000 h. To ensure ad libitum consumption, the diets for each treatment were offered at 107% of the previous day intake. To maintain efficient cow flow onto the milking parlour, all cows were offered an additional 0.5 kg concentrate at each milking via an in-parlor feeding system (Table 1). The study was conducted over the first 70 days post-calving.
The ingredient compositions (g/kg fresh basis) of the concentrates offered with the low, medium and high concentrate treatments, and the concentrate offered via the in-parlor concentrate feeder to Holstein Friesian dairy cows

1 Maxfat CS, rumen protected fat; Trouw Nutrition, Cheshire, UK.
2 Acidbuf, rumen acid buffer; Celtic Sea Minerals, Cork, Ireland.
Feed analysis
Samples of grass silage were taken daily (n=110), dried at 85°C for 18 h to determine oven DM content and milled through a sieve with 0.8 mm apertures. Subsamples of the dried milled silages were collected twice weekly and composited every 14 day (n=8), with the composited sample analyzed for NDF, ADF and ash. In addition, a sample of the silage was taken every 7 day (n=16), split into two portions, one for analysis of pH and concentrations of gross energy, CP (nitrogen (N)×6.25), ammonia-N, and fermentation acids (lactic and acetic acid), and one for estimation of metabolizable energy (ME) concentration. Volatility coefficients were used to convert the oven DM contents of the grass silages offered to a volatile-corrected DM basis. A sample of each of the concentrates offered was taken weekly, dried at 100°C for 24 h before milling through a 0.8 mm sieve, composited every 14 day (n=8) and analyzed for NDF, ADF, ash, gross energy and CP (N×6.25) concentrations. An additional concentrate sample was taken at the same frequency, dried at 60°C for 48 h, and milled (0.5 mm sieve) before analysis for starch concentration. All lab analyses were conducted as described by Little et al. (Reference Little, O’Connell, Welsh, Mulligan and Ferris2017).
Measurements of cow performance
Ration intakes for each individual cow were recorded daily using the intake recording system described earlier. Cows were milked twice daily, between 0530 and 0700 h, and 1530 and 1700 h, through a 50-point rotary milking parlor. Individual cow milk yields were automatically recorded at each milking and a mean daily milk yield was calculated for each cow on a weekly basis.
On the same day each week throughout the study, milk samples were obtained from two consecutive milkings (am and pm separately), a preservative tablet added (Broad Spectrum Microtabs II; D and F Control Systems, Norwood, MA, USA), and samples stored at 4°C until analyzed. Samples were analyzed for fat and protein content by Fourier transform IR spectroscopy. The instrument used was a Standard Lactoscope FT-MIR automatic (Delta Instruments, Drachten, The Netherlands), with fat and protein contents predicted using the models provided by the manufacturer. A weighted milk composition was subsequently calculated for each sampling occasion. In addition, on one occasion each month, samples from two consecutive milkings, bulked in proportion to yield, were collected and somatic cell count (SCC) measured using flow cytometry (SomaScope; Delta Instruments). Cow BW were recorded twice daily and cow BCS were recorded weekly as described by Little et al. (Reference Little, O’Connell, Welsh, Mulligan and Ferris2017). Mean daily ME requirements were calculated as described by Little et al. (Reference Little, O’Connell, Welsh, Mulligan and Ferris2017), whereas energy–corrected milk yield (ECMY) were calculated using (MEmilk/3.1). Vaginal mucus was assessed and scored by a single operator at weeks 2 (11 to 17 days), 3 (18 to 24 days) and 4 (25 to 31 days) postpartum, as described in detail by Little et al. (Reference Little, O’Connell, Welsh, Mulligan and Ferris2017). Briefly, vaginal mucus was accessed for color, proportion and volume of pus, and a character score assigned as follows: (0) clear or translucent mucus; (1) mucus containing flecks of white or off-white pus; (2) <50 ml exudate containing ≤50% white or off-white mucopurulent material; and (3) >50 ml exudate containing purulent material, usually white or yellow, but occasionally sanguineous. The vaginal mucus was also assessed for odor, and given a score 0 for normal odor or a score of 1 if a fetid odor was detected.
Blood measurements
Blood biochemistry
Blood samples were collected at weeks 1 (4 to 10 days), 2 (11 to 17 days), 3 (18 to 24 days), 4 (25 to 31 days), 5 (32 to 38 days), 6 (39 to 45 days) and 10 (67 to 73 days) postpartum, for the measurement of albumin, BHB, glucose, globulin, NEFA, total protein and urea concentrations. These were stored and analyzed on a Randox Imola chemistry analyzer system (Randox, County Antrim, UK), as described in detail by Little et al. (Reference Little, O’Connell, Welsh, Mulligan and Ferris2017).
Neutrophil phagocytic and oxidative burst measurements
An additional blood sample was collected in a lithium heparin tube (BD, Oxford, UK) at weeks 1 (6 to 8 days), 2 (13 to 15 days) and 3 (20 to 22 days) postpartum for the measurement of the in vitro phagocytic capacity and oxidative burst activity of neutrophils. The test and control samples were processed in duplicate within 3 h of collection, using Phagotest and Phagoburst kits, respectively (Orpegen Pharma GmbH, Heidelberg, Germany), with modifications to manufacturer’s instructions as described in detail by Little et al. (Reference Little, O’Connell, Welsh, Mulligan and Ferris2017). These were then analyzed in duplicate by flow cytometric analysis. A live gate identifying the neutrophil population was set using the forward and side scatter properties of these cells, and the corresponding green fluorescence histogram (FL1) was analyzed. The control sample was used to set a threshold for fluorescence so that only 1% to 3% of the acquired events were positive. The number of events above this threshold was counted as the percentage of neutrophils actively carrying out phagocytosis or oxidative burst. The mean fluorescence intensity (MFI) correlates to the number of bacteria phagocytosed by each cell, or the mean oxidative burst activity by a single cell. The phagocytic or oxidative burst index is the percentage of active neutrophils multiplied by the fluorescence intensity.
Interferon-γ production
An additional blood sample was collected in a lithium heparin tube at weeks 1 (6 to 8 days), 2 (13 to 15 days), 3 (20 to 22 days), 4 (27 to 29 days), 5 (34 to 36 days) and 6 (41 to 43 days) postpartum for the ELISA measurement of IFN-γ production from stimulated lymphocytes, as described in detail by Little et al. (Reference Little, O’Connell, Welsh, Mulligan and Ferris2017). Briefly, whole blood samples were incubated for 24 h at 37°C and 5% carbon dioxide with phosphate buffered saline as a negative control to look at the inherent IFN-γ level, and also with pokeweed mitogen (PWM) used as a positive stimulant of peripheral blood mononuclear cells to produce IFN-γ.
Statistical analysis
Two multiparous cows were removed from the experiment (one due to a chronic displaced abomasum and one due to injury), and their data excluded from the statistical analysis, leaving 14 multiparous cows and six primiparous cows on LC and MC, and 15 multiparous cows and six primiparous cows on HC. Data were analyzed using GenStat version 16.2 (VSN International, Oxford, UK). Data describing BW change to nadir, days to nadir BW, BW change to day 70, BCS and the flow cytometric analysis of neutrophil phagocytosis and oxidative burst were analyzed using ANOVA with treatment and parity (primiparous or multiparous) as factors. Where significant in the model, appropriate pre-experimental variables were included as covariates when analyzing corresponding dependent variables. Where P<0.05 for the fixed effect of treatment, differences between treatments were tested using Fisher’s protected adjusted multiple comparisons. Data describing DMI, milk yield, milk composition, somatic cell score (loge transformed SCC to make the data normally distributed), mean BW, mean daily EB, serum and plasma biochemistry and IFN-γ production were analyzed using repeated measures residual maximum likelihood analysis. The mixed model used included the following terms as fixed effects: treatment+week+parity+(treatment×week)+(parity×week)+(treatment×parity). Cow within week were included as random effects, to which an antidependence order 1 covariance structure was applied. Parity was categorized as primiparous or multiparous. Where significant in the model, appropriate pre-experimental variables were included as covariates in the mixed model. For multiparous cows, milk yield was analyzed with the addition of previous lactation 305-day milk yield in the model. Similarly, for multiparous cows, milk fat composition, milk CP composition, fat yield, CP yield, fat+protein yield, and mean BW were analyzed with the addition of previous lactation fat composition, CP composition, fat yield, CP yield, fat+protein yield and pre-experimental BW, respectively, in the model. The absence of data for primiparous animals for these variables meant that ‘actual’ previous lactation data could not be used for multiparous cows. Rather, for each variable, a covariate value for each multiparous cow within each treatment was calculated as the difference between the value for each individual cow during the previous lactation, and the mean value for all cows on that treatment during the previous lactation, with a value of ‘zero’ used for primiparous cows. Residual plots were used to check the normality assumption and homogeneity of variance for model validity. Where P<0.05 for the fixed effect of treatment in the F-test, differences between treatments were tested using Fisher’s unprotected LSD test. The relationships between mean weekly immune parameters (IFN-γ, neutrophil phagocytic index and neutrophil oxidative burst index) and mean weekly EB, ECMY, serum NEFA and BHB, and plasma glucose concentrations were evaluated using simple linear regression analysis and differences were considered statistically significant when P<0.05. Data describing vaginal mucus scores at each week were analyzed using GLM regression analysis with the logit link function. The model included treatment as a term and significance was identified using χ 2 testing. Vaginal mucus score data were translated into one integer; 0=0, 0; 1=1, 0; 2=2, 0; 3=3, 0; 4=2, 1; 5=3, 1, and for analysis were grouped into two categories, ≤1 and >1.
Results
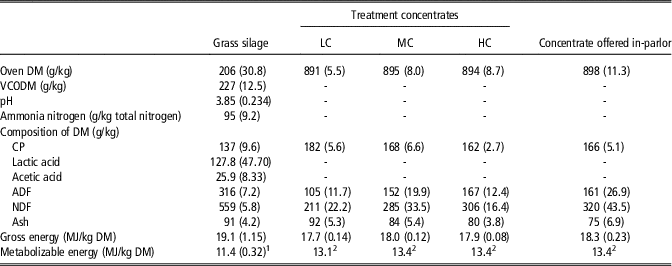
The grass silage offered was of good quality and was well fermented (Table 2). The concentrates offered differed in CP content so that the mixed rations would be isonitrogenous. This was achieved, with rations offered with LC, MC and HC having CP contents of 152, 152 and 154 g/kg DM, while the calculated ME content was 12.0, 12.4 and 12.8 MJ/kg DM, respectively. Rations offered with LC, MC and HC were calculated (using FeedByte® version 3.78) to supply 1556, 1997 and 2420 g effective rumen degradable protein (ERDP)/cow per day, and 559, 733 and 888 g digestible undegradable protein (DUP)/cow per day, compared with requirements of 1235, 1700 and 2175 g ERDP/cow per day, and 790, 788 and 875 g DUP/cow per day. Similarly, rations with LC, MC and HC were calculated to supply 1346, 1817 and 2275 g MP/cow per day, compared with requirements of 1577, 1872 and 2262 g MP/cow per day. Thus only HC was calculated to fully meet the DUP and MP requirements of the cows.
The chemical compositions (and standard deviation in parentheses) of the grass silage and concentrates offered to Holstein Friesian dairy cows during the study

LC=low concentrate; MC=medium concentrate; HC=high concentrate; DM=dry matter; VCODM=volatile-corrected oven dry matter.
1 Predicted using near infrared reflectance spectroscopy.
2 Calculated from standard values.
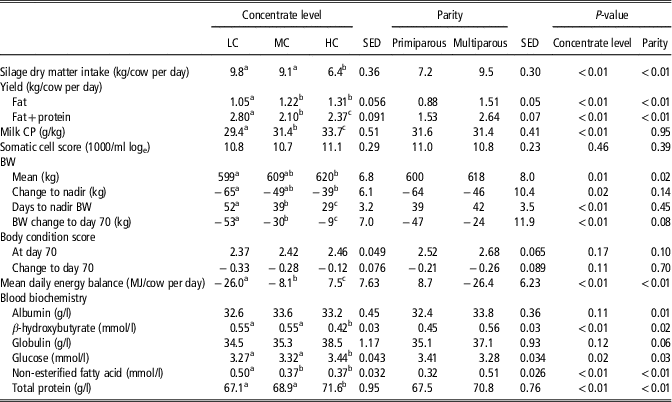
Cows on LC and MC had a higher silage DMI (P<0.01) than those on HC, while multiparous cows had a higher silage DMI (P<0.01) than primiparous cows (Table 3). Cows on LC had a lower milk fat yield than those on MC and HC (P<0.01), while multiparous cows had a higher milk fat yield (P<0.01) than primiparous cows. Milk fat+protein yield increased from LC to HC (P<0.01), while multiparous cows had a higher milk fat+protein yield (P<0.01) than primiparous cows. Milk CP content increased (P<0.01) from LC to HC, while milk CP content (P=0.95) was unaffected by parity. Milk somatic cell score was unaffected by treatment (P=0.46) and parity (P=0.39). Cows on HC had a higher mean BW (P=0.01) than those on LC, while multiparous cows had a higher BW (P=0.02) than primiparous cows. Cows on HC had a lower BW change to nadir (P=0.02) than those on LC, while BW change to nadir (P=0.14), was unaffected by parity. Days to nadir BW (P<0.01) decreased from LC to HC, while days to nadir BW (P=0.45) was unaffected by parity. Body weight change to day 70 (P<0.01) decreased from LC to HC, while multiparous cows tended to lose less BW to day 70 (P=0.08) than primiparous cows. Treatment did not affect BCS at day 70 (P=0.17) nor BCS change to day 70 (P=0.11), while parity did not affect BCS at day 70 (P=0.10) or BCS change to day 70 (P=0.70). Mean daily negative EB decreased from LC to HC (P<0.01), while multiparous cows had a negative mean daily EB compared with a positive mean daily EB in primiparous cows (P<0.01). There was no difference in serum albumin (P=0.11) and globulin concentrations (P=0.12) between treatments. Cows on HC had a lower serum BHB concentration (P<0.01), higher plasma glucose concentration (P=0.02), and higher serum total protein concentration (P<0.01) than those on MC and LC, while cows on LC had a higher serum NEFA concentration (P<0.01) than those on MC and HC. Multiparous cows had a higher serum albumin (P=0.01), BHB (P=0.02), NEFA (P<0.01), and total protein concentration (P<0.01), tended to have a higher serum globulin concentration (P=0.06), and had a lower plasma glucose concentration (P=0.03). There were no significant (P<0.05) concentrate level×parity interactions for any of the parameters presented in Table 3.
Effects of concentrate inclusion level in the mixed ration (LC, MC, HC) on dry matter intake, milk production, milk CP, somatic cell score, BW, body condition score, energy balance, and on serum and plasma biochemistry during the first 70 days of lactation of Holstein Friesian dairy cows

LC=low concentrate; MC=medium concentrate; HC=high concentrate.
a,b,cMeans with different superscripts, within a row, differ (P<0.05).
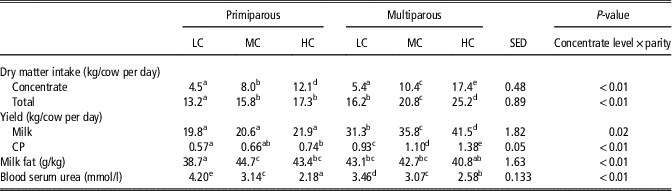
There was a significant treatment×parity interaction for concentrate DMI (P<0.01), total DMI (P<0.01), milk yield (P=0.02), milk CP yield (P<0.01), milk fat composition (P<0.01) and blood serum urea concentration (P<0.01) (Table 4). For each of concentrate DMI, total DMI and CP yield, values increased with increasing concentrate inclusion level, while the magnitude of the increase was greater with multiparous than primiparous cows. Concentrate level had no effect on milk yield of primiparous cows (P>0.05), whereas milk yield of multiparous cows increased with increasing concentrate level (P=0.02). With primiparous cows, LC had a lower milk fat composition than MC and HC, while with multiparous cows, milk fat composition was unaffected by concentrate level (P>0.05). Blood serum urea concentrations decreased with increasing concentrate levels, with the magnitude of this decrease greatest with primiparous cows (P<0.01).
Effects of concentrate inclusion level in the mixed ration (LC, MC, HC) on concentrate and total dry matter intake, milk and CP yield, milk fat content and serum urea concentration during the first 70 days of lactation of Holstein Friesian dairy cows

LC=low concentrate; MC=medium concentrate; HC=high concentrate.
a,b,c,d,eMeans with different superscripts, within a row, differ (P<0.05).
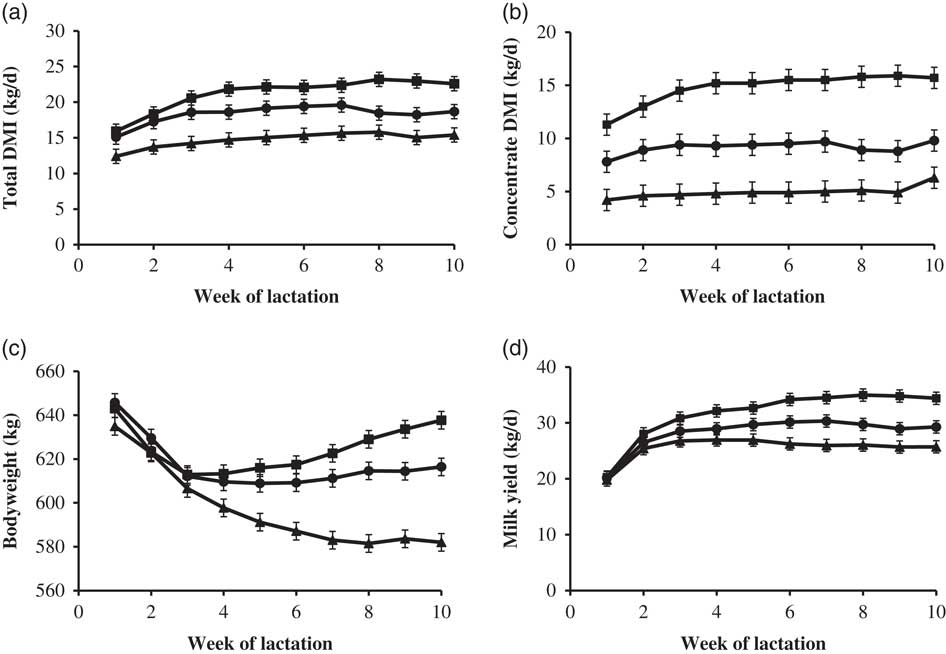
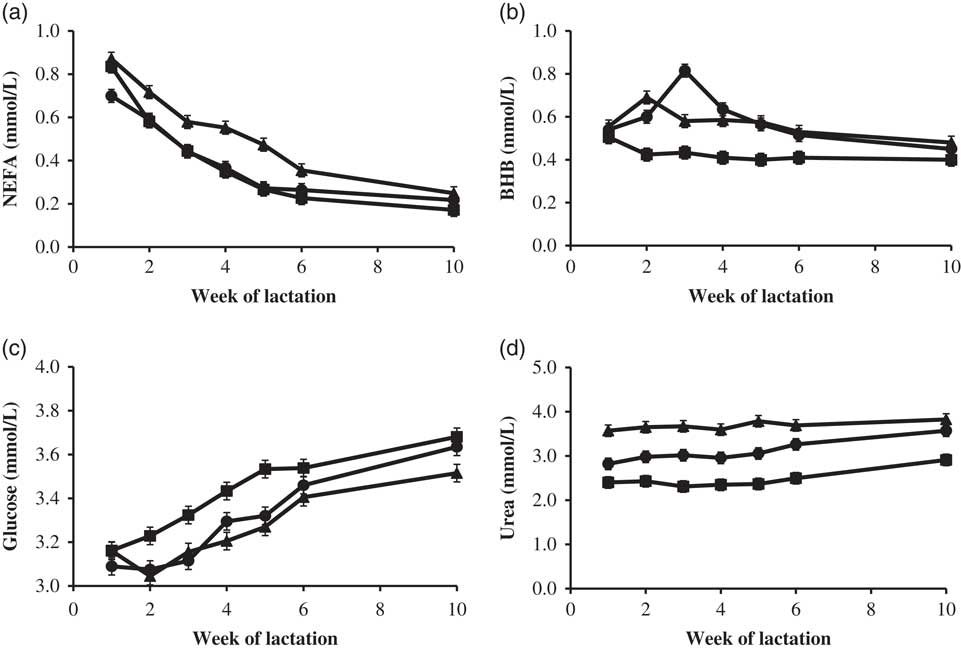
All the parameters presented in Tables 3 and 4 changed with time (P<0.05), with the changes in total DMI, concentrate DMI, BW and milk yield presented in Figure 1. There was a significant treatment×time interaction (P<0.05) for total DMI, concentrate DMI, milk yield, CP yield, fat+protein yield, mean BW, BHB, globulin and total protein. At weeks 1 and 2, cows on LC had a lower total DMI than cows on MC and HC, whilst at weeks 3 to 10 total DMI increased from LC to HC (P<0.05; Figure 1a). At weeks 1 to 10, concentrate DMI increased from LC to HC (P<0.05; Figure 1b). At weeks 5 and 6, cows on LC had a lower BW than cows on HC, at week 7 cows on LC had a lower BW than cows on MC and HC, whilst at weeks 8 to 10 BW increased from LC to HC (P<0.05; Figure 1c). At weeks 3 to 5 cows on LC had a lower milk yield than cows on HC, whilst at weeks 6 to 10 milk yield increased from LC to HC (P<0.05; Figure 1d). At weeks 2 to 5 cows on LC had a lower CP yield than cows on HC, at weeks 6 and 7 cows on LC had a lower CP yield than cows on MC and HC, whilst at weeks 8 to 10 CP yield increased from LC to HC (P<0.05). At weeks 2 to 4 cows on LC had a lower fat+protein yield than cows on HC, whilst at weeks 5 to 10 fat+protein yield increased from LC to HC (P<0.05). The changes in serum NEFA, BHB, urea and plasma glucose concentrations over time are presented in Figure 2. At week 2, serum BHB increased from HC through LC, at week 3 cows on MC had a higher BHB than cows on LC which had a higher BHB than cows on HC. At weeks 4, 5 and 6 cows on MC and LC had a higher BHB than cows on HC, while at week 10 cows on LC had a higher BHB than cows on HC (P<0.05; Figure 2b). At weeks 4 and 5 cows on HC had a higher serum globulin than cows on LC, at week 6 serum globulin increased from LC through HC, while at week 10 cows on HC had a higher globulin than cows on MC and LC (P<0.05). At week-5 cows on HC had a higher total protein than cows on LC, while at weeks 6 and 10 cows on HC had a higher total protein than cows on MC and LC (P<0.05).
Effects of concentrate inclusion level in the mixed ration (low,  ; medium,
 ; and high,
 ) on (a) total dry matter intake (DMI), (b) concentrate DMI, (c) BW and (d) mean daily milk yield of Holstein Friesian dairy cows. Data presented are the mean data each week, with error bars representing the SEM.

Effects of concentrate inclusion level in the mixed ration (low, ; medium, ; and high, ) on (a) serum non-esterified fatty acid (NEFA) concentration, (b) serum β-hydroxybutyrate (BHB) concentration, (c) plasma glucose concentration and (d) serum urea concentration of Holstein Friesian dairy cows. Data presented are the mean data each week, with error bars representing the SEM.

Concentrate inclusion level had no statistical difference on the probability of obtaining different vaginal mucus scores at weeks 2, 3 or 4 of lactation (P=0.87, 0.53 and 0.19, respectively).
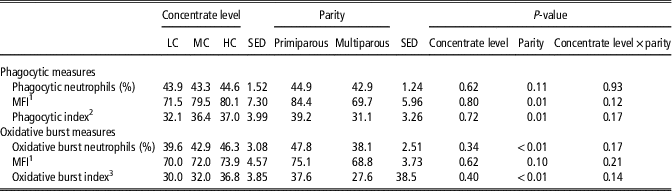
There were no significant (P>0.05) concentrate level×time interactions for any of the neutrophil function parameters examined, and as such only the main effects of treatment and parity over the three measurement periods are presented in Table 5. Concentrate inclusion level had no effect (P>0.05) on the percentage of phagocytic neutrophils, the phagocytic MFI or the phagocytic index of neutrophils, the percentage of oxidative burst neutrophils, the oxidative burst MFI or the oxidative burst index of neutrophils (Table 5). While the percentage of phagocytic neutrophils was unaffected by parity (P=0.11), primiparous cows had a higher MFI of phagocytic neutrophils (P=0.01), phagocytic index (P=0.01), percentage of oxidative burst neutrophils (P<0.01), oxidative burst index (P<0.01) and tended to have a higher MFI of oxidative burst neutrophils (P=0.10) compared with multiparous cows (Table 5). While the oxidative burst measures did not change with time, the percentage of phagocytic neutrophils (45.7, 44.3 and 41.7; P=0.01), MFI of phagocytic neutrophils (94.8, 73.3 and 63.0; P<0.01) and phagocytic index (44.1, 33.5 and 27.9; P<0.01) all decreased with time from calving (values, for weeks 1, 2 and 3 post-calving, respectively).
Effects of concentrate inclusion level in the mixed ration (LC, MC, HC) on the mean phagocytic and oxidative burst measures of neutrophils during the first 3 weeks postpartum of Holstein Friesian dairy cows

LC=low concentrate; MC=medium concentrate; HC=high concentrate.
1 MF=Imean fluorescence intensity (×1000).
2 Phagocytic index[(% phagocytic neutrophils)×(MFI)]/100.
3 Oxidative burst index=[(% oxidative burst neutrophils)×(MFI)]/100.
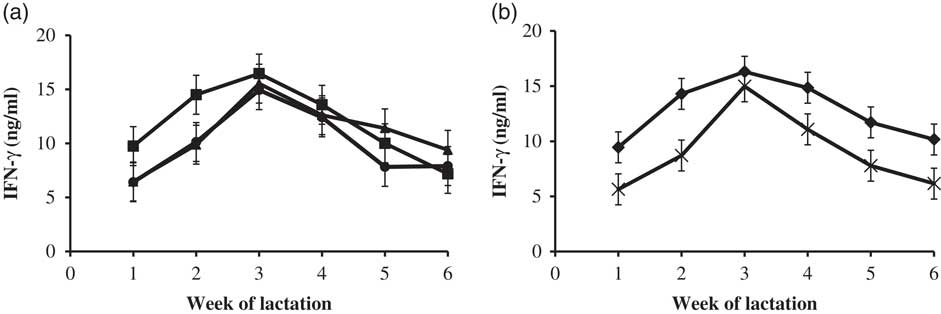
Although treatments had no statistically significant effect (P>0.05) on the IFN-γ production by PWM stimulated whole blood culture, IFN-γ production changed over time (P<0.01), reaching a peak at week 3 post-calving and then decreased during weeks 4, 5 and 6. However, there was no treatment×time interaction (P>0.05; Figure 3a). Although multiparous cows had a higher (P<0.01) IFN-γ production than primiparous cows, IFN-γ production increased to a peak at week 3 and then decreased (P<0.01), whereas there was no treatment×time interaction (P>0.05; Figure 3b).
Effects of (a) concentrate inclusion level in the mixed ration (low, ; medium, ; and high, ; treatment, SED=2.06, P=0.31; time, SED=1.21, P<0.01; treatment×time, SED=2.58, P=0.18), and (b) parity ( multiparous,
 primiparous; parity, SED=1.68, P<0.01; time, SED=1.21, P<0.01; parity×time, SED=2.00, P=0.44) on the mean interferon gamma (IFN-γ) production of whole blood due to pokeweed mitogen stimulation of Holstein Friesian dairy cows. Data presented are the mean data each week, with error bars representing the SEM.

Linear regression analysis identified no significant (P<0.05) relationships or strong model fit (R 2>0.25) between EB and IFN-γ production, ECMY and IFN-γ production, NEFA and IFN-γ production, or BHB and IFN-γ production. There was a positive relationship between plasma glucose and neutrophil phagocytic index (R 2=0.27, P<0.01) at week 1 of lactation. No significant relationships were identified between neutrophil function and any of the parameters examined (P>0.05).
Discussion
As the milk price to concentrate cost ratio changes in response to volatility in global dairy markets and fluctuations in the costs of feed ingredients, concentrate inclusion levels in dairy cow diets are often adjusted to ensure that an economic milk production response is achieved. While the impact of changes in concentrate levels on cow performance is well known, their impact on other biological parameters such as immune function have received much less focus in vivo. Thus, the objectives of the current study were to investigate the effect of concentrate inclusion level in a grass silage-based diet on immune function of early lactation Holstein Friesian cows.
Dry matter intake, milk production and BW changes
With multiparous cows, total DMI increased as concentrate inclusion level in the diet increased, in agreement with others (Ferris et al., Reference Ferris, Gordon, Patterson, Mayne and Kilpatrick1999; Sterk et al., Reference Sterk, Johansson, Taweel, Murphy, van Vuuren, Hendriks and Dijkstra2011; McCarthy et al., Reference McCarthy, Yasui, Ryan, Mechor and Overton2015a). This increase in DMI was expected as a decrease in the forage component of the ration generally decreases the restriction on rumen fill and allows total DMI to increase (Allen, Reference Allen2000). However, with primiparous cows, total DMI increased between LC and MC but not with HC, with this consistent with the fact that milk yield of primiparous cows did not increase with increasing concentrate level, while CP yield increased to a lesser extent with primiparous than multiparous cows. With multiparous cows, as concentrate inclusion level in the diet increased, there was associated with an increase in milk yield, and milk CP yield. The increase in milk CP content as concentrate inclusion level increased was likely due to increased microbial protein synthesis (Jenkins and McGuire, Reference Jenkins and McGuire2006). Although a reduction in milk fat content has been reported with higher concentrate (higher starch, lower NDF) rations (Ferris et al., Reference Ferris, Gordon, Patterson, Mayne and Kilpatrick1999; Sterk et al., Reference Sterk, Johansson, Taweel, Murphy, van Vuuren, Hendriks and Dijkstra2011), the opposite was observed with primiparous cows in the current study, while milk fat of multiparous cows was unaffected by concentrate level. However, the effect of concentrate level on milk fat content can be inconsistent, with Machado et al. (Reference Machado, McManus, Stumpf and Fischer2014) and Rabelo et al. (Reference Rabelo, Rezende, Bertics and Grummer2003) both observing milk fat content to be unaffected by concentrate level. The increase in serum total protein with cows on HC was driven by the numerical increase in serum globulin, however, these values remain within normal reference ranges (Radostits et al., Reference Radostits, Gay, Hinchcliff and Constable2007).
As the concentrate inclusion level in the diet increased, the extent of negative EB decreased, while cows on HC had a shorter duration of negative EB compared with cows on MC and LC. This improved EB as concentrate inclusion level increased was manifested in lower body tissue mobilization (lower BW loss, lower serum NEFA and BHB concentrations, and a tendency for a lower BCS loss), which agrees with the findings of others (Andersen et al., Reference Andersen, Friggens, Sejrsen, Sørensen, Munksgaard and Ingvartsen2003; McCarthy et al., Reference McCarthy, Yasui, Ryan, Pelton, Mechor and Overton2015b). Although postpartum negative EB is a normal physiological occurrence in dairy cows (Grummer et al., Reference Grummer, Mashek and Hayirli2004; Ingvartsen, Reference Ingvartsen2006), a shorter duration and lesser depth of negative EB may minimize the detrimental impacts on immune function, and may result in improved cow health and welfare (Ingvartsen and Moyes, Reference Ingvartsen and Moyes2013; Sordillo, Reference Sordillo2016). In addition to a negative EB, DUP requirements with LC and MC were not fully met (559 and 773 g DUP compared with requirements of 790 and 788 g for LC and MC, respectively) and may have contributed to tissue catabolism with these treatments to help meet the protein requirements of the cow.
Immune function
It was hypothesized that increasing the proportion of concentrates in the diet in early lactation would reduce negative EB and as such, improve immune function. The functional capacity of blood neutrophils were evaluated as effective neutrophil function is required to resolve bacterial infections that occur in early lactation, such as mastitis and metritis (Paape et al., Reference Paape, Mehrzad, Zhao, Detilleux and Burvenich2002; Sheldon et al., Reference Sheldon, Cronin, Goetze, Donofrio and Schuberth2009). Neutrophil function, EB and uterine disease have been linked, with Galvão et al. (Reference Galvão, Flaminio, Brittin, Sper, Fraga, Caixeta, Ricci, Guard, Butler and Gilbert2010) demonstrating that cows which developed uterine disease had a greater postpartum negative EB and lower neutrophil intracellular glycogen (needed for neutrophil phagocytosis and microbial killing) than healthy cows. However, despite significant differences in EB across the three treatments in the current study, concentrate inclusion level did not influence circulating neutrophil physiology as measured by phagocytic or oxidative burst capacity. This is perhaps surprising, especially as cows on the LC diet had lower plasma glucose, and higher serum BHB and NEFA concentrations, compared with those on the HC diet, with these changes in metabolic profiles normally associated with reduced neutrophil function (Suriyasathaporn et al., Reference Suriyasathaporn, Heuer, Noordhuizen-Stassen and Schukken2000; Scalia et al., Reference Scalia, Lacetera, Bernabucci, Demeyere, Duchateau and Burvenich2006). However, the differences in EB, plasma glucose, serum BHB and serum NEFA concentrations between treatments may not have been sufficiently large to impact on neutrophil function. A similar finding was observed in a recent study (McCarthy et al., Reference McCarthy, Yasui, Ryan, Mechor and Overton2015a and Reference McCarthy, Yasui, Ryan, Pelton, Mechor and Overton2015b; Yasui et al., Reference Yasui, McCarthy, Ryan, Gilbert, Felippe, Mechor and Overton2016) in which cows offered a high starch ration had improved early lactation EB and higher plasma glucose concentrations, lower serum NEFA and BHB concentrations (compared with cows offered a low starch ration), but yet cell physiology, as measured by neutrophil phagocytosis and oxidative burst, did not differ between treatments. In addition, neutrophil function has been shown to decline around calving, with nadir function a few days before (Kimura et al., Reference Kimura, Goff and Kehrli1999) or after (Gilbert et al., Reference Gilbert, Gröhn, Miller and Hoffman1993) parturition, remaining low for ~15 days postpartum, before increasing until at least 6 weeks postpartum (Gilbert et al., Reference Gilbert, Gröhn, Miller and Hoffman1993). However, a depression in neutrophil function at the time of calving does not always occur (Llamas Moya et al., Reference Llamas Moya, Alonso Gómez, Boyle, Mee, O’Brien and Arkins2008; Little et al., Reference Little, O’Connell, Welsh, Barley, Meade and Ferris2016), with the current study showing neutrophil phagocytic function to decline during the first 3 weeks postpartum. This occurs despite serum BHB and NEFA concentrations decreasing and serum glucose concentrations increasing with time postpartum, with these changes in the metabolic profile normally associated with improved measures of neutrophil function (Suriyasathaporn et al., Reference Suriyasathaporn, Heuer, Noordhuizen-Stassen and Schukken2000; Scalia et al., Reference Scalia, Lacetera, Bernabucci, Demeyere, Duchateau and Burvenich2006).
Lymphocyte physiology, as measured by the functional ability to produce the cytokine IFN-γ was also examined using PWM in a whole blood culture. Interferon γ is a cytokine that is synthesized by activated T-lymphocytes and functions to enhance immune surveillance and activate the cellular immune response during infection (Schroder et al., Reference Schroder, Hertzog, Ravasi and Hume2004), while reduced IFN-γ production is associated with increased susceptibility to infectious diseases (Nonnecke et al., Reference Nonnecke, Kimura, Goff and Kehrli2003). The current study provides no evidence that an increase in negative EB in early lactation had a detrimental effect on lymphocyte function. With regards IFN-γ production, there is conflicting evidence that lymphocyte function is influenced by metabolites associated with negative EB. For example, an in vitro study by Ster et al. (Reference Ster, Loiselle and Lacasse2012) demonstrated that incubating isolated peripheral blood mononuclear cells in an environment comprising an increasing NEFA concentration, resulted in decreasing IFN-γ production. Similarly, Loiselle et al. (Reference Loiselle, Ster, Talbot, Zhao, Wagner, Boisclair and Lacasse2009) demonstrated increased IFN-γ production at days 5 and 14 postpartum when cows had a lower serum NEFA concentrations. However, in agreement with the outcomes of the current study which involved a direct measure of cell physiology, Carbonneau et al. (Reference Carbonneau, de Passillé, Rushen, Talbot and Lacasse2012) observed no increase in IFN-γ production in cows with an improved EB (as demonstrated by lower serum NEFA concentrations) in early lactation. This may be due to the relatively small difference (0.13 mmol/l) in mean serum NEFA concentration between LC and HC in the current study. In addition, no relationships were identified between serum NEFA and IFN-γ production in the current study, perhaps a reflection of the BCS of the cows on the study. For example, Lacetera et al. (Reference Lacetera, Scalia, Bernabucci, Ronchi, Pirazzi and Nardone2005) observed no relationship between serum NEFA concentration and IFN-γ production in thin (BCS ≤2.5) cows, whereas a negative relationship between serum NEFA and IFN-γ production was observed in medium (2.6<BCS<3.5) and over conditioned (BCS ≤3.5) cows. As the mean BCS of cows in the current study was 2.5, the absence of a relationship between serum NEFA concentration and IFN-γ production is largely in agreement with the findings of Lacetera et al. (Reference Lacetera, Scalia, Bernabucci, Ronchi, Pirazzi and Nardone2005). Immune responses also play an important role in resolving unavoidable bacterial contamination of the uterus that occurs after calving (Sheldon et al., Reference Sheldon, Cronin, Goetze, Donofrio and Schuberth2009). Vaginal mucus scores, which were used to assess the extent of uterine bacterial infection, provided no evidence that concentrate proportion in the diet in early lactation affected the risk of uterine infection. These observations are consistent with the study by Yasui et al. (Reference Yasui, McCarthy, Ryan, Gilbert, Felippe, Mechor and Overton2016), in which rations that supplied different starch levels and altered EB in early lactation had no effect on the incidence of cytological endometritis.
Given the link between increasing NEFA concentrations in the cell environment, and decreasing IFN-γ production (Ster et al., Reference Ster, Loiselle and Lacasse2012), it might have been expected that IFN-γ production would continue to rise throughout the 6-week measurement period. However, IFN-γ production in the current study increased from calving until week 3 postpartum, before declining, in common with the findings of Little et al. (Reference Little, O’Connell, Welsh, Barley, Meade and Ferris2016). In addition, Heiser et al. (Reference Heiser, McCarthy, Wedlock, Meier, Kay, Walker, Crookenden, Mitchell, Morgan, Watkins, Loor and Roche2015) reported a reduction in IFN-γ messenger RNA expression around calving, which overshot to increased levels 2 weeks postpartum, before falling.
Although it is well known that a deficiency of protein impairs immune function and increases susceptibility to infectious diseases in humans (Li et al., Reference Li, Yin, Li, Kim and Wu2007), much less is known about the relationship between protein supply and immune function in animals. Increasing dietary protein supply increased intestinal mucosal mast cells and eosinophils, and significantly reduced the worm burden in rats (Jones et al., Reference Jones, Houdijk, Sakkas, Bruce, Mitchell, Knox and Kyriazakis2011), while increasing the dietary protein supply in sheep increased local leukocytes and IgE antibodies against gastrointestinal nematode parasites (Houdijk et al., Reference Houdijk, Kyriazakis, Jackson, Huntley and Coop2005). Although diets offered to cows on LC and MC were deficient in metabolizable protein (1346 and 1817 g MP/cow per day compared with requirements of 1577 and 1872 g for LC and MC, respectively), the potential impact of this on the immune function of cows on these treatments is unknown. Recognizing the absence of information on this issue, both Dann and Ji (Reference Dann and Ji2013) and Roche et al. (Reference Roche, Bell, Overton and Loor2013) have advocated further research on the effects of dietary protein level, protein type and essential amino acids, on cow health and immunity during the transition period and in early lactation.
Multiparous cows had a lower phagocytic MFI, phagocytic index, percentage of oxidative burst neutrophils and oxidative index, compared with primiparous cows. This lower neutrophil function in multiparous cows is consistent with the limited information published previously. For example, neutrophils from multiparous cows had lower superoxide anion production (Gilbert et al., Reference Gilbert, Gröhn, Miller and Hoffman1993) and lower mean oxidative burst activity (Llamas Moya et al., Reference Llamas Moya, Alonso Gómez, Boyle, Mee, O’Brien and Arkins2008), compared with those from primiparous cows. However, regarding the acquired immune function, multiparous cows had a higher production of the lymphocyte cytokine IFN-γ after stimulation, compared with primiparous cows, in agreement with others (Lessard et al., Reference Lessard, Gagnon, Godson and Petit2004; O’Driscoll et al., Reference O’Driscoll, Olmos, Llamas Moya, Mee, Earley, Gleeson, O’Brien and Boyle2012). An increased IFN-γ production is associated with a heightened immune surveillance and function during infection (Schroder et al., Reference Schroder, Hertzog, Ravasi and Hume2004) and increased resistance to infectious diseases (Nonnecke et al., Reference Nonnecke, Kimura, Goff and Kehrli2003). Thus, these findings suggest that during early lactation, multiparous cows have a greater decrease in cellular immunity but a lesser decrease in humoral immunity, compared with primiparous cows. This may have negative implications for disease in multiparous cows, as the main infectious challenge in early lactation, such as those responsible for mastitis (Paape et al., Reference Paape, Mehrzad, Zhao, Detilleux and Burvenich2002) and metritis (Sheldon et al., Reference Sheldon, Cronin, Goetze, Donofrio and Schuberth2009) are bacterial in origin.
In summary, this study demonstrates that increasing concentrate inclusion level in a grass silage-based mixed ration resulted in an increase in total DMI, milk yield, milk protein composition, and yields of fat and protein. With the higher concentrate inclusion level, EB also increased, with an associated reduction in tissue mobilization as evidenced by less BW and BCW loss and lower serum NEFA and BHB concentrations. However, in contrast to the hypothesis, a lower concentrate inclusion level in early lactation had no impact on immune function as measured by neutrophil phagocytosis and oxidative burst, and lymphocyte IFN-γ production.
Acknowledgments
This study was funded by The European Union FP7 programme (2007–13) under Grant Agreement Number 613 689, within the project ‘Genotype plus Environment’ (GplusE) with co-funding was provided by the Department of Agriculture, Environment and Rural Affairs, Northern Ireland. Thanks are due to the Dairy Unit staff at the AFBI Hillsborough for care of the experimental animals and for assisting with experimental measurements, the laboratory staff in AFBI Hillsborough for undertaking milk and feed analysis, and to the staff in AFBI Veterinary Sciences Division for assisting with immune analysis. Mark Little acknowledges the receipt of a PhD studentship from AgriSearch.
Declaration of interest
The authors declare that the research was conducted in the absence of any commercial or financial relationships that could be construed as a potential conflict of interest.
Ethics statement
All procedures described in this paper were approved by the animal research ethics committee at the Agri-Food and Biosciences Institute, Hillsborough and were conducted under an experimental license granted by the Department of Health, Social Services & Personal Safety for Northern Ireland, in compliance with the United Kingdom Animals (Scientific Procedures) Act 1986.
Software and data repository resources
None of the data or models were deposited in an official repository.