


Prominent data-gathering enterprises survey experts to collect data on concepts that are difficult to directly measure (Bakker et al., Reference Bakker, de Vries, Edwards, Hooghe, Jolly, Polk, Rovny, Steenbergen and Vachudova2012; Norris et al., Reference Norris, Frank and Martínez i Coma2013; Coppedge et al., Reference Coppedge, Gerring, Knutsen, Lindberg, Skaaning, Teorell, Altman, Bernhard, Fish, Cornell, Dahlum, Gjerløw, Glynn, Hicken, Krusell, Lührmann, Marquardt, McMann, Mechkova, Medzihorsky, Olin, Paxton, Pemstein, Pernes, von Römer, Seim, Sigman, Staton, Stepanova, Sundström, Tzelgov, Wang, Wilson and Ziblatt2018). However, the standard mean-plus-standard deviation (MpSD) approach to aggregating these data cannot account for variation in either expert scale perception (differential item functioning, DIF) or stochastic error (Marquardt and Pemstein, Reference Marquardt and Pemstein2018; Castanho Silva and Littvay, Reference Castanho Silva and Littvay2019; Lindstädt et al., Reference Lindstädt, Proksch and Slapin2020). Recent research therefore suggests that scholars should aggregate such data with either the bootstrapped median (BMed; Lindstädt et al., Reference Lindstädt, Proksch and Slapin2020) or one of two types of latent variable models: Aldrich–McKelvey (A–M) scaling (Aldrich and McKelvey, Reference Aldrich and McKelvey1977; Bakker et al., Reference Bakker, Jolly, Polk and Poole2014) or item-response theory (IRT) models (Clinton and Lewis, Reference Clinton and Lewis2008; Pemstein et al., Reference Pemstein, Marquardt, Tzelgov, Wang, Krusell and Miri2018). The BMed approach is both simple and potentially more robust than MpSD, while latent variable modeling uses more complicated techniques to adjust for DIF and random error.
Although these approaches involve different conceptualizations of the process that translates expert perceptions into survey responses, previous research has generally assumed only one process when assessing the performance of different models (Marquardt and Pemstein, Reference Marquardt and Pemstein2018; Lindstädt et al., Reference Lindstädt, Proksch and Slapin2020). In this paper, we investigate how each method—A–M, IRT, BMed, and the bootstrapped mean (BAvg)—perform under each model's assumed rating process, retaining MpSD for baseline comparison. We do so by creating simulated data in which we vary both the distribution of the latent values and the method by which experts perceive them.
We find that both MpSD and latent variable models with hierarchically clustered DIF (both A–M and IRT) perform similarly in the presence of low expert error. When expert error is high, hierarchical latent variable models outperform MpSD. Although hierarchical A–M and IRT models generally perform similarly, IRT models are often more likely than their A–M counterparts to contain the true values within their uncertainty intervals.
In contrast, non-hierarchical latent variable models tend to underperform their hierarchical counterparts, likely because of data sparseness. BMed only performs as well as hierarchical latent variable models under very specific conditions, and generally underperforms even MpSD and BAvg.
We conclude by discussing the empirical implications of modeling choice, using different techniques to aggregate the Varieties of Democracy (V–Dem) variable “Freedom from Political Killings” (the variable we use as the basis for the simulation studies). Although all aggregations show similar patterns at a high level of analysis, there are substantial differences at lower levels. In particular, MpSD shows extremely high levels of uncertainty, while BMed provides extremely rough estimates of latent concepts. Hierarchical A–M and IRT models provide both finer-grained estimates and tighter uncertainty estimates. In line with the simulation analyses, the main difference between these two latent variable techniques is that IRT models show slightly higher uncertainty.
These findings cumulatively demonstrate that scholars should use hierarchical latent variable models to aggregate expert-coded data, not summary statistics such as the mean or the median. Among hierarchical latent variable models, IRT models appear to be slightly safer than their A–M counterparts.
1. Three models of expert rating
A–M, IRT, and BMed assume different rating processes. A–M assumes that there is a linear correspondence between the latent traits—such as de facto regime characteristics or party ideology—that experts observe and the ordinal ratings they report. A–M thus conceptualizes DIF in terms of intercept shifts and stretches. IRT relaxes the linearity assumption made by A–M, and models the translation between perception and ordinal score using a series of thresholds on the latent scale: if experts perceive a latent value to fall below their lowest threshold they assign the case the lowest possible ordinal score, and so on. Both models assume normally distributed random errors. Although BMed does not derive directly from an explicit model of the rating process, Lindstädt et al. (Reference Lindstädt, Proksch and Slapin2020) posit a specific model that motivates their choice of the median for producing point estimates. Like A–M, their model assumes a linear translation between perceptions and scores, but assumes both a uniform underlying distribution of the true values and uniform error structure that produces truncated errors. That is, the key problem of expert coding is that experts make errors disproportionally at the extremes of the scale.
In this section, we provide brief analytical descriptions of these different frameworks as well as the specific implementations we use in this paper. For more detailed descriptions of the A–M and IRT implementations, see online Appendix A and Marquardt and Pemstein (Reference Marquardt and Pemstein2018); for the Lindstädt et al. (Reference Lindstädt, Proksch and Slapin2020) model, see online Appendix E.
1.1 A–M scaling
We build on the Bayesian A–M approach of Hare et al. (Reference Hare, Armstrong, Bakker, Carroll and Poole2015), using the likelihood:

Here, ${{y_{ctr}}}$ is the ordinal response by expert $r$
 to case $ct$
 ,Footnote 1 $z_{ct}$
 is the latent score for case $ct$
 , $\alpha$
 , $\beta$
 , and $\tau$
 are expert-specific intercept, slope, and variance parameters. These parameters allow for a specific class of cognitive bias and error: $\alpha$
 and $\beta$
 respectively allow expert scale strictness and distance perception to vary, while $\tau$
 allows for inter-expert differences in random error rates.
We estimate values for A–M models using two specifications. In the first, a standard A–M model, we do not cluster parameter values. In the second, we hierarchically cluster $\alpha$ and $\beta$
 parameters by the primary country an expert codes. This second prior specification assumes that rater parameters are more similar within cases than they are across cases: although experts may code multiple countries, shared expertise in a particular country leads experts to translate their perceptions into scores in similar ways.
1.2 Ordinal IRT
In contrast to A–M models, ordinal IRT uses “thresholds” to describe how experts perceive the latent scale. The partial likelihood for an ordinal IRT is:

Again, $z_{ct}$ represents the latent value, which expert $r$
 converts to ordinal values using (1) her $k$
 thresholds, $\gamma$
 ; and (2) the inverse of her stochastic error variance, $\zeta$
 . $\gamma$
 is an IRT corollary of $\alpha$
 and $\beta$
 in A–M models, with less restrictive linearity assumptions; $\zeta$
 serves a similar purpose as the A–M $\tau$
 .
We provide three IRT models with different parameterizations of DIF. These three models allow us to assess the degree to which hierarchical clustering facilitates or hinders estimation in simulated data with different assumptions about DIF. The first model assumes no clustering of DIF; the second that expert DIF clusters only about universal thresholds; and the third that expert DIF is further clustered about the main case an expert codes. In the text, we focus on the first and third models, which are direct corollaries of the A–M models; online Appendix G analyzes differences across IRT clustering strategies.
1.3 Uniform errors
Lindstädt et al. (Reference Lindstädt, Proksch and Slapin2020) motivate the BMed approach by postulating an expert rating process that is largely analogous to the A–M model. However, whereas both A–M and IRT models assume an unbounded interval-scale latent space, they assume that latent values fall on the interval $( l,\; u) \in {\mathbb R}$ . In contrast to standard A–M models, they also assume that expert intercept, slope, and variance parameters are uniformly distributed.
Results in online Appendix E indicate that the key difference between the Lindstädt et al. (Reference Lindstädt, Proksch and Slapin2020) and A–M approach is the assumption about the underlying distribution. We therefore focus on this aspect of their model in the text.
2. Simulation design
We examine the robustness of different modeling strategies to data-generating process (DGP) through simulation analyses. To create ecologically valid simulated data, we follow Marquardt and Pemstein (Reference Marquardt and Pemstein2018) in using the coding structure from the expert-coded V–Dem variable “Freedom from Political Killings” (Coppedge et al., Reference Coppedge, Gerring, Knutsen, Lindberg, Skaaning, Teorell, Altman, Bernhard, Fish, Cornell, Dahlum, Gjerløw, Glynn, Hicken, Krusell, Lührmann, Marquardt, McMann, Mechkova, Medzihorsky, Olin, Paxton, Pemstein, Pernes, von Römer, Seim, Sigman, Staton, Stepanova, Sundström, Tzelgov, Wang, Wilson and Ziblatt2018). To code this variable for a given country-year, experts use a five-point Likert scale with categories ranging from “Political killings are non-existent” to “Political killings are practiced systematically and they are typically incited and approved by top leaders of government.” The simulated data have 1445 experts coding some subset of 26,120 country-years, following the same pattern of the actual experts; true values reflect trends in the data. We vary three aspects of the simulated data: (1) the distribution of the true values, (2) the DGP that converts these values into ratings, and (3) the degree of DIF and variation in expert reliability.Footnote 2 We then analyze the performance of different methods for aggregating expert-coded data in each of the eight possible combinations of these four aspects (two true value distributions $\times$ two models $\times$
 two levels of variation). We replicate the simulations thrice to ensure the robustness of our results.
Most expert-coded variables in the V–Dem dataset have a structure similar to “Freedom from political killings,” the variable we use as the basis for our simulation analyses. The results are thus generalizable to other V–Dem variables and, more broadly, relatively sparse expert-coded data on a Likert scale. More saturated expert-coded data (e.g., data with more than five experts per observation) would likely have less variation in technique performance (Marquardt and Pemstein, Reference Marquardt and Pemstein2018; Lindstädt et al., Reference Lindstädt, Proksch and Slapin2020).
2.1 Distribution of true values
We analyze simulations with two different distributions of true values. The first, normally distributed, matches traditional latent variable modeling assumptions about the underlying data structure (Figure 1, left). For these data, we estimate true country-year values by taking the normalized mean of expert codings for each country-year, weighted by expert self-reported confidence to increase data specificity.
Distribution of true values for simulation studies with normally and uniformly distributed underlying data.
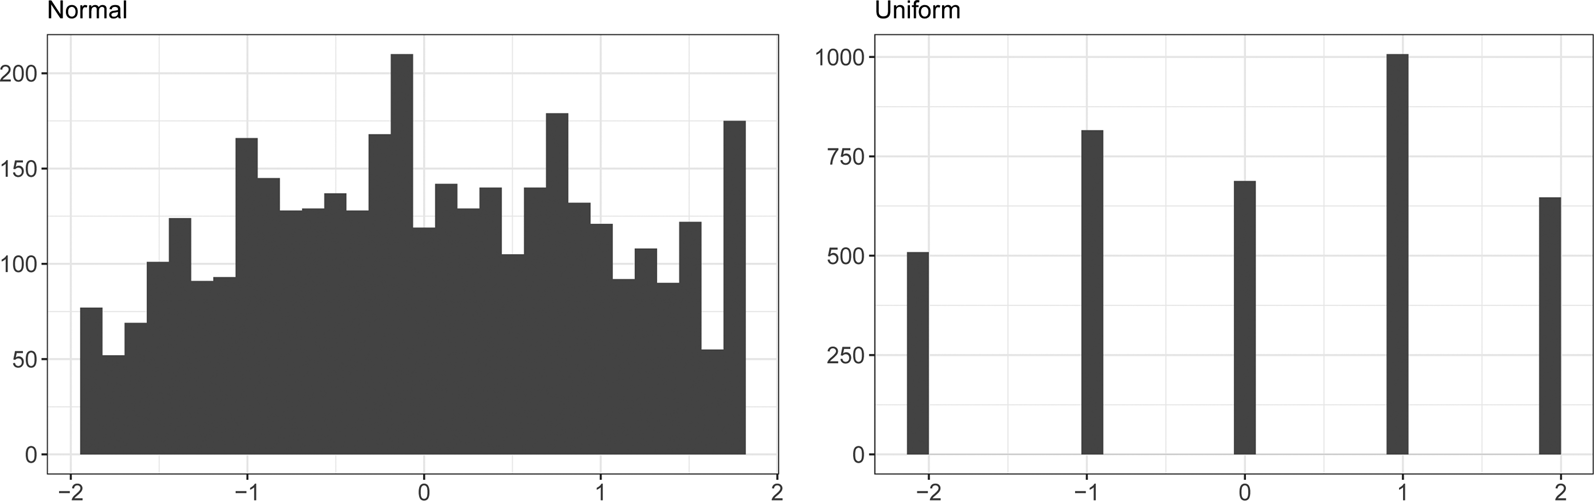
The second, uniformly distributed, follows Lindstädt et al. (Reference Lindstädt, Proksch and Slapin2020) in assuming a truncated uniform distribution (Figure 1, right). To approximate this distribution while maintaining an ecologically valid structure, we convert the scale to the range ($-$ 2, 2) by centering the values at the mid-point (three). We then estimate true country-year values by taking the median of expert codings for each country-year, shifting non-integer values away from the center of the scale (e.g., if the country-year median is 3.5, we assign the country-year a true value of four). This procedure creates true values that are a hard case for models which assume central tendencies in the distribution of true values (e.g., the latent variable models we use here), weakly following the assumption of Lindstädt et al. (Reference Lindstädt, Proksch and Slapin2020) that truncation occurs at the extremes.
2.2 Models for converting true values to observed ratings
We model the process by which experts convert true values to ratings in two ways: A–M scaling, as in Equation 1; and an IRT model, as in Equation 2. To standardize the assumptions of the IRT model with those of A–M scaling, we model experts in the IRT context as having both a consistent linear trend in their scale perception and idiosyncratic variation in their thresholds.Footnote 3
In contrast to Marquardt and Pemstein (Reference Marquardt and Pemstein2018), we assume that there is no hierarchical clustering of simulated DIF.Footnote 4 These simulated data therefore present a harder case for models that include hierarchical clustering.
2.3 Level of DIF and variation in expert reliability
We conduct analyses of simulated data in which error variation (in the form of both DIF and variation in expert reliability) is at low and high levels. Although the first scenario (low DIF and reliability variation) is perhaps optimistic, the second scenario is nightmarish, with DIF often spanning the range of true values.
3. Simulation results
We use the previously described methods for aggregating expert-coded data—MpSD, BAvg, BMed, and latent variable models with hierarchical structures—to recover latent values from the simulated data.Footnote 5 We assess performance with two metrics. First, the mean square error (MSE) of point estimates from the true values provides a measure of the degree to which a given method yields estimates close to the truth.Footnote 6 Second, the proportion of 95 percent highest posterior/bootstrap density intervals that cover the true values (credible region coverage, CRC) allows us to assess the degree to which measures of uncertainty provide appropriate coverage. Better methods have lower MSE and higher CRC.Footnote 7
3.1 Normally distributed true values
Figure 2 presents the results of our simulation studies with low error variation and normally distributed true values. In the figure, the top row represents estimates from simulated data that use an IRT DGP, the bottom an A–M DGP. The left column presents MSE; the right CRC. Within each cell, rows represent different families of models (IRT, BMed, BAvg, and A–M). Within the IRT and A–M families, different shades and shapes represent different DIF clustering structures. Dark gray circles represent models without any hierarchical clustering of DIF, light gray triangles models with two levels of clustering (i.e., at the universal and main-country-coded level). Each point illustrates results from a simulation and thus overlapping simulation estimates are darker. Vertical lines represent estimates from the MpSD approach, which we provide as a benchmark for MSE estimates.
Results from simulation studies with normally distributed true values and low error variation.
Note: Each point represents the relevant statistic, estimated using a given aggregation technique and data from one of three simulated datasets.

The figure reveals four clear findings. First, MpSD, BAvg, and hierarchical latent variable models perform similarly in terms of MSE, regardless of simulated DGP. Second, CRC is higher for hierarchical latent variable models than BAvg, with hierarchical A–M and IRT again performing similarly. Third, non-hierarchical IRT and A–M models underperform their hierarchical equivalents in terms of MSE. Fourth, BMed underperforms both hierarchical latent variable models and BAvg in both MSE and CRC; this poor performance is particularly pronounced when the simulated data are the result of an IRT DGP.
Figure 3 presents results from analyses of simulated data with high error variation. In these cases, hierarchical latent variable models outperform all other models in terms of both MSE and CRC, and there is little difference between hierarchical A–M and IRT models. BMed also performs worse than all models (save non-hierarchical IRT models in A–M-simulated data) in terms of MSE.
Results from simulation studies with normally distributed true values and high error variation.
Note: Each point represents the relevant statistic, estimated using a given aggregation technique and data from one of three simulated datasets.
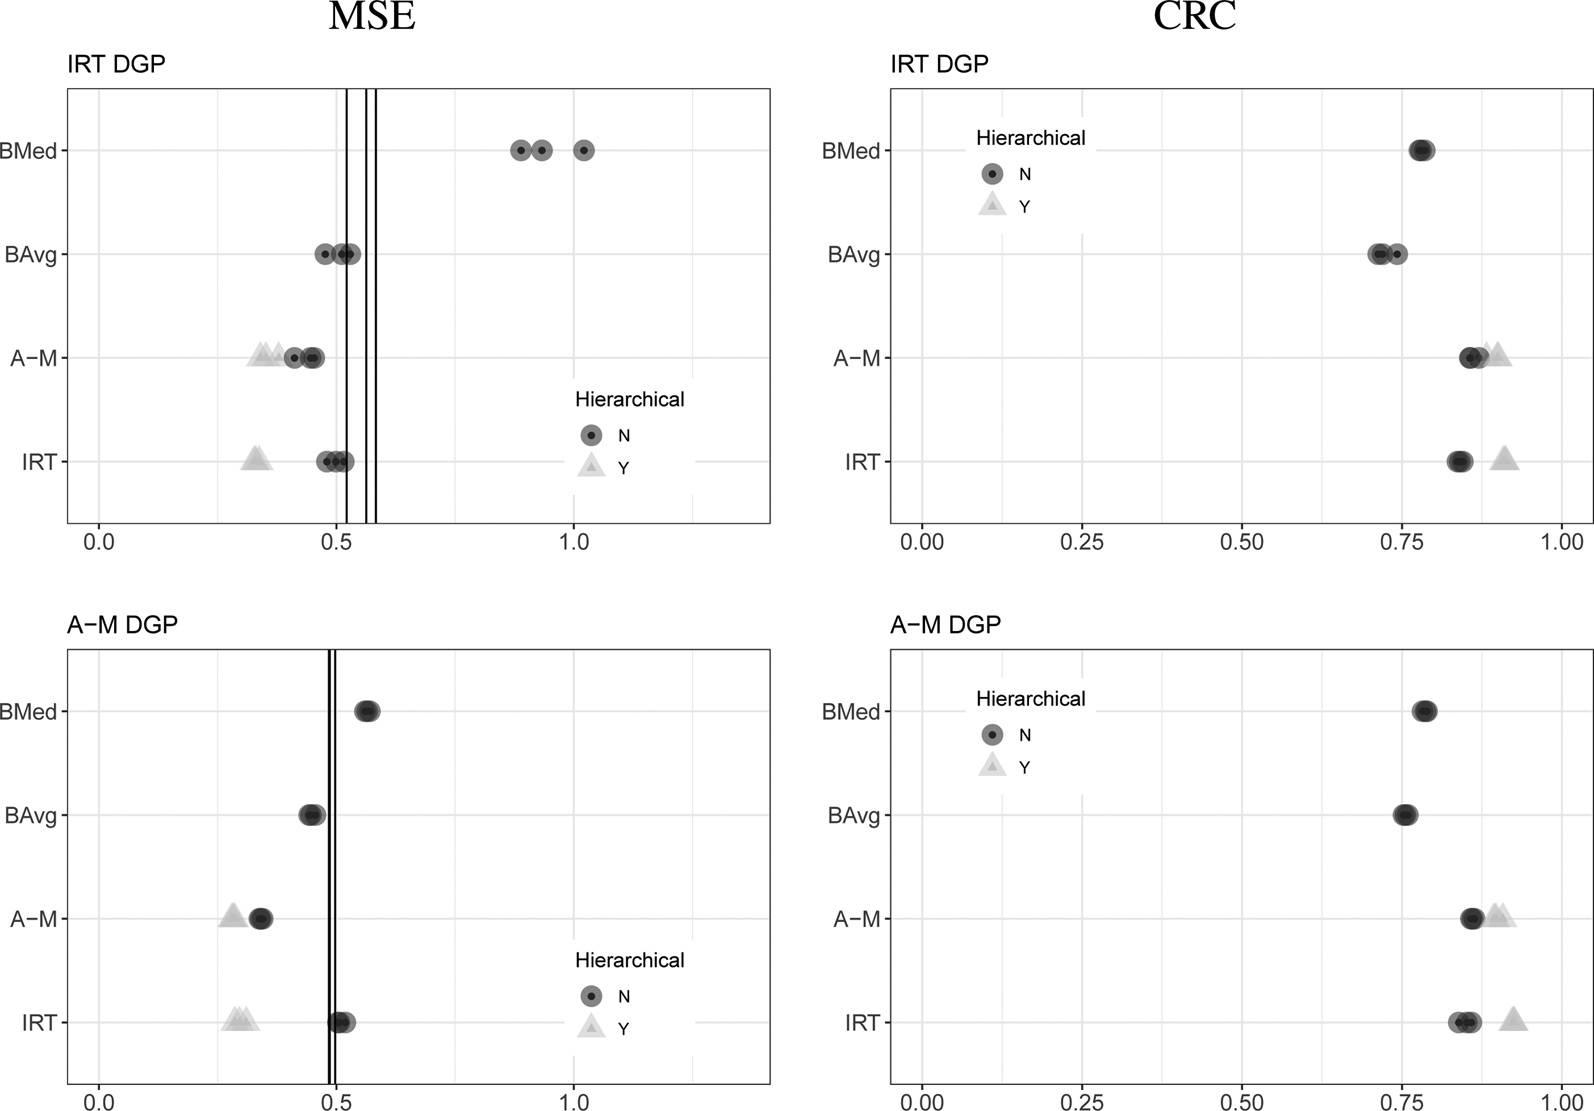
Cumulatively, these results indicate that hierarchical latent variable models perform similarly or better than other models in terms of both MSE and CRC when the true values are normally distributed, and the difference between hierarchical IRT and A–M algorithms is slight. The relatively poor performance of non-hierarchical models (in particular, IRT models) is likely a computational issue due to sparse data. The BMed results indicate that it is a problematic method for aggregating expert-coded data with normally distributed true values.
3.2 Uniformly distributed true values
We replicate the preceding analyses using simulated data in which the true values are uniformly distributed (online Appendix H). The results largely align with those for simulated data with normally distributed true values, with two main exceptions. First, in line with Lindstädt et al. (Reference Lindstädt, Proksch and Slapin2020), BMed slightly outperforms other models in terms of MSE when the DGP is A–M and error variation is low. BMed otherwise performs poorly, as in the preceding analyses. Second, hierarchical A–M models perform worse than their IRT counterparts in terms of CRC in this context, although both models again perform similarly in terms of MSE.
3.3 Simulation summary
Overall, the simulation studies demonstrate the following:
(1) Non-hierarchical latent variable models never outperform their hierarchical counterparts.
(2) In most circumstances, the bootstrapped median performs worse than hierarchical latent variable models, the average and bootstrapped average. It never performs drastically better than these alternatives.
(3) The average and bootstrapped average perform worse than hierarchical latent variable models when experts have high levels of measurement error, and never perform drastically better.
(4) Among hierarchical latent variable models, A–M models generally perform similarly to their IRT counterparts, although in certain circumstances their CRC is worse.
We therefore conclude that hierarchical latent variable models are the most robust method for recovering true values from expert-coded data, with some evidence that IRT models may be the safest in terms of coverage.
4. Empirical application: freedom from political killings
Despite the unambiguous simulation results, it is still unclear to what extent the greater robustness of hierarchical latent variable models substantively matters. We therefore investigate the importance of aggregation technique for descriptive analysis, an essential element of the social science enterprise (Gerring, Reference Gerring2012), as well as a common use for expert-coded data.Footnote 8 Specifically, we use different techniques to aggregate expert-coded data on freedom from political killings, the V–Dem variable we use as the basis for our simulation studies.
As one of the most severe forms of repression which a state can practice, political killings are an inherently important phenomenon; they are also particularly well-suited for expert coding since accurate coding requires both conceptual and contextual knowledge. Moreover, academic research has used this specific V–Dem variable to validate other indices (Fariss, Reference Fariss2017), while policymakers have used it to both assess the phenomenon directly and construct higher-level indices (Skaaning, Reference Skaaning2019). The descriptive accuracy and precision of this indicator is thus of importance to a variety of communities.
We analyze the importance of aggregation technique at three levels, focusing on four techniques: MpSD, the traditional method for aggregating expert-coded data; BMed, the technique Lindstädt et al. (Reference Lindstädt, Proksch and Slapin2020) advocate; and hierarchical A–M and IRT models, the best-performing techniques from the simulation analyses.Footnote 9
Figure 4 illustrates high-level trends in the data: the relationship between democracy and freedom from political killings, with Polity IV combined scores proxying democracy (Marshall and Jaggers, Reference Marshall and Jaggers2016). All aggregation techniques show similar patterns: freedom from political killings tends to be greater in more democratic societies (those with higher Polity values), although as the literature predicts the relationship is non-linear (Davenport and Armstrong, Reference Davenport and Armstrong II2004; Jones and Lupu, Reference Jones and Lupu2018). However, differences between aggregation techniques are also apparent. In particular, BMed tends to indicate more extreme changes across democracy levels than other aggregation techniques.
Trends in freedom from political killings over levels of democracy.
Note: Higher values indicate greater freedom from political killings on a zero-centered scale. Points represent point estimates from different aggregation techniques, and lines locally estimated smoothing regressions.

Figure 5 provides pairwise comparisons of how different aggregation techniques describe trends in political killings in Turkey over time. Points represent point estimates from a given technique, while vertical lines represent 95 percent confidence intervals or credible regions. Again, all aggregation techniques show similar trends in freedom from political killings. At the same time, there is substantial variation in how these techniques show these trends. MpSD shows extremely high levels of uncertainty about change over time (left cell). BMed has lower levels of uncertainty about these trends, but lacks nuance: for example, although MpSD shows a gradual increase in freedom from political killings between 1980 and 2001, BMed shows only a jump in 1990 (left cell). IRT and A–M show very similar point estimates and the lowest levels of uncertainty about these estimates (right cell). However, in line with the simulation evidence of greater CRC for IRT, there is slightly more uncertainty about the IRT estimates.
Freedom from political killings in Turkey over time, measured with different aggregation techniques.
Note: Higher values indicate greater freedom from political killings on a zero-centered scale. Points represent point estimates from different aggregation techniques, and vertical lines 95 percent credible regions.
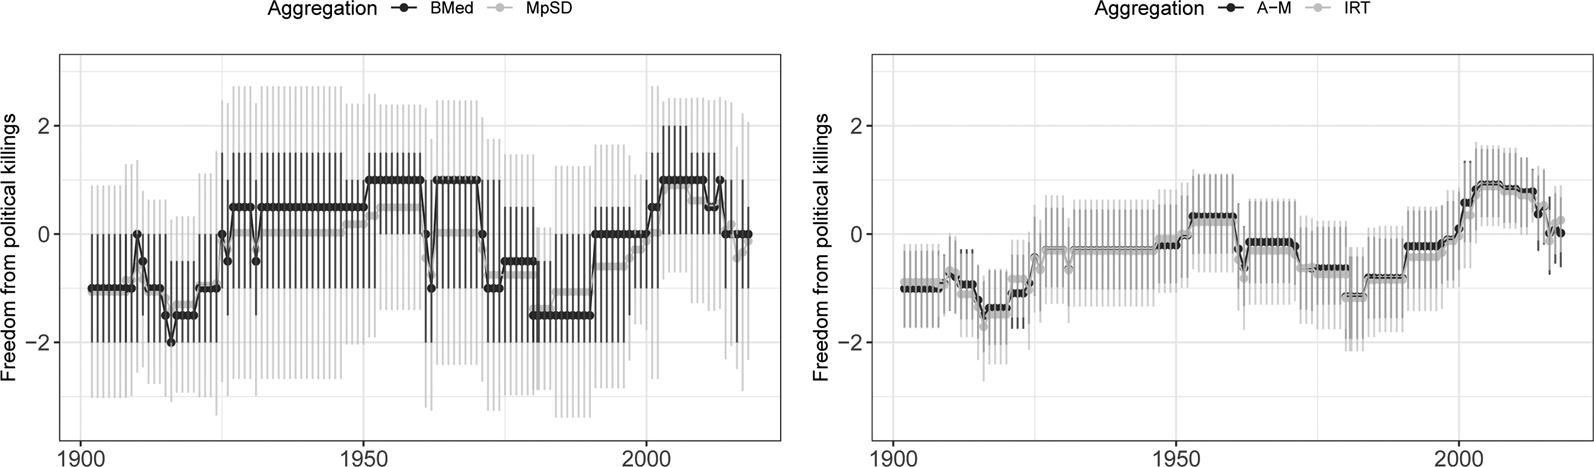
These analyses indicate that there is substantial variation in how different aggregation techniques describe political killings, especially when comparing latent variable models to MpSD and BMed. Although MpSD produces similar estimates to the latent variable models in the application, it is marked by extremely high levels of uncertainty that makes substantive claims about trends difficult. Results regarding BMed are starker, demonstrating that BMed diverges to the greatest extent from other estimates. The simulation studies demonstrate that, in the case of such divergence, BMed is likely to be less accurate than the other aggregation techniques. Together, the simulation and empirical analyses suggest that BMed is the worst of both worlds, combining higher MSE with a lack of nuance.Footnote 10
5. Conclusion
There is increasing evidence that simple summary statistics can perform poorly as point estimates for cross-national expert surveys. In particular, the use of these statistics largely sweeps the question of measurement error under the rug. We put these concerns front and center, and provide a framework for incorporating such error into downstream analyses. We do so by simulating ecologically valid expert-coded data, using different DGPs and levels of expert error. We then investigated the degree to which different models—ranging from simple summary statistics to computationally intensive latent variable models—recover the simulated true values and provide reasonable CRC. We conclude by demonstrating that aggregation technique can have important substantive implications for descriptive analyses.
The main implication of our analyses is that summary statistics—be they the average or especially the median—are not robust to different forms of measurement error in the context of expert-coded data. Instead, researchers should aggregate expert-coded data using hierarchical latent variable models; IRT models are a particularly safe technique. To that end, our replication dataset contains code to implement all the models discussed here using the statistical software Stan (Stan Development Team, Reference Stan Development Team2018).
Supplementary material
The supplementary material for this article can be found at https://doi.org/10.1017/psrm.2021.39.
Acknowledgements
Earlier drafts have been presented at the 2018 APSA, EPSA, and V–Dem conferences. The authors thank Chris Fariss, John Gerring, Adam Glynn, Dean Lacy, and Jeff Staton for their comments on earlier drafts of this paper. We also thank Daniel Stegmueller and two anonymous reviewers for their valuable criticism and suggestions. This material is based upon work supported by the National Science Foundation (SES-1423944), Riksbankens Jubileumsfond (M13-0559:1), the Swedish Research Council (2013.0166), the Knut and Alice Wallenberg Foundation, and the University of Gothenburg (E 2013/43), as well as internal grants from the Vice-Chancellor's office, the Dean of the College of Social Sciences, and the Department of Political Science at the University of Gothenburg. We performed computational tasks using resources provided by the High Performance Computing section in the Swedish National Infrastructure for Computing at the National Supercomputer Centre in Sweden (SNIC 2017/1-406 and 2018/3-133). Marquardt acknowledges research support from the Russian Academic Excellence Project ‘5-100.’



