Implications
The water footprint (WF) was recommended as an indicator of freshwater use. This study provides the outcomes of assessment of WF of the sheep meat which could be used as good support in national water policies by the reallocation of sheep production across farming systems in term of water use. The agro-sylvo-pastoral farming system exhibited the lowest WF (8654/l/kg live weight (LW)). Green water harvesting and the use of low WF-feeds such as cactus and crop residues are among the recommended options to increase water use efficiency of sheep meat production in Tunisia.
Introduction
Producing enough food and preserving natural resources has become a challenge to tackle by countries exposed to climate change. Water scarcity is among the factors affecting food security. It is forecasted that two-thirds of the world population will be exposed to a serious water stress by 2025 (Molden, Reference Molden2007; Steduto et al., Reference Steduto, Faurès, Hoogeveen, Winpenny and Burke2012). In addition, the demand for freshwater resources in agriculture will continue to increase with the growing population and economic growth. Therefore, producing more crops and animal products with less water used has become a challenging demand by the governmental authorities. Livestock production has been identified as an intensive water-consuming sector accounting for more than 30% of the global agricultural water requirement (Mekonnen and Hoekstra, Reference Mekonnen and Hoekstra2012). The need for an indicator to quantify water use has become crucial for water decision making. Water footprint was proposed as an indicator to evaluate water use induced by human activities (Zhang et al., Reference Zhang, Huang, Yu and Yang2017). Two principal approaches exist in the literature for assessing WF, of which the Water Footprint Network method (Hoekstra et al., Reference Hoekstra, Chapagain, Aldaya and Mekonnen2011) and WF approach developed by Life Cycle Assessment team (Ridoutt and Pfister, Reference Ridoutt and Pfister2013). The WF concept was applied by many authors to several crops and livestock products. Research studies on WF of livestock sector are dedicated mainly to swine, dairy and beef cattle, small ruminant’s production has received little attention in the growing body of literature (Toro-Mujica et al., Reference Toro-Mujica, Aguilar, Vera and Cornejo2016). Small ruminants, especially sheep farming, are the main source of income for farmers and for the empowerment of communities’ livelihoods in the arid and semi-arid Mediterranean regions (Nefzaoui et al., Reference Nefzaoui, Ben Salem and El Mourid2012). The WF of sheep meat varies largely, due to differences in method, but also to differences in sheep farming systems (e.g. origin of the feed and diet composition) (Mekonnen and Hoekstra, Reference Mekonnen and Hoekstra2012; Toro-Mujica et al., Reference Toro-Mujica, Aguilar, Vera and Cornejo2016; Ibidhi et al., Reference Ibidhi, Hoekstra, Gerbens-Leenes and Chouchane2017; Murphy et al., Reference Murphy, Curran, Holden, O’Brien and Upton2017a). Like many other dry countries, Tunisia suffers from a severe water scarcity with low water availability per capita per year, which recorded to 410 m3 in 2016 and will decrease to around 360 m3 by 2030) (Tunisian Institute for Strategic Studies, 2017). Moreover, water shortage is threatening the sustainability of livestock production systems. Research studies on assessing water use in sheep meat farming systems under Tunisian conditions at the farming system level are scanty. It is true that Mekonnen and Hoekstra (Reference Mekonnen and Hoekstra2012) had assessed the WF of sheep meat in Tunisia, but their assessment was based on global averages rather than data collected directly from the field. Recently, Ibidhi et al. (Reference Ibidhi, Hoekstra, Gerbens-Leenes and Chouchane2017) determined the WF of sheep meat under different farming systems in Tunisia. The WF assessment of sheep farming systems performed by the later authors was based on WF values obtained from Mekonnen and Hoekstra (Reference Mekonnen and Hoekstra2012) database during the period 1996–2005. Furthermore, there is no updated field case study on WF of sheep farming in Tunisia. The objectives of the present paper were (i) to develop a typology of sheep production systems in Tunisia involving structural variables in 1050 farmers, and (ii) to assess the WF of sheep meat produced under the identified production systems. This study aimed also to validate the modeled WF values and to end-up with recommended options to improve the water use efficiency of sheep meat.
Material and methods
Study area and data collection
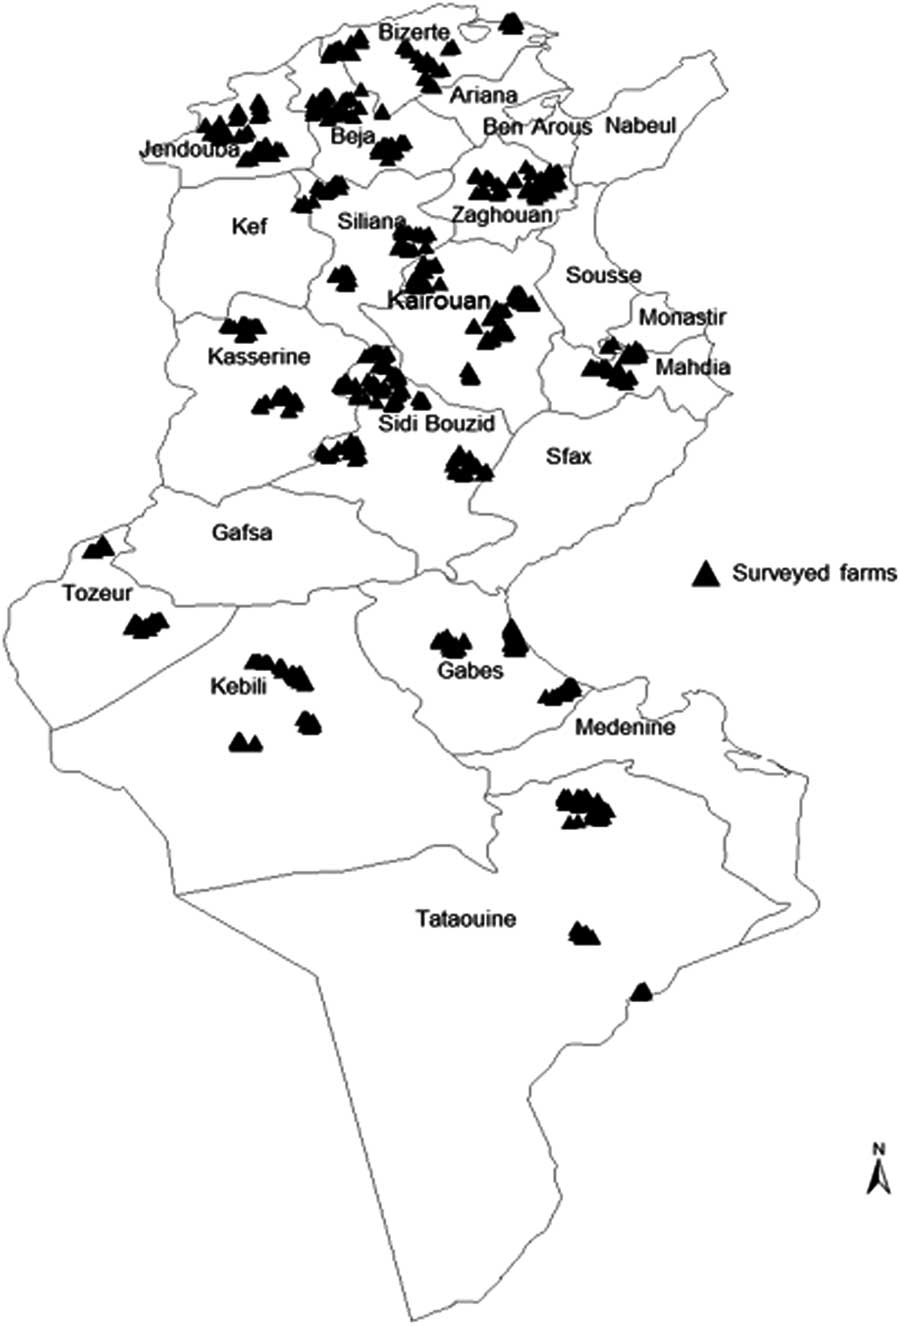
This study was carried out in thirteen provinces (locally named governorates) of Tunisia during 2014–2015 (Figure 1). The data were generated by face-to-face interviews with target farmers. In the survey phase, 1050 farms devoted to sheep production were randomly selected for the field questionnaire survey in order to cover a wide range of farm types across Tunisia. This survey included four basic sections: The first section included questions about the general characteristics of farms’ structure and climate. The second section addressed questions about flock size, feed composition and breed categories of sheep. The third and fourth sections were dedicated to rangeland type, crop yield and watering profile of sheep farming, respectively.
Geographical distribution of the surveyed sheep farms in Tunisia.

Typology and characterization of farming systems
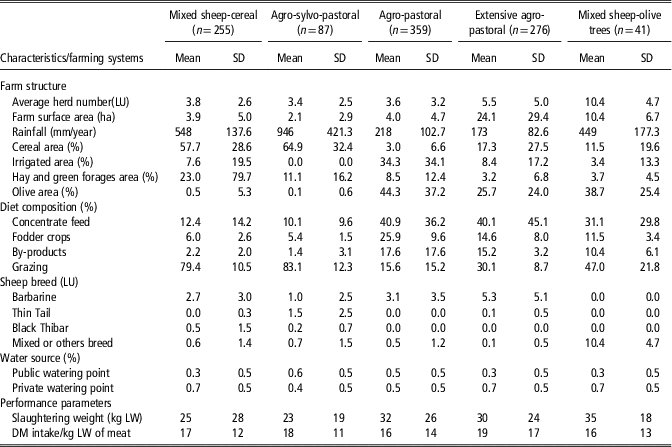
This study was based on our previous work on the typology of sheep farming systems in Tunisia (Ibidhi et al., Reference Ibidhi, Frija, Jaouad and Ben Salem2018). The national sheep flock size accounts for more than six million heads for which 61% are raised in semi-arid and arid regions and contributes 40% of the red meat production (Ibidhi et al., Reference Ibidhi, Frija, Jaouad and Ben Salem2018). The sales of fattened lambs picked mainly in Ramadhan and during the Islamic religious ceremony of mutton scarify (commonly named Eid Al Idha). During these two periods the demand for sheep meat is important and farmers’ incomes would substantially increase. Female lambs are culled mainly in the wedding ceremonies in summer (Hammami et al., Reference Hammami, Soltani and Snoussi2007). Sheep production in Tunisia is undertaken in a range of farming systems exposed to different climatic conditions. A detailed description of the sheep farming systems was provided by Ibidhi et al. (Reference Ibidhi, Frija, Jaouad and Ben Salem2018). To deal with this variation of farming systems, a typology analysis was performed by Ibidhi et al. (Reference Ibidhi, Frija, Jaouad and Ben Salem2018) from 1050 sheep farms. A K-mean cluster analysis was used to separate farms into distinct groups (Frija et al., Reference Frija, Chebil and Speelman2016). Sheep farms were categorized into five types (Table 1): Mixed sheep-cereal (MSC), agro-sylvo-pastoral (ASP), agro-pastoral (AP), extensive agro-pastoral (EAP) and mixed sheep-olive trees (MSO) farming systems. The MSC farming system is located in the cereal cropping regions where wheat and barley stubbles grazing is a common practice. The ASP farming system is the dominant production system in the mountainous regions. Sheep are typically grazing herbaceous vegetation and some fodder shrubs under forest trees. The AP farming system involved the largest irrigated area, and animals in this system are intensively managed. The EAP farming system refers to those farms having an average size of 24.1 ha in which sheep and to a less extent goat and camels production is the main activity. Flocks of these species graze on collective natural rangelands. Finally, the MSO farming system refers to farms that are home to large sheep flocks (10.4 livestock units) and in which olive production is the predominant activity (Ibidhi et al., Reference Ibidhi, Frija, Jaouad and Ben Salem2018). The characteristics of the identified farming systems are reported in Table 1.
Characteristics of the identified sheep farming systems in Tunisia based on survey data for the year 2014–2015

LU=livestock unit; LW=live weight; DM=dry matter.
Source: Ibidhi et al. (Reference Ibidhi, Frija, Jaouad and Ben Salem2018).
Water footprint calculation
Water footprint of sheep meat production
To assess the WF of sheep meat produced in different farming systems, we used the methodology described in the manual guidelines for the water footprint assessment (WFA) published by Hoekstra et al. (Reference Hoekstra, Chapagain, Aldaya and Mekonnen2011), and which report the global standard for WFA. The WF of an animal consists of two components: the indirect WF of feed production and direct WF related to drinking and service water consumed on-farm (Mekonnen and Hoekstra, Reference Mekonnen and Hoekstra2012). For each production system, we calculated the WF as a water volume per kg LW as:
 $${\rm WF}_{{{\rm animal}}} \,{\equals}\,{\rm WF}_{{{\rm feed}}} \,{\plus}\,{\rm WF}_{{{\rm drink}}} \,{\plus}\,{\rm WF}_{{{\rm serv}}} $$
where WFfeed, WFdrink and WFserv represent the WFs related to feeding, drinking water and service water consumption, respectively. Several factors determine the WF of the meat: feed intake, composition and origin (Mekonnen and Hoekstra, Reference Mekonnen and Hoekstra2012; Gerbens-Leenes et al., Reference Gerbens-Leenes, Mekonnen and Hoekstra2013; Ibidhi et al., Reference Ibidhi, Hoekstra, Gerbens-Leenes and Chouchane2017). The WF of feed for sheep per production system was calculated by multiplying the amounts of feed ingredients with their respective WF (accounting for the origin of the feed):
 $${\rm WF}_{{{\rm feed}}} \,{\equals}\,\mathop{\sum}\limits_{{\rm i}{\equals}1}^{\rm n} {\left( {{\rm Feed}\left[ {\rm i} \right]{\times}{\rm WF}_{{\rm P}} \left[ {\rm i} \right]} \right)} $$
where Feed[i] is the amount of feed ingredient i in kg per kg of meat and WFP[i] is the average WF of feed ingredient [i] in l/kg. WFs of feed concentrates, crop residues and pasture were calculated in this study.
Estimation of water footprint of feed production and pasture
The WFs of different feed sources are calculated based on the differentiation between the green, blue and grey WF components. The WF definitions and calculation methods used in the current study were reported by Hoekstra et al. (Reference Hoekstra, Chapagain, Aldaya and Mekonnen2011). The consumptive (green and blue) WF of growing a crop (m3/ton) equals the total actual evapotranspiration (ET, m3/ha) over the cropping period divided by the crop yield (Y, ton/ha). In the current study, Food and Agriculture Organization (FAO)’s crop water productivity ‘Aqua crop’ model was used to calculate crop WFs. The ET and Y of growing crops in Tunisia were simulated on a daily basis, at 5×5 arc min resolution (Steduto et al., Reference Steduto, Hsiao, Raes and Fereres2009), run for the whole period 1993–2012. The Aqua crop model had been applied in WF accounting at field (Chukalla et al., Reference Chukalla, Krol and Hoekstra2015; Zhuo et al., Reference Zhuo, Mekonnen, Hoekstra and Wada2016). In addition, the model performance on simulating crop growth and water use has been well tested for a variety of crop types under diverse environmental conditions (Zhuo et al., Reference Zhuo, Mekonnen, Hoekstra and Wada2016). The calculations were performed using climate data from the nearest and most representative meteorological stations and a specific cropping pattern for each crop according to the type of climate. Monthly values of major climatic parameters were obtained from the national institute of meteorology of Tunisia (National Institute of Metrology of Tunisia, 2016). Crop parameters (crop coefficients, planting date and harvesting date) were taken from Allen et al. (Reference Allen, Pereira, Raes and Smith1998) and the FAO database (Food and Agriculture Organization (FAO), 2009 and 2012). Types of soil and average crop yield data were obtained from farms and assisted by technicians from a development organization (Livestock and Pasture Agency, OEP). Soil information (soil types, field capacity, permanent wilting point, saturation…) was taken from FAO (2009). All collected data are used as inputs for the Aqua crop model for calculation of crop WFs. Rangeland biomass was obtained through a non-destructive method by estimation of canopy vegetation cover to obtain aboveground shrub biomass in each farm surveyed. The digital vegetation charting technique was used to estimate the canopy cover using a high resolution digital camera. The digital camera used in this study was a Samsung Techwin (model NV100HD, VLUU NV100HD, LANDIAO NV100HD, TL34HD, OR, USA) equipped with a 28-mm lens, GPS tracker and monopod frame. Aboveground shrub biomass was clipped to estimate the dry matter (DM) weight and to determine its relationship to canopy cover. The estimation of the percentage of green vegetation cover were calculated from the digital camera images using supervised classification technique in VegMeasure software (Tarhouni et al., Reference Tarhouni, Ben Salem, Tlili, Ouled Belgacem, Neffati and Louhaichi2016; Louhaichi et al., Reference Louhaichi, Hassan, Clifton and Johnson2017).
The grey WFs of crops production is calculated by taking the chemical application rate for the field per hectare (AR, kg/ha) and multiplied by the leaching-run-off fraction (α). The product is divided by the difference between the maximum acceptable concentration (C max, kg/m3) for that pollutant and its natural concentration (C nat, kg/m3) (Owusu-Sekyere et al., Reference Owusu-Sekyere, Scheepers and Jordaan2017). The result is then divided by the crop yield (Y, ton/ha) and this is expressed as:
 $${\rm WF}_{{{\rm proc},{\rm grey}}} \,{\equals}\,{{\left( {\alpha \,{\times}{\rm AR}} \right)\,/\,\left( {C_{{{\rm max}}} {\minus}C_{{{\rm nat}}} } \right)} \over Y}\left( {{\rm volume}\,/\,{\rm mass}} \right) $$
The virtual WF values of imported feed corresponding to outsourced feed resources were obtained from Hoekstra and Chapagain (Reference Hoekstra and Chapagain2007). In addition, the virtual WF of feedstuff form humid region such as hay and cereal straw was considered in this study. For the assessment of the WF of industrial by-products, we allocated the WFs of crops calculated in this study obtained over the crop yields and crop residues using production (fp) and value fractions (fv). To assess the WF of a crop residue (WFr), we first calculated the WF of the total biomass of the crop (WFt) based on the WF of the crop yield (WFC1) as this study and the harvest index (HI) (Ibidhi et al., Reference Ibidhi, Hoekstra, Gerbens-Leenes and Chouchane2017):
 $${\rm WF}_{{\rm t}} \,{\equals}\,{\rm HI}\,{\times}\,{\rm WF}_{{{\rm C}1}} $$
Next, WFt is allocated over the crop yield and the residue fraction. The (adjusted) WF of the crop yield (WFC2) and the WF of the crop residue (WFr) are calculated as:
 $${\rm WF}_{{{\rm C}2}} \,{\equals}\,{{{\rm f}_{{\rm v}} \left[ {\rm y} \right]} \over {{\rm f}_{{\rm p}} \left[ {\rm y} \right]}}{\times}{\rm WF}_{{\rm t}} $$
 $${\rm WF}_{{\rm r}} \,{\equals}\,{{{\rm f}_{{\rm v}} \left[ {\rm r} \right]} \over {{\rm f}_{{\rm p}} \left[ {\rm r} \right]}}{\times}{\rm WF}_{{\rm t}} {\rm }$$
Water footprint related to drinking and services water
Drinking water by sheep was calculated based on Forbes (Reference Forbes1968), cited by Schlink et al. (Reference Schlink, Nguyen and Viljoen2010), and it is a function of DM intake (DMI) and ambient temperature:
 $${\rm LWI}\,{\equals}\,{\rm DMI}\,{\times}\left( {0.18\,{\times}{\rm T}\,{\plus}1.15} \right)$$
where LWI, DMI and T represents the liquid water intake (l/day), DMI (kg/day) and the mean monthly temperature (°C), respectively. Service and cleaning water were determined based on farmer’s perceptions.
Validation of modelled water footprint values of sheep meat production
Uncertainty value of the WF of sheep meat production was calculated in this study. Twelve Tunisian smallholder sheep farms were selected to validate the WF modelling values at the farm scale. The field measurement was conducted in six farms of Barbarine sheep under each of the two different farming systems belonging to two agro-ecological zones: The MSC in northern Tunisia which characterised by a humid climate and the AP farming systems in central Tunisia which is characterized by semi-arid climate. Water use measurement was done through year-round monitoring of on-farm practices using a water metres and recording equipment’s installed in water use key locations and distinguished by water source (rainfall, irrigation): (i) water for crop and pasture production, (ii) virtual water used for feed production, (iii) sheep watering and (iv) water used for cleaning and servicing. In addition, the crop yield and rangelands biomass production were assessed. The estimation of sheep meat WF was done using the WFA methodology. The WF validation was restricted to these two farming systems, which depend to the ability of farmers to implement and to control water use, feed intake, crop yield and BW of animals at the farm scale.
Results
Water footprint of feed ingredients
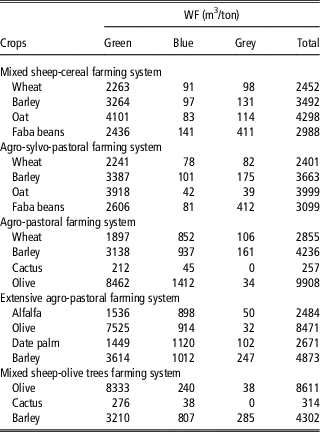
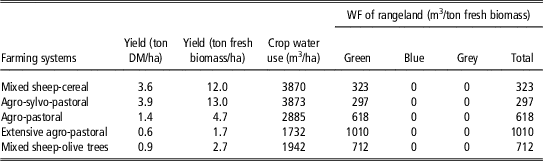
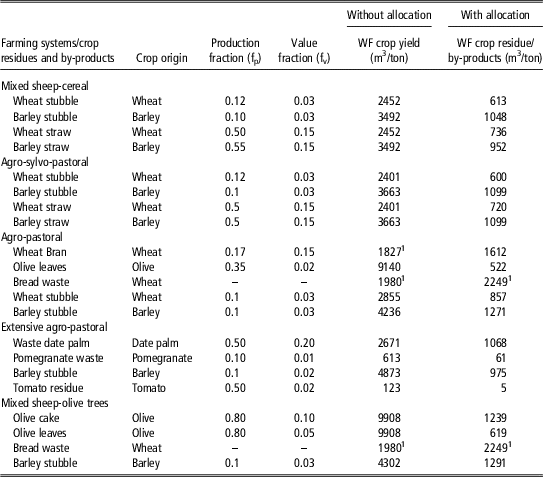
Table 2 reports data on the use of the three categories of water (green, blue and grey) by different crops produced in each sheep farming system. Among the three WFs, the green WF is predominant. All crops have a blue and grey WFs. Data in this table point out a significant variation of crop production from one system to another. Barley produced in the EAP farming system has the greatest WF, followed by the AP and the MSO farming systems. The lowest WF of this cereal crop was obtained with the ASP and MSC farming systems. The blue WF component of barley is negligible in the rain-fed system (1%) and shows an important share in farming systems relying on irrigation (36%). Table 3 shows the biomass production and the WFs of rangelands in different sheep farming systems. The grazing vegetation quality is a key factor to differentiate between farming systems. In the AP, MSO and EAP systems, animals graze on very poor quality rangelands and spend a long time grazing to meet their nutrients requirements, whereas in the ASP and MSC systems the grazing land quality is marginal (relatively better) and animals spend relatively less grazing time. The WF of pasture ranged from 297 m3/ton in ASP system to 1010 m3/ton in the EAP system. Rangelands don’t have a blue nor a grey WF as they don’t receive irrigation water or fertilizers and pesticides. Compared with the WF of crop residues, the WF of crop production has a relatively high WF. Allocating the WF of crop production partly to crop residues or agro-industrial products decreases the WF of crops. Table 4 reports the WF of the crop yields (m3/ton) before allocation based on data from the simulation of crop water use of the yield and after partial allocation of WFs to residues. Results show that the WF of crop residues and agro-industrial products are at least four times less than the WF of crop yield.
Water footprint (WF) of crop production of different sheep farming systems

Biomass production and water footprint (WF) of rangeland (m3/ton fresh biomass) in the identified sheep farming systems in Tunisia

DM=dry matter.
Water footprints (WF) of crop yields, crop residues and by-products with and without water footprint allocation in the sheep farming systems

1 Mekonnen and Hoekstra (Reference Mekonnen and Hoekstra2010).
Water footprint of drinking and servicing water
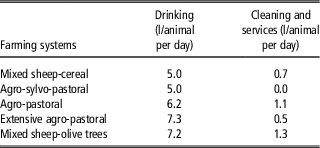
The result of the estimation of drinking, servicing and cleaning water of sheep production by farming systems in Tunisia are presented in Table 5. Results show that the average daily water intake of sheep varied across farming systems and ranged from 5 l/animal per day in the MSC farming system to 7.3 l/animal per day in the EAP system which is prone to relatively high monthly temperature and water salt content. However, servicing water is almost negligible in all systems.
Drinking, cleaning and services water consumed by sheep production under different farming systems in Tunisia

Water footprint of sheep meat across farming systems
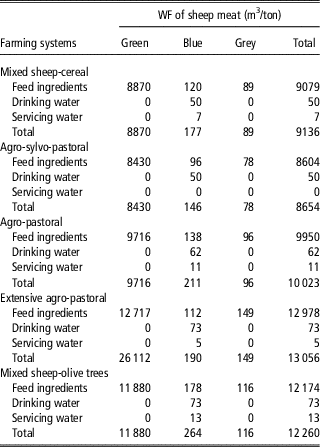
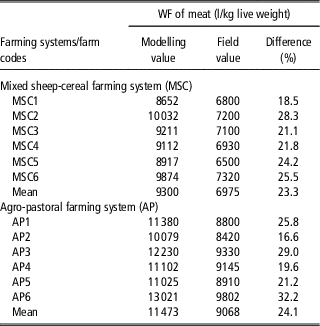
The WF of sheep meat produced in Tunisia under different farming systems including water used for feed production, drinking water, servicing and cleaning water are presented in Table 6. The WF of sheep meat averaged to 10 626 l/kg of meat. By farming system, the EAP system has the largest WF (around 13 000 l/kg meat), followed by the MSO system (12 260 l/kg meat), the AP system (10 023 l/kg meat), the MSC (9136 l/kg meat) and the ASP system (8654 l/kg meat). For all the five production systems, the total WF is dominated by the green WF component. The blue and grey WFs in the five farming systems are similar. Results of the validation of modelled WF values at farms that belong to the MSC and AP farming systems are presented in Table 7. The modelled values of the WF of sheep meat are overestimated by an average of 23.3% and 24.1% for farms belonging to the MSC and AP farming systems, respectively.
Water footprint (WF) of sheep meat (m3/ton) produced in Tunisia under different farming systems

Comparison between modelling and field values of the water footprint (WF) of sheep meat in 11 sheep farms belonging to the mixed sheep-cereal and the agro-pastoral farming systems

Discussion
This study highlighted the water use of sheep meat production across five farming systems in Tunisia identified based on a typology analysis. The application of a WF method addressing the volumetric assessment of freshwater consumption pointed out a significant variation in the WF of meat amongst farming systems (Mekonnen and Hoekstra, Reference Mekonnen and Hoekstra2010; Gerbens-Leenes et al., Reference Gerbens-Leenes, Mekonnen and Hoekstra2013; Ibidhi et al., Reference Ibidhi, Hoekstra, Gerbens-Leenes and Chouchane2017; Murphy et al., Reference Murphy, de Boer, van Middelaar, Holden, Shalloo, Curran and Upton2017b). The WF of sheep meat estimated in this study (8654 to 13 056 l/kg) is lower than that from grazing systems (16 300 l/kg) estimated by Mekonnen and Hoekstra (Reference Mekonnen and Hoekstra2010), who provided also a specific estimate of the same indicator for Tunisia averaging 14 500 l/kg. There are various factors that may explain differences between the current study and that of the later authors. Mekonnen and Hoekstra (Reference Mekonnen and Hoekstra2010) considered an average value of the WF of pasture of 315 l/kg, whereas in the current study we calculated the WFs of pasture in farms assigned to the ASP (323 l/kg), MSC (297 l/kg), AP (618 l/kg), EAP (1010 l/kg) or MSO (712 l/kg) farming systems. Furthermore, Mekonnen and Hoekstra (Reference Mekonnen and Hoekstra2010) considered the WF of cereal stubbles as a zero, whereas in the current study we allocated the WF of crop production over the yield and crop residue based on their respective economic values, arriving at a WF ranged from 613 to 857 l/kg and from 975 to 1291 l/kg of wheat and barley stubble respectively across sheep farming systems. In addition, the WF assessment of sheep meat produced under different farming systems are smaller than results obtained by Ibidhi et al. (Reference Ibidhi, Hoekstra, Gerbens-Leenes and Chouchane2017). Ibidhi et al. (Reference Ibidhi, Hoekstra, Gerbens-Leenes and Chouchane2017) assessed the WF of three farming systems during the decade 1995–2005: AP with cereal crop residues, AP with barley and pastoral system with barley farming systems. The difference in WF assessment results can be explained by differences in data collection. In this study, the WF of sheep meat was calculated based on primary data collected directly from farmers. However, Ibidhi et al. (Reference Ibidhi, Hoekstra, Gerbens-Leenes and Chouchane2017) based their calculation on WF values obtained from Mekonnen and Hoekstra (Reference Mekonnen and Hoekstra2010) database. The EAP, AP and the MSO farming systems use larger amounts of concentrate in the diet had high WF values compared with the ASP and MSC farming systems, where the concentrate proportion in the diet ranged between 30% and 44%. The increase of the amount of concentrate in the diet is in general associated with an increase of WF of meat, but other parameters including the growth performance of animals and farm management should be considered to justify the increased WF of sheep meat production. A major driver of water use is the efficiency of feed conversion to meat, which is determined by potential animal productivity as well as feed availability and quality year-round. A study of the volumetric WF of sheep meat produced on pasture-based systems in Ireland (Murphy et al., Reference Murphy, Curran, Holden, O’Brien and Upton2017a) quantified as 7672 l/kg carcass weight (CW) of which 7635 l/kg CW was green water and 37 l/kg CW was blue water. In addition, water for the production of pasture is the main contributor to the total WF of sheep meat (87%).
For Herrero et al. (Reference Herrero, Havlík, Valin, Notenbaert, Rufino, Thornton, Blümmel, Weiss, Grace and Obersteiner2013) feed quality and efficiency are the key drivers of animal productivity and are the main factors explaining the variation of water consumption among the different production systems. Concentrate intake is associated with a greater water consumption than roughage intake. Water used for concentrate is five times greater than that used for roughages production (Hoekstra, Reference Hoekstra2012). Concentrate feeds have the highest water use due to their high ET, which is strongly dependent on the spatial zone of production. Values of crop water use of different feed ingredients indicate that concentrate to roughage ratio is the main factor affecting water use in the sheep production systems. Moreover, this study shows that the rain-fed ASP farming system is the most water efficient production system. A growing number of authors figure out the importance of including green water in the assessment of WF, as it reflects how rain-fed agricultural systems reduce the demand and impact of blue water consumption. de Fraiture et al. (Reference de Fraiture, Wichelns, Rockstrom, Kemp-Benedict, Eriyagama, Gordon, Hanjra, Hoogeveen, Huber-Lee and Karlberg2007) claimed that the use of green water resources should be seen from a competition perspective when analysing the current trend for an increase in the global demand for livestock-source products.
The grey WF analysis in the current study focused on the pollution from nitrogen fertilizers applied in feed crop cultivation; the effect of other compounds, such as phosphorous and pesticides, were not considered in the calculation of WF. Water pollution induced by the use of metals and antibiotics commonly used in livestock production was not considered in the present study. The values of C nat and C max are important uncertainty factors in the grey WF. Many studies indicate that water use assessment of crop production may lead to overestimation of water consumption (Batchelor et al., Reference Batchelor, Reddy, Linstead, Dhar, Roy and May2014; Schyns and Hoekstra, Reference Schyns and Hoekstra2014). However, our study showed that field values were below estimated values of WF. The estimated WF of sheep meat is largely influenced by the input data used and assumptions made to calculate it, which can contain an uncertainty of more than 23% in farms from the MSC and AP farming systems. In addition, the WF of meat is determined mainly by the WF of feed production. The estimation of WF of crop production was performed using the Aqua crop model and the yield values communicated directly by farmers. Variations of these inputs data and yield values substantially affect the WF of crops. Conducting a validation work at farm scale aiming to calculate the range of WF uncertainty in sheep farming is an expensive and time and labour demanding activity. Extending the calculation of uncertainties to the non-validated WF farming systems would be very informative for farmers and policy makers in term of water use prediction. The uncertainty analysis could be performed based on the most commonly Monte Carlo (MC) simulation method in order to handle the uncertainty and variation in the input data in WF calculation.
The WF of meat is mostly determined by the feed distributed to the animals. In Tunisia, under the context of climate change and water scarcity, farmers rely more and more on concentrates outsourced from other countries. In general, feed concentrates have relatively large blue and grey WFs, whereas crop residues, waste and roughages have relatively small WFs. The AP, EAP and MSO farming systems use a lot of concentrate feed, which have a high blue and grey WF than pasture or roughage. An increase in the consumption of animal products would put pressure on farming systems to produce more. This may also stimulate a shift from grazing-based systems to more industrial systems with larger output per unit of feed. The combination of production increase and the shift towards more industrial systems will increase the use of concentrates feed in livestock production and the global WFs of the livestock sector. In addition, improving sheep productivity through the increase of animal LW gain and animal fertility and the decrease of mortality rate across farming systems is also a key driver for enhancing the efficiency of water use mainly in semi-arid and arid regions (Murphy et al., Reference Murphy, Curran, Holden, O’Brien and Upton2017a). This study showed that WF of meat production varies across the farming systems. This trend should be viewed as an opportunity to reallocate the livestock sector based on the availability of water resources across the country.
Conclusion
In view of water scarcity that is being exacerbated by climate change in the dry areas including North Africa, there is an increasing interest towards the assessment of WF in different agriculture sectors. The WF of animal products, like meat, in different farming systems is not well documented. The typology of sheep farms pointed out five different groups of farming systems (MSC, ASP, AP, EAP and the MSO). This study presented the first WF assessment of Tunisian sheep production systems using farm-specific data. This study showed that an average of 10 626 m3 of water is required to produce one ton of sheep meat in Tunisia. Results show that the WF assessment of sheep production varied across farming system, where the ASP and MSC farming systems had the lowest WF. This study also showed that green water assigned to feed and rangelands biomass production represents 98% of the total volumetric WF of the Tunisian sheep farming systems. Moreover, the green WF accounts for more than 92% of the total WF in all farming systems. The validation of the WF values at farm scale belonging to two selected farming systems (MSC and AP farming systems) came up with an uncertainty value of 23.3% and 24.1%. Results reported herein support the recommendation that sheep production should place more emphasis on restructuring sheep farming systems through enhancing sheep productivity and the optimized use of crop residues and agro-industrial by-products because this could decrease the pressure on freshwater resources. Mediterranean countries such as Tunisia have high potential to produce crop residues. This asset would contribute to the increase of water efficiency of the livestock sector. In addition, producing feeds in areas with low water scarcity or cultivated predominantly from green water resources such as in Northern Tunisia is another opportunity for the rationalization of water use in livestock production sector. Therefore, modelling WF of sheep meat production proved to be a powerful tool to evaluate the water efficiency of different production systems which provide to policy makers a good support to reallocate sheep production across farming systems in term of water saving. Moreover, it can help to define appropriate intervention for reducing WF in farming systems. There is also a need to focus more on reducing the gap between field and theoretical data based on an uncertainty analysis. The expansion of the uncertainty analysis to the non-validated farming systems should be considered in the future to decrease the knowledge gaps on the input variables that contribute to the overestimation of the WF of sheep meat by farming systems.
Acknowledgements
Authors would like to thank sheep farmers for their collaboration. This study was supported by the International Center for Agricultural Research in the Dry Areas (ICARDA) and the International Atomic Energy Agency (IAEA-INRAT Project TUN 5028).
Declaration of interest
The authors declare no conflicts of interest.
Ethics statement
None.
Software and data repository resources
All data generated or analyzed for this study are available from the corresponding author on reasonable request.