1. Introduction
Most developing economies, and certainly the majority of the populations living within them, depend directly on natural resources. For many of these economies, primary product exports account for the vast majority of their export earnings, and one or two primary commodities make up the bulk of exports (Barbier, Reference Barbier2005, chapter 1). Agricultural value added accounts for an average of 40 per cent of GDP, and nearly 80 per cent of the labor force is engaged in agricultural or resource-based activities (World Bank, 2008b). Further adding to these disparities, by 2025, the rural population of the developing world will have increased to almost 3.2 billion, placing increasing pressure on a declining resource base (Population Division of the United Nations Secretariat, 2008).
Many rural people in developing countries rely directly on natural resources and the environment for agriculture, livestock husbandry, fishing, basic materials, and fuel – to meet their own subsistence requirements and to sell in markets for cash income. The lack of clean water, sanitation, and other infrastructure services suggests that increased public provision of such basic services is highly valued by many households. Rapid land-use change has meant that many natural environments and habitats are disappearing quickly, with the result that critical ecological services are being disrupted or lost (Millennium Ecosystem Assessment, 2005). The demise of key ecosystems of the developing world include mangroves (35 per cent either lost or degraded), coral reefs (30 per cent), and tropical forests (30 per cent) (FAO, 2001, 2003; Valiela et al., Reference Valiela, Bowen and York2001; Millennium Ecosystem Assessment, 2005; UNEP, 2006).
Given the resource-dependence of rural populations in developing countries, and given that many natural environments and habitats are declining in these countries, it is tempting to conclude that poverty is a major cause of environmental degradation in poorer economies. However, current evidence suggests that such a conclusion may be too simplistic. This paper will shed some light on the more complex relationship between poverty and natural resource degradation in developing countries.
For example, section 2 discusses the tendency of the rural poor to be concentrated in fragile, or less favorable, environmental areas. As section 3 indicates, one consequence is that the livelihoods of the poor are intimately dependent on natural resource use and ecosystem services. But simply because many of the poor people in developing regions are located in fragile environments, and frequently use surrounding natural resources, it is erroneous to assume that they cause much of the environmental degradation that occurs in developing countries. A review of the evidence of various studies of natural resource use by households shows that the relationship between poverty and natural resource degradation may depend on a complex range of choices and tradeoffs available to the poor, which in turn are affected by their access to key markets (e.g., for land, labor, credit as well as goods and services) as well as the quality and state of the surrounding environment. The main features of this more complex relationship are illustrated in a simple poverty–environment trap model. The paper concludes by discussing the policy challenge arising from this key aspect of poverty, development, and environment.
2. The poor and less favored areas
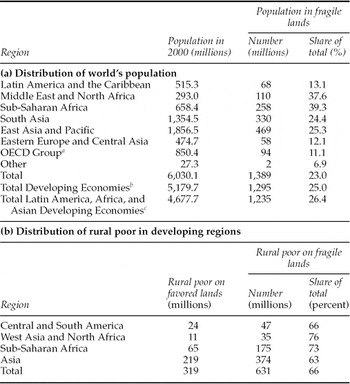
The continuing concentration of the rural poor in the less favored areas of developing regions has roots in the long-run trends of postwar global economic development (Barbier, Reference Barbier2010). This is clearly a phenomenon with a long history. Since 1950, the estimated population in developing economies on ‘fragile lands’ has doubled (World Bank, 2003, ch. 4). These fragile environments are prone to land degradation, and consist of upland areas, forest systems and drylands that suffer from low agricultural productivity, and which according to the World Bank are ‘areas that present significant constraints for intensive agriculture’ (World Bank, 2003, p. 59). Today, nearly 1.3 billion people – almost a fifth of the world's population – live in such areas in developing regions (see table 1a). The populations living in fragile environments and on marginal lands in developing countries include 518 million living in arid regions with no access to irrigation systems, 430 million on soils unsuitable for agriculture, 216 million on land with steep slopes and more than 130 million in fragile forest systems. Almost half of the people living in these fragile environments (631 million) consist of the rural poor, who throughout the developing world outnumber the poor living on favored lands by 2 to 1 (see table 1b).
Distribution of world's population and rural poor on fragile land

Notes: In table 1(a), fragile lands are defined as areas that present significant constraints for intensive agriculture and where the people's links to the land are critical for the sustainability of communities, pastures, forests, and other natural resources; they include arid regions with no access to irrigation, areas with soils unsuitable for agriculture, land with steep slopes and fragile forest systems (see World Bank 2003). In table 1(b), fragile lands are equated with marginal lands, which are defined as areas with the greatest potential for land and water degradation; i.e., land with highly weathered soils, steep slopes, inadequate or excess rainfall, and high temperatures (see Comprehensive Assessment of Water Management in Agriculture 2007).
aOECD Group: Australia, Austria, Belgium, Canada, Denmark, Finland, France, Germany, Greece, Iceland, Ireland, Italy, Japan, Luxembourg, Netherlands, New Zealand, Norway, Portugal, Spain, Sweden, Switzerland, United Kingdom and United States.
bWorld Total less OECD Group.
cWorld Total less OECD Group, East Europe and Central Asia and Other.
Sources: Barbier (Reference Barbier2008). Table 1(a) is adapted from World Bank (2003, table 4.2). Table 1(b) is adapted from Comprehensive Assessment of Water Management in Agriculture (2007, table 15.1) and Scherr (Reference Scherr1999).
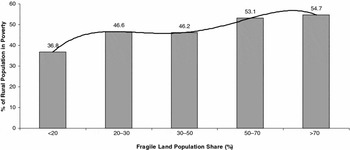
Figure 1 further illustrates that rural poverty is correlated with the fraction of the population in developing countries found on fragile lands. As the figure indicates, for a sample of 76 developing economies from Africa, Asia, and Latin America, the incidence of rural poverty rises as developing countries have more of their populations concentrated on fragile lands. Although the average poverty rate across all economies is 45.8 per cent, the rate falls to 36.8 per cent for those countries with less than 20 per cent of their population in fragile environments. For those with more than 50 per cent of their populations in marginal areas, however, the incidence of rural poverty rises to 53 per cent or more.
The rural poor and population on fragile lands in developing economies
Notes: Developing economies are all economies from East Asia and the Pacific, Latin America and the Caribbean, Middle East and North Africa, South Asia and sub-Saharan Africa with 2006 per capita income of $11,115 or less, following World Bank (2008). Percentage of rural population in poverty is from World Bank (2008b). Percentage of population on fragile land is from World Bank (2003). Number of observations = 76 countries, of which 12 (<20% of population on fragile land), 26 (20–30%), 28 (30–50%), 7 (50–70%), and 3 (>70%). The average rural poverty rate across all countries is 45.8%, and the median is 42.6%.

The tendency for the rural poor to be clustered in the most marginal environments is also supported by studies at the regional and country level, although important differences exist within and between countries. For example, researchers from the World Bank have examined the ‘poverty-environment nexus’ in three of the poorest countries in Southeast Asia – Cambodia, Laos, and Vietnam (Minot and Baulch, Reference Minot and Baulch2002; Dasgupta et al., Reference Dasgupta, Deichmann, Meisner and Wheeler2005). In Cambodia, the core poor in rural areas appear to be located in areas that are already heavily deforested; on the other hand, poor populations tend to be more concentrated in the lowlands rather than steeply sloped lands. In Laos, the poorest provinces in the north and northeast also have the highest incidence of poor rural populations. These individuals are located mainly in forested areas and the highlands. In Vietnam, large poor populations confined to steep slopes exist in the provinces comprising the Northern and Central Highlands, but extensive rural poverty is also found along the North Central Coast and the Red River Delta.
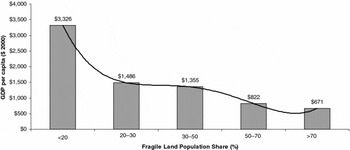
Developing economies with high concentrations of their populations on fragile lands not only display high rates of rural poverty but also are some of the poorest countries in the world today. As indicated in figure 2, for a sample of 90 low and middle income economies from Africa, Asia, and Latin America, real GDP per capita declines sharply with the share of the population in fragile environments. For all economies, the average GDP per capita is $1,566, but for those economies with less than 20 per cent of their populations on fragile lands, real GDP per capita more than doubles to $3,326. In contrast, for those economies with 50 per cent or more of the population in fragile lands, GDP per capita is only $822 and for those economies with 70 per cent or more of the population in marginal rural environments, real GDP per capita is $671. According to the World Bank (2008b), the low-income, or poorest, economies of the world are those in which 2006 Gross National Income per capita was $905 or less.
Fragile land population and GDP per capita in developing economies
Notes: Developing economies are all economies from East Asia and the Pacific, Latin America and the Caribbean, Middle East and North Africa, South Asia, and sub-Saharan Africa with 2006 per capita income of $11,115 or less, following World Bank (2008b). GDP per capita ($ 2000), latest year, is from World Bank (2008b). Percentage of population on fragile land is from World Bank (2003). Number of observations = 90 countries, of which 12 (<20% of population on fragile land), 27 (20–30%), 37 (30–50%), 9 (50–70%), and 5 (>70%). The average GDP per capita ($ 2000) across all countries is $1,566 and the median is $661.

The tendency of rural populations to be clustered on marginal lands and in fragile environments is likely to be a continuing problem for the foreseeable future, given current global rural population and poverty trends. First, despite rapid global urbanization, the rural population of developing regions continues to grow, albeit at a slower rate in recent years. From 1950 to 1975, annual rural population growth in these regions was 1.8 per cent, and from 1975 to 2007 it was just over 1.0 per cent (Population Division of the United Nations Secretariat, 2008). Second, around three-quarters of the developing world's poor still live in rural areas, even allowing for the higher cost of living facing the poor in urban areas. In general, about twice as many poor people live in rural than in urban areas in the developing world (Chen and Ravallion, Reference Chen and Ravallion2007).Footnote 1
3. The environment and the economic livelihoods of the poor
Several economic studies have indicated the importance of various natural environments to the economic livelihood of the poor in developing countries.
For example, estimates from Thailand suggest that the net present value (in 1996 $) over 1996–2004 arising from the net income to local communities from collected forest, shellfish and other products from coastal mangroves ranges from $484 to $584 per hectare (ha). The net present value of mangroves as breeding and nursery habitat in support of off-shore artisanal fisheries ranged from $708 to $987 per ha, and the storm protection service was $8,966 to $10,821 per ha (Barbier, Reference Barbier2007b). Such benefits are considerable when compared to the average incomes of coastal households; a survey conducted in July 2000 of four mangrove-dependent communities in two different coastal provinces of Thailand indicates that the average household income per village ranged from $2,606 to $6,623 per annum, and the overall incidence of poverty (corresponding to an annual income of $180 or lower) in all but three villages exceeded the average incidence rate of 8 per cent found across all rural areas of Thailand (Sarntisart and Sathirathai, Reference Sarntisart, Sathirathai, Barbier and Sathirathai2004). The authors also found that excluding the income from collecting mangrove forest products would have raised the incidence of poverty to 55.3 per cent and 48.1 per cent in two of the villages, and to 20.7 per cent and 13.64 per cent in the other two communities.
The Thailand example is not unusual; poor households across the developing world typically display considerable direct and indirect use values for mangroves (Ruitenbeek, Reference Ruitenbeek1994; Bandaranayake, Reference Bandaranayake1998; Barbier and Strand, Reference Barbier and Strand1998; Naylor and Drew, Reference Naylor and Drew1998; Hammitt et al., Reference Hammitt, Liu and Liu2001; Othman et al., Reference Othman, Bennett and Blamey2004; Badola and Hussain, Reference Badola and Hussain2005; Chong, Reference Chong2005; Walton et al., Reference Walton, Giselle, Samonte-Tan, Primavera, Edwards-Jones and Le Vay2006; Rönnbäck et al., Reference Rönnbäck, Crona and Ingwall2007; Walters et al., Reference Walters, Rönnbäck, Kovacs, Crona, Hussain, Badola, Primavera, Barbier and Dahdouh-Guebas2008; Das and Vincent, Reference Das and Vincent2009). However, there is also evidence that coastal people hold important nonuse values associated with mangroves. A contingent valuation study of mangrove-dependent coastal communities in Micronesia demonstrated that the communities ‘place some value on the existence and ecosystem functions of mangroves over and above the value of mangroves’ marketable products’ (Naylor and Drew, Reference Naylor and Drew1998, p. 488).
Coral reefs are another critical habitat throughout the developing world that both support near-shore fisheries harvested by poor coastal communities and provide valuable shoreline protection (Moberg and Folke, Reference Moberg and Folke1999; Cesar, Reference Cesar and Cesar2000; Jackson et al., Reference Jackson, Kirby, Berger, Bjørndal, Botsford, Bourque, Bradbury, Cooke, Erlandson, Estes, Hughes, Kidwell, Lange, Lenihan, Pandolfi, Peterson, Steneck, Tegner and Warner2001; Moberg and Rönnbäck, Reference Moberg and Rönnbäck2003; Chong, 2005; Worm et al., Reference Worm, Barbier, Beaumont, Duffy, Folke, Halpern, Jackson, Lotzke, Micheli, Palumbi, Sala, Selkoe, Stachowicz and Watson2006). For example, Cesar (Reference Cesar and Cesar2000) estimates the losses, in net present value per square kilometer (km2), in terms of support for near-shore artisanal fisheries and coastal protection from the destruction of coral reefs in Indonesia. The main threats to coral reefs are from poison fishing, blast fishing, coral mining, sedimentation from logging onshore, and overfishing. Together, these threats account for present value losses in coastal fisheries of around $0.41 million per km2 of coral reef destroyed, and present value losses in coastal protection $0.011–$0.453 million per km2 of coral reef destroyed. Evidence from Kenya indicates that coral reefs may also be critical to larval dispersal to fishing areas, which could affect the effectiveness of marine reserves and closed fishing grounds in inducing stock recovery and thus eventual re-opening to fishing (Rodwell et al., Reference Rodwell, Barbier, Roberts and McClanahan2003). Coral reefs also have important cultural and nonuse value to neighboring coastal communities; many cultural and religious traditions have evolved in tropical coastal zones that honor the dependence of local communities on adjacent reefs and reflect the ‘bequest value’ of preserving this way of life into the future (Moberg and Folke, Reference Moberg and Folke1999).
Forested watersheds in developing regions also provide a number of hydrological services that can impact the livelihoods of the poor, such as water filtration/purification; seasonal flow regulation; erosion and sediment control; and habitat preservation (Richards, Reference Richards1997; Chomitz and Kumari, Reference Chomitz and Kumari1998; Kremen et al., Reference Kremen, Niles, Dalton, Daily, Ehrlich, Fay, Grewal and Guillery2000; Guo et al., Reference Guo, Xiao, Gan and Zheng2001; Pattanayak and Kramer, Reference Pattanayak and Kramer2001; Chopra and Adhikari, Reference Chopra and Adhikari2004; Postel and Thompson, Reference Postel and Thompson2005; Silvano et al., Reference Silvano, Udvardy, Ceroni and Farley2005; Diwakara and Chandrakanth, Reference Diwakara and Chandrakanth2007). These services will become increasingly important as more and more river basins in developing areas experience rising water use relative to freshwater supplies (Rosegrant et al., Reference Rosegrant, Cai and Cline2002). In addition, forests, especially forests of upper watersheds, provide a number of direct uses to adjacent poor communities, including timber, collected nontimber products and community forestry (Kremen et al., Reference Kremen, Niles, Dalton, Daily, Ehrlich, Fay, Grewal and Guillery2000; Guo et al., Reference Guo, Xiao, Gan and Zheng2001; Pagiola et al., Reference Pagiola, Arcenas and Platais2005).
Some of the most important benefits of maintaining and improving land uses in upper watersheds accrue to poor communities living downstream. In the central highlands of Bolivia, for example, Richards (Reference Richards1997) finds that a project to improve watershed protection and reduce soil erosion on farmers’ fields in the uplands yields a net present value of nearly $34.9 million, with the majority of the benefits due to flood prevention and the increased water availability due to aquifer recharge in the lower watershed. Similarly, improvements to the upper watersheds in Karnataka, India through afforestation and construction of tanks, artificial ponds, check dams, and other reclamation structures leads to significant benefits to downstream farmers through improving groundwater recharge and availability, thus reducing the cost of irrigation and the need for developing new wells or extending existing wells (Diwakara and Chandrakanth, Reference Diwakara and Chandrakanth2007). Pattanayak and Kramer (Reference Pattanayak and Kramer2001) estimate that increased water flows associated with afforestation of watersheds in Eastern Indonesia yield economic values for downstream farmers equivalent to 1–10 per cent ($3.5–$35) of annual agricultural profits. However, land uses other than forests in some tropical watersheds may also yield beneficial hydrological flows; for example, Aylward and Echeverría (Reference Aylward and Echeverría2001) show that conversion of forests to pasture for livestock in the upper watersheds of Río Chiquito, Costa Rica actually increases water flow downstream, generating net present values in the range of $250–$1,000 per ha of pasture.
In many poor countries, an economically important natural environment downstream is the seasonally inundated savanna or forested floodplains located in the lower river basins. During seasonal flood events, water often leaves the main river channel and inundates these floodplains. As the floods abate and recede, crops are planted in the naturally irrigated soils, fish are caught more easily in the retreating waters, and the increased alluvial deposits increase the biological productivity of forests, wildlife, and other harvested resources. Around half of Africa's total wetland area consists of floodplains, including huge large-scale ecosystems of several thousand square kilometers such as the Inner Niger Delta in Mali, the Okavango Delta in Botswana, the Sudd of the Upper Nile in Sudan and the Kafue Flats in Zambia (Lemley et al., Reference Lemley, Kingsford and Thompson2000). Millions of people across the continent depend directly on the floodplains for their economic livelihoods through production activities such as flood-recession agriculture, fishing, grazing, and wood and nonwood harvesting of riparian forest resources; and millions more in surrounding arid land depend on the groundwater recharge service of floodplains for drinking water and irrigation (Barbier, Reference Barbier2003). Similar benefits are found in other extremely poor countries, such as Bangladesh, where 80 per cent of the country consists of floodplains created by the confluence of the Ganges, Brahmaputra, Meghna, and other rivers (Islam and Braden, Reference Islam and Braden2006). Chopra and Adhikari (Reference Chopra and Adhikari2004) show how upland economic activity, such as intensified agriculture, in Northern India can affect hydrological flows into the wetlands comprising Keoladeo National Park, thus affecting the income gained by downstream villagers from tourism and extracting biomass, fodder, and other products.
Upstream dam developments are also threatening the economic livelihoods of millions of poor agricultural households dependent on the Hadejia-Jama'are floodplain in Northeast Nigeria. Full implementation of all the upstream dams and large-scale irrigation schemes is estimated to produce overall net losses in terms of agricultural, fuelwood, and fish production to these households of around US$20.2–20.9 million in net present value terms (Barbier, Reference Barbier2003). In addition, the reduction in mean peak flood extent is predicted to cause a one-meter fall in groundwater levels in the shallow aquifers that are recharged by the standing water in the floodplain wetlands, leading to additional annual losses of around $1.2 million in tubewell irrigated dry season agriculture and $4.76 million in domestic water consumption for rural households. Islam and Braden (Reference Islam and Braden2006) show that, in Bangladesh, fishing and flood-recession agriculture are important joint products to poor rural households utilizing natural floodplains, although it is largely the landless who benefit from floodplain fish production rather than agricultural landowners. As a consequence, a natural floodplain contains more land devoted to fishing rather than agriculture but actually yields higher overall net economic returns, especially compared to traditional management scenarios of upstream dam developments to limit flooding, increase agricultural area and expand crop production downstream.
4. The ‘assetless’ poor and environmental degradation
A commonly held view is that, because many of the poor people in developing regions are located in fragile environments, they must be responsible for the majority of the world's ecosystem degradation and loss – even though their livelihoods are directly affected by such environmental destruction. This perspective that poor people are mired in a two-way ‘poverty-environment trap’ has gained credence ever since it was asserted by the World Commission on Environment and Development (1987, p. 27) that: ‘poor people are forced to overuse environmental resources to survive from day to day, and their impoverishment of their environment further impoverishes them, making their survival ever more uncertain and difficult.’
However, studies of poor households and communities suggest that their behavior with respect to the environment is more complex. The range of choices and tradeoffs available to the poor is affected by their access to key markets (e.g., for land, labor, credit as well as goods and services) as well as the quality and state of the surrounding environment on which their livelihoods depend (for reviews, see Dasgupta, Reference Dasgupta1993, Reference Dasgupta, Mäler and Vincent2003; Reardon and Vosti, Reference Reardon and Vosti1995; Scherr, Reference Scherr2000; Pattanayak et al., Reference Pattanayak, Mercer, Sills and Yang2003; Barrett, Reference Barrett2004; Caviglia-Harris, Reference Caviglia-Harris2004; Barbier, Reference Barbier2005, chapter 6; Gray and Mosley, Reference Gray and Mosley2005; Carter and Barrett, Reference Carter and Barrett2006; World Bank, 2008a). As summarized by Dasgupta (Reference Dasgupta1993, p. 475), ‘in rural communities of poor countries a great many markets of significance (e.g., credit, capital, and insurance) are missing, and a number of commodities of vital importance for household production (potable water, sources of fuel and fodder, and so forth) are available only at considerable time and labour cost.’ In the absence of local labor markets capable of absorbing all the poor and landless households looking for work, or well-functioning rural credit markets to lend needed capital, the landless and near landless in rural communities depend critically on the use of common-property and open access resources for their income and nutritional needs. Thus, it may be the ‘assetless’ poor who end up most dependent on exploiting the surrounding environment and its ecological services for survival.
A survey of the extremely poor and poor households across 13 countries sheds some light on how they survive (Banerjeee and Duflo, Reference Banerjee and Duflo2007).Footnote 2 Although the survey did not include how the poor used their surrounding natural environment, it does reinforce that the poorest rural households have very few productive assets. First, land is one of the few productive assets owned by the rural poor, and almost all households engage in some form of agriculture, but the size of landholdings tends to be very small. The median landholding among the poor who own land is one ha or less in India, Indonesia, Guatemala, and Timor Leste; between 1 and 2 ha in Peru, Tanzania, and Pakistan; and between 2 and 3 ha in Nicaragua, Côte d'Ivoire, and Panama. Second, poor rural households tend to rely on selling their only other asset, unskilled labor. Agriculture is generally not the mainstay of most of these households; instead, they generally obtain most of their income from off-farm work as agricultural laborers or in unskilled paid work or occupations outside of agriculture. However, when households do engage in outside employment, they tend to migrate only temporarily and for short distances. Permanent migration for work is rare for most poor rural households. Thus, given the lack of ownership of assets by the rural poor, and their tendency to stay where they are located, it is not surprising that the livelihoods of the ‘assetless’ poor are often the most dependent on their surrounding natural environments.
The scale of this dependence may be very extensive in some developing regions. For example, in Southern Malawi it was found that surveyed households derive 30 per cent of their income on average from exploiting ‘common’ forests (Fisher, Reference Fisher2004). Households that are especially lacking in land, education, and goat holdings are more reliant on ‘low return’ forest activities, such as sales of ‘forest-based’ crafts (bamboo baskets and mats, grass brooms, and wood-fired pots), roof thatching and brick-burning, sales of prepared foods and drink, sales of firewood and bamboo, and traditional medicines. Similarly, in South Africa the poorest households used more nontimber forest products, such as fuelwood, wild fruits, edible herbs, and grass hand brushes, per capita than wealthier households (Shackleton and Schackleton. Reference Shackleton and Schackleton2006). Such findings appear to be consistent with studies of income diversification across Africa, which show that the ‘assetless’ poor diversify into low-return activities based on exploiting common property environmental resources, but with little hope of escaping the ‘poverty trap’ (Dercon Reference Dercon1998; Barrett et al., Reference Barrett, Reardon and Webb2001).
This link between asset poverty, lack of income opportunities and resource extraction as insurance may also be very significant in many tropical forest regions, where the livelihoods of the poor often depend on the extraction of biological resources in fragile environments (Pattanayak and Sills, Reference Pattanayak and Sills2001; Wunder, Reference Wunder2001; Takasaki et al., Reference Takasaki, Barham and Coomes2004; Vedeld et al., Reference Vedeld, Angelsen, Sjaastad and Berg2004; Adhikari, Reference Adhikari2005; McSweeney, Reference McSweeney2005; Shone and Caviglia-Harris, Reference Shone and Caviglia-Harris2006; World Bank, 2008a). For example, Vedeld et al. (Reference Vedeld, Angelsen, Sjaastad and Berg2004) conduct a meta-analysis of 54 case studies globally of rural communities that live in or near tropical forests, and find that on average 22 per cent of household income in these communities depends on forest resources. However, the proportion of forest income was significantly higher for poorer households (32 per cent) compared to the nonpoor (17 per cent). Similarly, López-Feldman and Wilen (Reference López-Feldman and Wilen2008) find that nontimber forest product use is mainly conducted by households in Chiapas, Mexico with low opportunity costs of time and fewer income generation opportunities. And, in Palawan (the Philippines), hunting pressure on fauna was shown to be inversely related to farm size and agricultural productivity, but positively correlated with labor availability (Shively, Reference Shively1997). The state of the local environment may also affect how the poor utilize its resources, and in turn, their livelihood strategies. In India, Narain et al. (Reference Narain, Gupta and van 't Veld2008a) find that, in villages surrounded by good quality forests, the poorest households depend on forest resources for as much as 41 per cent of their income compared to 23 per cent for the richest households. In areas where the forests are in a poor state, both the rich and poor's use of common resources decline, but more so for the poor; both types of households depend on forests for only around 9–14 per cent of their income. In West Bengal, almost 10 per cent of the time of the average household is spent on gathering fuel, either for use at home or for sale (Banerjee and Duflo, Reference Banerjee and Duflo2007).
Lack of assets and access to key markets may also constrain the ability of poor households to adopt technologies to improve their farming systems and livelihoods. In conducting a meta-analysis based on 120 cases of agricultural and forestry technology by smallholders across the developing world, Pattanayak et al. (Reference Pattanayak, Mercer, Sills and Yang2003) find that credit, savings, prices, market constraints, access to extension and training, tenure and plot characteristics, such as soil quality and landholding size, are important determinants of adoption behavior. Not surprisingly, the result is low adoption rates for sustainable agricultural and forestry technologies among poor smallholders.
The assetless poor are also highly vulnerable to natural disaster shocks, such as droughts, hurricanes, tsunamis, floods, and other extreme events (Badola and Hussein, Reference Badola and Hussain2005; McSweeney, Reference McSweeney2005; Carter et al., Reference Carter, Little, Mogues and Negatu2007; Barbier, Reference Barbier2008; Das and Vincent, Reference Das and Vincent2009). On the other hand, positive income shocks and targeted programs to the poor can reduce pressure on natural resources (Fisher and Shively, Reference Fisher and Shively2005). For example, two studies based on the 1999 cyclone that struck Orissa, India found that mangroves significantly reduced the number of deaths as well as damages to property, livestock, agriculture, fisheries, and other assets (Badola and Hussain, Reference Badola and Hussain2005; Das and Vincent, Reference Das and Vincent2009). Statistical analysis indicates that there would have been 1.72 additional deaths per village within 10 km of the coast if the mangrove width along shorelines had been reduced to zero (Das and Vincent, Reference Das and Vincent2009). Losses incurred per household were greatest ($154) in a village that was protected by an embankment but had no mangroves compared to losses per household ($33) in a village protected only by mangrove forests (Badola and Hussain, Reference Badola and Hussain2005). However, evidence from Thailand indicate that poor coastal households are less willing to participate in mangrove replanting schemes, even though they are aware of the storm protection benefits of mangroves, because of the high opportunity cost of their labor and lack of community control over the management of the restored mangroves (Barbier, Reference Barbier2008). In many developing regions, poor households rely on natural resources not for protection against storms and other environmental shocks but as insurance and coping strategies for avoiding the income and subsistence losses associated with such disasters (McSweeney, Reference McSweeney2005; Carter et al., Reference Carter, Little, Mogues and Negatu2007).
Given that poor rural households engage in some agriculture, and are highly dependent on outside employment for income, their livelihood strategies across these activities must be interdependent. In particular, as the ‘natural’ assets and land available to them degrade or disappear, the rural poor are likely to search for more paid work to increase their earnings from outside jobs. For example, Dasgupta (Reference Dasgupta1993) has hypothesized that such environmental degradation effectively lowers the ‘reservation wage’ of the poor for accepting paid work, as households are forced to look for additional work to make up the lost income.
Various studies provide evidence in support of Dasgupta's hypothesis from resource-dependent communities across the developing world (Jansen et al., Reference Jansen, Rodriguez, Damon, Pender, Chenier and Schipper2006; Pascual and Barbier, Reference Pascual and Barbier2006, Reference Pascual and Barbier2007; Barbier, Reference Barbier2007a). For example, Barbier (Reference Barbier2007a) finds that mangrove deforestation is likely to increase the probability that both males and females from coastal communities in Thailand participate in outside work, but the number of hours worked in outside employment by males declines with any mangrove loss while the number of hours worked by females rises. Households appear to be highly dependent on males continuing to work on the physically demanding mangrove-dependent activities, such as fishing and collecting products, and as mangrove resources decline, even more male labor will be devoted to exploiting them to maintain the mangrove-based income and subsistence required by the households. In contrast, females are more likely to be sent out for paid employment to earn needed cash income as local mangrove resources decline. In contrast, in the Yucatán, Mexico, in response to increased population density and declining soil fertility, only the better off households are able to devote more labor to off-farm employment; in contrast, the poorer households allocate even more labor to shifting cultivation, thus perpetuating problems of shortened fallows and declining yields (Pascual and Barbier, Reference Pascual and Barbier2006, Reference Pascual and Barbier2007). On the other hand, in the rainfed upland areas of Honduras, favorable rainfall during the secondary season lowers the probability that a household's income-earning strategy focuses on off-farm work, probably because it makes their own farm vegetable production more profitable (Jansen et al., Reference Jansen, Rodriguez, Damon, Pender, Chenier and Schipper2006).
Evidence from the Philippines confirms that higher wages for off-farm employment can draw away smallholder labor that would otherwise be used for clearing more forests for on-farm agricultural production (Coxhead et al., Reference Coxhead, Shively and Shuai2002; Shively and Fisher, Reference Shively and Fisher2004). However, poorer households in remote locations are the least likely to participate in off-farm employment, as they face higher transaction and transportation costs (Shively and Fisher, Reference Shively and Fisher2004). Bluffstone (Reference Bluffstone1995) finds similar results in Nepal; higher wages reduce smallholder deforestation, but only if there are paid employment opportunities available in remote areas. Nonfarm employment and improved wages in Honduras has also been associated with investments to improve cropland quality in Honduras and improved resource conditions in Uganda (Pender, Reference Pender2004). In El Salvador, as the employment opportunities and income per capita of agricultural wage owners declined, they relied increasingly on cultivating land for subsistence production. But rising income growth also enables poor and near poor households to acquire more land for cultivation, as a precaution against possible future income losses (González-Vega et al., Reference Gonazález-Vega, Rodríguez-Meza, Southgate and Maldonado2004). In Honduras, there is concern that the 30–50 per cent decline in real wages over the past decade has shifted upland households to income strategies emphasizing hillside cropland expansion and resource degradation that has worsened rural poverty (Jansen et al., Reference Jansen, Rodriguez, Damon, Pender, Chenier and Schipper2006). Similarly, in the Yucatán, because they have limited access to off-farm employment, the least poor households tend to oversupply labor to shifting cultivation and thus clear too much forest land (Pascual and Barbier, Reference Pascual and Barbier2007).
Although higher nonfarm income may discourage cropland expansion and deforestation, it does not necessarily follow that households will invest more in conserving and improving existing land. For example, Holden et al. (Reference Holden, Shiferaw and Pender2004) found that, in the Ethiopian highlands, better access to low-wage nonfarm employment improved substantially the income of households, but because it also reduced farming activities and food production, increased nonfarm income also undermined the incentives for soil conservation. Similarly, Pascual and Barbier (Reference Pascual and Barbier2007) find evidence that the poorest households in the Yucatán have a backward-bending supply curve for off-farm labor. As real wage rates rise, these households actually decrease their supply of labor to outside employment and increase clearing forests for shifting cultivation. In contrast, richer households respond to higher real wages by supplying more labor to outside work, thus reducing shifting cultivation and deforestation. In Malawi, the factors reducing forest pressure included favorable returns to nonforest employment, secondary education of the household head, and wealth (Fisher et al., Reference Fisher, Shively and Buccola2005).
In summary, the perception of a ‘poverty-environment trap’ as a two-way process in which poverty drives rural households to degrade the environment, and a deteriorating environment subsequently worsens poverty, needs to be revised. Although poverty–environment traps are still prevalent, they encompass more complex relationships involving links between asset poverty, lack of income opportunities or access to key markets for land, labor, and credit, and the availability and quality of natural resources, including land, to exploit. The following section develops a simple poverty–environment trap model to capture the key features of these linkages.
5. A poverty–environment trap model
A poverty trap is characterized by self-reinforcing patterns of chronic or persistent poverty (Barrett and Swallow, Reference Barrett and Swallow2006). Such patterns have been characterized in terms of the lack of nutritional status and the capacity for work by the poor (Dasgupta, Reference Dasgupta1993, Reference Dasgupta1997, Reference Dasgupta, Mäler and Vincent2003), or an asset-based approach to characterizing long-term structural poverty (Carter and Barrett, Reference Carter and Barrett2006; Carter et al., Reference Carter, Little, Mogues and Negatu2007). The following model encompasses elements of both labor and asset constraints. However, its main aim is to illustrate how an environment–poverty trap can easily arise for a poor rural household with access to only marginal lands and natural resources for its own production, and where formal or well-functioning markets for key economic assets and services, such as credit, capital, land, and insurance, are missing. In short, the household has only two productive assets readily accessible to it: the natural resources, including any low-productive land available for agriculture, in the surrounding environment; and the total unskilled labor of the household.
Consider a representative rural household living in a less favored area for agricultural production, i.e., upland areas, converted forest lands and drylands that suffer from low agricultural productivity, land degradation and lack of irrigation, and other inputs for intensive agriculture. The household also lacks access to formal or well-functioning markets for credit, capital, land and insurance. Thus, members of the household may participate in two broad types of economic activity: (i) production activities that rely on the natural resource endowment available to the household, including any common-property resources or agricultural land for agriculture and, if they choose, (ii) outside paid employment.Footnote 3 To sharpen the analysis and to simplify notation, aggregate household labor will be treated as homogeneous.Footnote 4 Without any loss of generality, it is also assumed that any household production and consumption of nonmarketed goods can be subsumed under the broad category of ‘leisure’ (Barnum and Squire, Reference Barnum and Squire1979).
In any period, the household is assumed to maximize a utility function with the standard properties

where x is a market-purchased consumption good, lu is leisure, and c is the household's consumption from its own production activities.
Let y be the household's aggregate output from its own production activities (e.g., food, cash crops, fuelwood or charcoal, harvested products), then the following production technology is assumed

where l, and v are, respectively, the household labor and purchased inputs employed to produce y. In addition, N is some measure of the quantity and quality of the natural resource endowment available to the household, including the available agricultural land, plus any other accessible natural resources in the surrounding environment that can be exploited or harvested, such as forests, fisheries, wild flora and fauna, and source of water supply.
The household may also allocate some of its labor, lw, to outside paid work, in exchange for cash wages or payments in kind (e.g., food and marketable products). Denoting L as the total labor available to the household implies that

Although the household always engages in its own production activities and leisure, the optimal hours of employment in outside paid work may be zero.
Given market prices, px, py, and pv for the corresponding commodities and the market wage rate, w, for outside employment, the household faces the following cash income constraint

The left-hand side of (4) represents the cash purchases by the household, and the right-hand side is its income. If y > c, then the first term on the right-hand side is the marketed surplus from the household's production activities; if c < y then the household buys more than it sells from its own production. If the household hires labor to assist in its production activities, then this labor is included in v, and the vector of input prices, pv, includes the market wage, w. The final term on the right hand side, M, represents exogenous nonlabor income (remittances, social transfers, rents).
Maximization of household utility (1) with respect to the constraints (2)–(4) yields the optimal levels of consumption of x, c, and lu, and of the purchased and labor inputs, v, l, and lw, respectively. From the first-order conditions, the optimal choices for l, lu, and lw are governed by

where λ is the shadow value of the household's total labor and leisure time and μ is the shadow value, or marginal utility, of additional cash income for the household. Condition (5) states that the household will equate the marginal value of leisure with that of its labor allocated to production activities, and the value of this labor may be equal to or exceed the given market wage for any paid work. If the value of household labor is insufficiently compensated by outside employment (i.e., λ/μ > w), then the household will not participate in the labor market (lw* = 0).Footnote 5
Let wR represent the reservation wage rate of the household; i.e., the value of its labor that just ensures that the optimal hours engaged in paid work is zero. Thus, the reservation wage is defined explicitly as
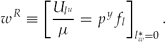
Two propositions therefore follow from (5) and (6):
Proposition 1.l*w > 0 iff w > wR, and l*w = 0 iff w ≤ wR.
The household will only engage in outside employment if the market wage received exceeds the household's reservation wage. If the wage for paid work is less than or equal to the reservation wage, then the household will not participate in the labor market.
Proposition 2.If w > wR then Ulu/μ = w is the equilibrium defining lu* and pyfl = w is the equilibrium defining l*.
When it is optimal for the household to devote some labor to outside employment, then its optimal allocation of leisure and labor allocated to production activities is determined by their respective values equated to the wage rate.
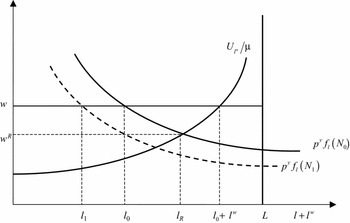
The relationships implied by these two propositions are depicted in figure 3. Using (3), the horizontal axis depicts the total labor allocated by the household to both production activities and outside employment. Leisure is therefore defined as L − l − lw. For a given quantity and quality of the natural resource endowment available to the household, N 0, the marginal value to the household of allocating labor to its own production activities, pyfl(N 0), is downward sloping because of the decreasing marginal productivity of labor, whereas the marginal cost of this allocation in terms of foregone leisure, Ulu / μ, is upward sloping because of decreasing marginal utility of leisure.Footnote 6 From condition (6), where these two curves intersect determines the reservation wage wR of the household. According to Proposition 1, if the market wage for hiring labor is equal to the reservation wage, then the household would not allocate any labor to outside employment,lw = 0. Instead, lR household labor would be involved in production activities and the remaining L − lR labor would be devoted to leisure. On the other hand, as shown in figure 3, if the household is offered a wage rate in outside employment higher than its reservation wage, w > wR, then the household would reduce both its labor allocated to production activities and to leisure in order to engage in outside employment. The household will devote l 0 labor to production activities, lw to paid work, and L − l 0 − lw to leisure. This equilibrium labor allocation satisfies Proposition 2.
Labor allocation by the poor rural household.

However, for its production activities, the household relies on agriculture and collecting or harvesting products from resource commons. As we have seen, agriculture on marginal lands is prone to land degradation, and many resource commons are subject to overexploitation due to uncontrolled access or under threat from development activities.Footnote 7 Thus, it is highly likely that the quantity and quality of the natural resource endowment available to the household may eventually decline, from N 0 to N 1. The result, as shown in figure 3, is that the labor productivity of the household's production activities will fall, as will its reservation wage.Footnote 8 The household will now allocate only l 1 labor to its own production activities, and much more labor will be devoted to outside employment. Leisure will be unaffected.
But in less favored areas there will be many poor households facing problems of environmental degradation from farming marginal lands and exploiting natural resources found in the commons or open access locations.Footnote 9 If there are large numbers of households seeking outside employment, the supply of labor for paid work is likely to exceed demand. The market wage for hired labor will decline. For some households, the wage rate will fall to the level of the reservation wage or even lower. As indicated by Proposition 1, these households would now stop seeking outside employment opportunities and instead allocate all of their labor to production activities and leisure. The danger for these households is that, at some point, the dynamics of a poverty–environment trap may ensue.
To see this, define  as the minimum production necessary to meet the basic, subsistence, health and nutritional needs of all household members. From (6), the reservation wage associated with this level of production is defined as
 . From Proposition 1, if
 , then the household will not allocate any labor to outside employment, even though the household is able only to meet minimum subsistence from its own production activities. However, there are even more severe consequences for the household if this condition is satisfied, which can be stated as
Proposition 3.Iff , then the household will fall into a poverty–environment trap as a result of any ensuing environmental degradation.
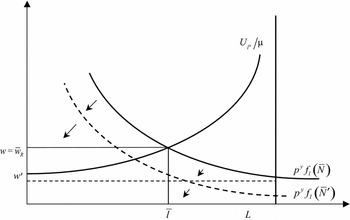
The dynamics associated with this trap are illustrated in figure 4. Suppose that, because the market wage rate has fallen to equal its reservation wage,  , a household has allocated all its labor to production activities and leisure. But this labor allocation,
 , only allows enough production to meet the basic needs of the household, . If the household faces problems of land degradation or declining common resources, then as shown in the figure, the labor productivity of the household's production activities will fall as
 declines to ′. The household's reservation wage will decline below the market wage, and following Proposition 1, the household will now devote some labor to outside employment. However, the total sum of labor allocated to outside employment and production activities will still total only ; the remaining L − household labor will remain as leisure. Since the returns to paid work and production activities are just equal to the original reservation wage, , the household will be producing and earning only enough to meet its basic needs. The effect of the environmental degradation is simply to force the household to look for outside work. If the household is able to obtain such employment, it does not allow the household to break out of the poverty trap of just meeting basic subsistence, health and nutritional needs.
The poverty–environment trap.

The dynamics of the poverty–environment trap can be even worse for the household if the environmental degradation problems are widespread in the region and affect many households. In that case, the large numbers of households seeking outside employment is likely to force down the market wage. As shown in figure 4, if the new wage w′ falls very low and is less than the household's new reservation wage, the household will not seek outside employment. But to meet its basic needs, the household must continue to devote to production activities. This is clearly a suboptimal labor allocation, as it violates condition (6). There is a further danger to the household, however. By putting too much labor into production activities, the household is likely to overexploit further common resources and degrade its marginal lands for agriculture.Footnote 10 As indicated by the directional arrows in figure 4, the result is even further declines in the labor productivity of the household, continuing misallocation of labor, and a deepening poverty–environment trap.
6. Final remarks
Because the tendency for the rural poor to be concentrated in the less favored areas of developing regions has a long history, it is a process that is difficult to reverse (Barbier, Reference Barbier2010). But the complex linkages underlying the poverty–environment trap highlighted here illustrate how important it is to begin this process if the objective of ending global poverty is to be realized. As shown in this paper, the poverty–environment trap is another manifestation of characterizing long-term structural poverty as the lack of nutritional status and the capacity for work by the poor (Dasgupta, Reference Dasgupta1993, Reference Dasgupta1997, Reference Dasgupta, Mäler and Vincent2003), or alternatively, their lack of access to key economic assets (Carter and Barrett, Reference Carter and Barrett2006; Carter et al., Reference Carter, Little, Mogues and Negatu2007). Similar policy approaches, therefore, are called for to address these problems.
There are several ways in which expanded global efforts can improve the livelihoods of the poor.
The first is to provide financing directly, through involving the poor in payment for ecosystem services schemes and other measures that enhance the environments on which the poor depend (Grieg-Gran et al., Reference Grieg-Gran, Porras and Wunder2005; Pagiola et al., Reference Pagiola, Arcenas and Platais2005; Alix-Garcia et al., Reference Alix-Garcia, De Janvry and Sadoulet2008; Barbier, Reference Barbier2008; Bulte et al., Reference Bulte, Boone, Stringer and Thornton2008; Wunder, Reference Wunder2008; Zilberman et al., Reference Zilberman, Lipper and McCarthy2008). Payments for the conservation of standing forests or wildlife habitat are the most frequent type of compensation programs used currently in developing countries, and they have been mainly aimed at paying landowners for the opportunity costs of preserving natural landscapes that provide one or more diverse services: carbon sequestration, watershed protection, biodiversity benefits, wildlife protection, and landscape beauty (Grieg-Gran et al., Reference Grieg-Gran, Porras and Wunder2005; Pagiola et al., Reference Pagiola, Arcenas and Platais2005; Wunder, Reference Wunder2008). Wherever possible, the payment schemes should be designed to increase the participation of the poor, to reduce any negative impacts on nonparticipants while creating additional job opportunities for rural workers, and to provide technical assistance, access to inputs, credit, and other support to encourage poor smallholders to adopt the desired land use practices. More effort must be devoted to designing projects and programs that include the direct participation of the landless and near landless.
The second is to target investments directly to improving the livelihoods of the rural poor, thus reducing their dependence on exploiting environmental resources. For example, in Ecuador, Madagascar, and Cambodia poverty maps have been developed to target public investments to geographically defined subgroups of the population according to their relative poverty status, which could substantially improve the performance of the programs in term of poverty alleviation (Elbers et al., Reference Elbers, Fujii, Lanjouw, Özler and Yin2007). A World Bank study that examined 122 targeted programs in 48 developing countries confirms their effectiveness in reducing poverty, if they are designed properly (Coady et al., Reference Coady, Grosh and Hoddinott2004).
Targeting the poor is even more urgent during major economic crises, which occur frequently in developing economies (Development Research Group, 2008; Ravallion, Reference Ravallion2008). Underinvestment in human capital and lack of access to financial credit are persistent problems for the extreme poor, especially in fragile environments. Low income households generate insufficient savings, suffer chronic indebtedness and rely on informal credit markets with high short-term interest rates. Two types of policies and investment programs targeted to the poor are essential in these circumstances. The first is a comprehensive and targeted safety net that adequately insures the poor in time of crisis. The second is the maintenance, and if possible expansion, of long-term educational and health services targeted at the poor. Unfortunately, during financial and economic crises, publicly funded health and education services are often the first expenditures reduced by developing country governments.
Ultimately, however, it is the lack of access of the rural poor in less favored areas to well-functioning and affordable markets for credit, insurance and land, and the high transportation and transaction costs that prohibit the poorest households in remote areas to engage in off-farm employment, which are the major long-run obstacles that need to be addressed. As we have seen in this paper, these problems lie at the heart of the poverty–environment trap. Others have reached a similar conclusion. For example, Carter and Barrett (Reference Carter and Barrett2006, p.195) note that the existence of a poverty trap threshold ‘depends on the degree to which the household is excluded from intertemporal exchange through credit, insurance or savings, whether formally or through social networks. A household with perfect access to capital over time and across states of nature would not face a critical threshold.’ Similarly, Shively and Fisher (Reference Shively and Fisher2004, p. 1366) maintain that ‘policies to reduce deforestation should focus on increasing returns to off-farm employment, strengthening rural credit markets, and ensuring farmers have secure tenure over existing agricultural land.’
In summary, as rural populations of the developing world continue to increase, the problem of growing numbers of assetless poor and their concentration in less favored areas remains a major development challenge. Although this review has shown that the rural poor are less likely to be responsible for much of the environmental degradation in the developing world than as previously believed, the difficulties posed by poverty–environment traps and labor, asset, and market constraints are considerable. Only by formulating novel policies targeted specifically at reducing these constraints for the rural poor in less favored areas will significant progress in reducing global poverty occur.