Introduction
Sampling methodology is one of the first issues that require consideration in any ecological study. In Canada, few studies have considered ant (Hymenoptera: Formicidae) assemblages and although ubiquitous, ants often occur at low densities in cool moist forests (Higgins and Lindgren Reference Higgins and Lindgren2006). Ants in particular are challenging because colonies, the ideal unit for surveying this superorganism (Hölldobler and Wilson Reference Hölldobler and Wilson2009), are often cryptic or embedded within a complex microlandscape, making identification difficult. Thus, by necessity, individual foragers are usually targeted for sampling. Prior to initiating ecological studies on ants it is important to consider sampling methodologies in the context of their natural history, as well as the data limitations associated with each technique (Bestelmeyer et al. Reference Bestelmeyer, Agosti, Alonso, Brandao, Brown, Delabie and Silvestre2000).
Pitfall trapping is a commonly used sampling methodology in ecological studies of ants. It is used for examining total species richness or assemblage structure and is recommended by the Ants of the Leaf Litter (ALL) Protocol (Agosti et al. Reference Agosti, Majer, Alonso and Schultz2000). Pitfall traps usually consist of a round cup partially filled with a preservative solution, and placed into the ground with the lip flush to, or just below, the surface (Laurent Reference Laurent1917; Woodcock Reference Woodcock2005). Unfortunately, there is little standardisation in pitfall trap design, and discussion relating to tailoring the design to a particular fauna is lacking. Vertebrate bycatch is commonly a problem with the conventional Laurent design leading to both ethical issues and the spoilage of trap contents by vertebrate remains (Pearce et al. Reference Pearce, Schuurman, Barber, Larrivee, Venier and McKee2005).
The mini-Winkler litter extraction technique has been increasingly used in research on ground-dwelling ants, particularly for tropical ecosystems, and is also recommended by the ALL Protocol (Agosti et al. Reference Agosti, Majer, Alonso and Schultz2000). Mini-Winkler litter extractors are used to sample litter-associated ants from small fixed-area plots, usually 1 m2 or less (Olson Reference Olson1991; Agosti et al. Reference Agosti, Majer, Alonso and Schultz2000). The literature varies with respect to reports of the comparative efficacies of pitfall trapping and mini-Winkler litter extractions in estimating total species richness (Fisher Reference Fisher1999; Martelli et al. Reference Martelli, Ward and Fraser2004; King and Porter Reference King and Porter2005).
The interpretation of trap catches is also an issue that requires consideration, particularly for pitfall trapping, given the natural history of ants. Some species form discrete, narrow trails leading directly to resource patches. These trails can be densely packed with travelling workers while immediate adjacent habitat is depauperate in ants (Sanders Reference Sanders1972; McIver et al. Reference McIver, Torgersen and Cimon1997). To date, this problem has not been widely recognised in the context of pitfall traps, but it is of critical importance if consideration is given to relative abundance values based on the number of individual ants captured by pitfall traps, as is frequently done (Savolainen and Vepsäläinen Reference Savolainen and Vepsäläinen1989; Bestelmeyer Reference Bestelmeyer2000; Dunn et al. Reference Dunn, Parker and Sanders2007).
Our three research questions were the following:
1. Is there another trap design, equally efficacious to conventional pitfall traps, but better focused upon ants?
We compared the efficacies and biases of two pitfall trap designs (Laurent Reference Laurent1917; Nordlander Reference Nordlander1987), with respect to species richness and ant size.
2. Are different sampling techniques more efficacious than pitfall trapping in sampling total species richness in cool moist forests?
We compared the efficacies of pitfall trapping and mini-Winkler litter sample extraction in estimating total species richness.
3. How do captures of individual ants in pitfall traps relate to ant colonies?
a) We examined the precision of captures of individual ants in pitfall traps by examining the distribution of ants in the immediate proximity of nests of the western thatching ant, Formica obscuripes Forel;
b) and, we determined if the apparent ant assemblage structure derived from a relative abundance estimation technique (pitfall trapping) is distinct from an absolute abundance technique (manual unit area sampling for ant colonies).
Methods
Pitfall trap design
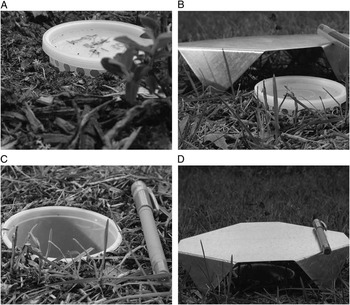
We compared Nordlander (Nordlander Reference Nordlander1987; Lemieux and Lindgren Reference Lemieux and Lindgren1999) and conventional Laurent pitfall traps (Laurent Reference Laurent1917) (often called Barber pitfall traps (Barber Reference Barber1931)), both with and without raised covers, with respect to sampling bias in ant size and total species richness (Fig. 1). Both Nordlander and Laurent pitfall traps consisted of 237 mL plastic cups (VWR Scientific Products, catalogue number 44333-002), used with an open top in the case of the Laurent but with a snap-on lid in the Nordlander configuration (Fig. 1). Following Bestelmeyer et al. (Reference Bestelmeyer, Agosti, Alonso, Brandao, Brown, Delabie and Silvestre2000), these pitfall traps are of medium size with an inner diameter of 7.5 cm and a circumference of 23.6 cm. Ant access to the Nordlander traps occurred through ∼25 holes (6 mm diameter) punched around the upper circumference just below the rim using a standard one-hole hand paper-punch. Ant access to the Laurent occurred simply by the insect falling over the open upper rim.
Pitfall trap designs tested at Topley, British Columbia. Each trap was filled with ∼80 mL of preservative solution comprised of 25% propylene glycol and 75% water. Photos show: (A) Nordlander design with no cover (NNC); (B) Nordlander design with cover (NWC) (note: cover moved for purposes of illustration); (C) Laurent design with no cover (LNC); (D) Laurent design with cover (LWC). Pen provided for scale.

Holes to set the traps were dug using a narrow garden trowel, and for the Nordlander traps the cups were placed into the ground such that the bottom of the holes were level with the surface of the soil/duff (Figs. 1A, 1B). A small amount of soil or moss was added to the top of the snap-on lid to reduce visibility to birds and mammals that might disturb the trap. Holes for setting the Laurent pitfall traps were slightly deeper, as these traps were positioned in the ground with the upper rim flush to the soil/duff surface (Fig. 1C). Raised covers consisted of a 20 cm square metal sheet with the corners bent down to hold the trap cover ∼4.5 cm above the ground (Figs. 1B, 1D). A small amount of soil or moss was also added to the tops of the covers to reduce visibility to birds and mammals. Thus, four trap configurations were tested: Nordlander trap with no metal cover (NNC), Nordlander trap with metal cover (NWC), Laurent trap with no metal cover (LNC), and Laurent trap with metal cover (LWC). Each trap was filled with ∼80 mL of a solution of propylene glycol and water (25/75 by volume). Propylene glycol has a relatively low mammalian toxicity, with an LD50 of 20 g/kg (oral rat) (Avantor 2008).
Trap designs were tested near Topley (54°28.8′N, 126°18′W, 1150 m), ∼50 km east of Houston, British Columbia, Canada in a 15-year postharvest stand. The experimental plot was located in the subboreal spruce biogeoclimatic zone, moist-cool subzone, variant 2 (Meidinger and Pojar Reference Meidinger and Pojar1991) and was dominated by lodgepole pine (Pinus contorta latifolia (Engelmann) Critchfield) (Pinaceae).
We laid out traps in a randomised complete-block design. Ten replicates of each of the four trap configurations were laid out with a distance of 10 m between traps and 25 m between replicate blocks. Sampling was conducted over a 4-week period between 25 June and 23 July 2004. Catches in traps were collected twice, but were pooled for each individual trap for the analysis.
We identified ants collected from the pitfall traps in the laboratory (see section “Ant nomenclature and identifications” for details). Following identification, each ant was measured for alitrunk length (in lateral view; from the anterior point of the pronotum to the posterior point of the propodeum) and maximum head width (in dorsal view) to the nearest 0.1 mm using a calibrated 10X ocular scale on a dissecting microscope (model Nikon SMZ-2B). While head width is poorly related to ant size in some studies (Kaspari and Weiser Reference Kaspari and Weiser1999), it was not known if this would be true for northern fauna. Alitrunk lengths and head widths derived from all individuals, of any given species in any one pitfall trap, were averaged to reduce the risk that a few traps might skew the data due to oversampling a large number of worker ants on a foraging trail. Thus only one datum was used in the analysis for each species in a trap.
We tested the data for homogeneity of variance using Levene's test in STATA (Proc robvar) (STATA 9.2©1985–2007). Following this step, traps were compared for size bias in captures and differences in species richness by fixed-effects multiway ANOVA. Model variables included the trap type (Nordlander or Laurent), cover (with or without), interaction between trap type and cover, and replicate.
Pitfall trapping and mini-Winkler litter sampling
We sampled in three, 15-year postharvest sites within the subboreal spruce biogeoclimatic zone, moist-cold subzone, variant 2 (Meidinger and Pojar Reference Meidinger and Pojar1991) within 60 km of Houston, British Columbia (54°24′N, 126°40.2′W) between June and August of 2004. The distances between the three sites ranged from 25 to 78 km. The site age and time of year were chosen to coincide with maximal ant colony presence and activity based on previous research in the area (Higgins Reference Higgins2010). Within each site, we positioned a 1 ha sampling plot, so that contact with natural or anthropogenic boundaries (e.g., forest edges, streams, roads, etc.) was minimised. The 1 ha plot was laid out in a Cartesian coordinate 25 × 25 m grid to facilitate the location of randomly chosen sampling sites.
We set Nordlander pitfall traps (NNC configuration; Fig. 1A) along four transects, each comprised of five traps, each separated by 20 m, for a total of 20 pitfall traps. Transect initiation points and azimuths were randomly determined, but were not allowed to overlap. Traps were operated for two nonconsecutive 2-week periods between late June and early July and then late July and early August of 2004.
Mini-Winkler litter extraction bags (Marizete Pereira dos Santos, Bahia-Brasil, CEP 45 660 000, Brazil) consisted of an inner nylon mesh bag capable of holding ∼2 L of sample with 4 mm openings. This mesh bag was suspended on a metal frame entirely within a larger cotton enclosure, closed at the top, which funneled into a lower collection cup filled with ∼80 mL of a 25% propylene glycol solution in water.
We collected litter samples from 0.5 m2 sampling areas at randomly chosen locations within the 1 ha plots. Ten samples were taken twice from each 1 ha plot between late June and August of 2004 with at least 2 weeks between subsequent sampling. We laid out a 0.5 m2 frame at the randomly chosen sampling location, and surface material was scraped into the centre of the frame. Any twigs or clumps of earth were broken-up by hand and then filtered through a 1 cm2 wire mesh within a sifting bag. Only material that passed through the sifting screen was used for the sample, which was then placed into a plastic bag and transported to the Houston Forest Products mill, Houston, British Columbia. The sample was then added to the mini-Winkler bags and hung for ∼48 hours in a shed where they were protected from rain and wind.
We derived the expected species accumulation curve (i.e., the expected total species richness for any given subsampling effort within the full sampling protocol) using the rarified Mao Tau combinatorial algorithm (Mao et al. Reference Mao, Colwell and Chang2005) in EstimateS (Colwell Reference Colwell2006). This was then fitted to a nonasymptotic logarithmic function (see below) using SigmaPlot Version 9.0 (Systat Software Inc., San Jose, California, United States of America) to allow for extrapolation of the expected species accumulation dataset. Following Soberón and Llorente (Reference Soberón and Llorente1993), the logarithmic function S(x) = 1/z ln(1 + zax) was used to fit data, where x is the number of samples (pitfall traps or mini-Winkler litter extractions), S(x) is the number of species accumulated at a given x (note: Soberón and Llorente (Reference Soberón and Llorente1993) described this equation as a function of sampling effort, specifically in units of time, here we use sample number as the unit of effort), and z and a are curve fitting parameters that control the rate of species accumulation. This model was then used to predict the number of samples required to add new species to the species list. In addition, the total species richness, as opposed to the observed species richness, was estimated by the incidence-based estimator, Chao2, using EstimateS (Walthur and Martin Reference Walthur and Martin2001; Colwell Reference Colwell2006). As sample size varied with technique (pitfall trapping, n = 20; mini-Winkler soil extractions, n = 60) due to other project objectives, each estimation for the pitfall traps was derived from 60 randomly drawn samples from the total dataset to match the mini-Winkler sample size.
Relating foraging ants to colonies: the spatial distribution of F. obscuripes ants
We examined the distribution of western thatching ant workers (F. obscuripes) in the immediate vicinity of their nest by sampling with Nordlander pitfall traps (NNC configuration; Fig. 1A). Five F. obscuripes nests, matched for approximate size and activity, were located on Becher's Prairie (51°58.2′N, 122°29.4′W, ∼930 m). Becher's Prairie is a cattle-grazed grassland within the interior Douglas-fir biogeoclimatic zone, very dry-mild subzone (Meidinger and Pojar Reference Meidinger and Pojar1991) ∼50 km west of Williams Lake, British Columbia. We surveyed the area around each nest to ensure that no other nests of the same species were within 100 m. Selected nests were separated by distances ranging from 162 to 788 m (average 448 m). Nordlander pitfall traps were placed each 10 m within a Cartesian coordinate 40 × 40 m grid centred on the nest such that there were 24 traps in total (no trap was placed directly on the nest in the centre of the grid). These were set on 9–10 August 2002, and remained open for 14 days. Ants captured by the pitfall traps were identified in the laboratory (see section “Ant nomenclature and identifications” for details).
The total abundance of individual F. obscuripes captured was plotted spatially around the nest to qualitatively assess the pattern of distribution. The patterns arising from individual captures were visually assessed to determine if they were precise between nests. The range in captures for pitfalls equidistant to the nest was tabulated and examined for consistency.
Relating foraging ants to colonies: relative and absolute abundance estimates of ant assemblage structure
We compared the relative abundance estimates of ant assemblage structure derived from Nordlander pitfall trap (NNC configuration, Fig. 1A) sampling to absolute abundance estimates derived from hand sampling for ant colonies in a structurally simple grassland ecosystem at Becher's Prairie (see above for details). We laid out five Cartesian coordinate 12 × 12 m plots along a transect within homogeneous grassland devoid of trees, with 50 m separating each plot. Pitfall traps were spaced 2 m apart within the 12 × 12 m grids, with no trap closer than 2 m to the edge of the grid, for a total of 25 traps. Pitfall traps were set on 7–8 August 2002, and remained for 2 weeks.
Following pitfall trap removal, we intensively hand-sampled the 12 × 12 m grid for ants by lifting rocks and loosening vegetation. When ants were located, the number was recorded as one of three classes (Few: 1–5; Several >5; or Colony), and their position within the grid were recorded. Only ant species for which a colony identification was possible (i.e., ant species which have colonies that may have multiple entrances spread across some area were excluded because of the difficulty in identifying a single colony) and only identifications of colonies (i.e., where ant numbers were recorded as a ‘colony’ as opposed to ‘few’ or ‘several’) were included in the data analysis. For example, Formica subpolita Mayr, was frequently encountered during hand sampling but as this species may have deep nests with several access points within the grid, making identification of the number of colonies uncertain, they were not included in the data analysis. This was the only species recorded in this study that needed to be excluded. Counts were restricted to colonies because we observed that counts of individual ants can be highly variable depending upon weather. Further, as the colony is conceptually the unit of organisation (Hölldobler and Wilson Reference Hölldobler and Wilson2009), it is a more appropriate metric for assessing ant density. Thus, the total colony counts by species, per 12 × 12 m sampling grid, were used to calculate the absolute assembly structure.
We assessed the relative proportions of each ant species both by simple presence or absence in pitfall traps and by the total number of individual ants of a given species in all traps in each plot. In the former, if 11 out of 25 pitfall traps contained a given species, that species was initially recorded as 0.44, which was then adjusted as a percentage of the total ant fauna for that plot. In the latter, the total number of individuals of a given species in all pitfall traps in each plot were tallied and then expressed as a percentage of the total ant fauna for that plot. Absolute abundances were assessed by total counts of colonies per unit area that were then adjusted to a percentage of the total ant fauna per plot.
Data for each species were tested for homogeneity of variance using Levene's test in STATA (Proc robvar) (STATA 9.2©1985–2007) then compared across the three-sampling/tallying techniques (i.e., absolute versus presence/absence in pitfall traps; absolute versus total abundance in pitfall traps; presence/absence versus total abundance) by one-way ANOVA. Tests for differences between the three pairwise sampling/tallying techniques were performed using a post-hoc Bonferroni test (STATA 9.2©1985–2007) when the F-value was significant.
Ant nomenclature and identifications
We followed ant species nomenclature as revised by Bolton et al. (Reference Bolton, Alpert, Ward and Naskrecki2006) except where more recent revisions have been made. We identified ants to species using the keys of Wheeler and Wheeler (Reference Wheeler and Wheeler1963), Francoeur (Reference Francoeur1973), Wheeler and Wheeler (Reference Wheeler and Wheeler1986), Naumann et al. (Reference Naumann, Preston and Ayre1999), and Hansen and Klotz (Reference Hansen and Klotz2005). Ants of the genus Myrmica were identified using an unpublished key provided by A. Francoeur (Centre de données sur la biodiversité du Québec, Chicoutimi, Québec). Voucher specimens will be deposited before 2013 with the Curator of Entomology at the Royal British Columbia Museum.
Results
Pitfall trap design
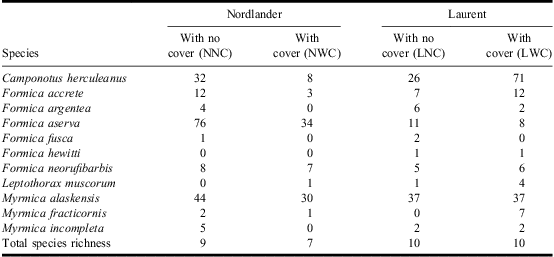
Eleven species of ants in four genera were identified in all trap types (Table 1). The genus Formica was the most common, with six species, but Myrmica alaskensis Wheeler (Myrmicinae) was the most commonly collected ant species. A mean of 2.5 species were collected per trap (Table 2) across trap types, and a total of 516 ants were collected over the 4-week sampling period.
Ant species captured (indicated by total captures of individuals) by each of four pitfall trap designs near Topley, British Columbia.
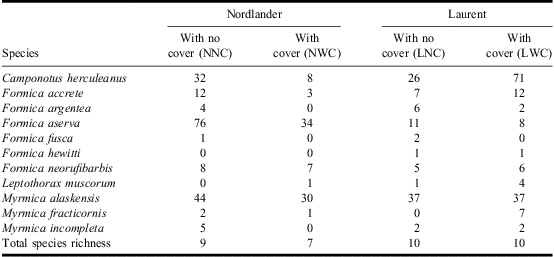
The four pitfall designs were laid out randomly within ten replicate blocks, which were sampled twice. Traps were put in place on 25 June and sampled on 9 and 23 July 2004. Although total abundance data are provided, analyses were performed on presence/absence data.
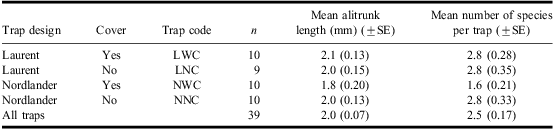
Mean alitrunk length and mean number of ant species collected (±SE) in each of four trap combinations in Topley, British Columbia.
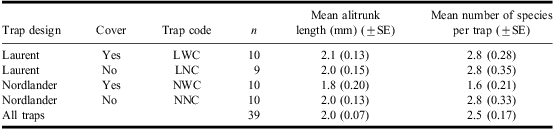
Traps were laid out on 25 June 2004 and sampled on 9 and 23 July. Number of sample traps = n. Variance in the number of sample traps arises from animal disturbance or unrelocated traps.
Both model factors (i.e., trap type (Nordlander or Laurent) and cover (with or without)), showed statistically significant differences in species richness, but there was also a significant interaction between trap type and cover (F = 5.27; df = 1,38; P = 0.003). This interaction was due to a reduction in catch caused by the raised cover when used with the Nordlander trap, reducing captures from a mean of 2.8 species to 1.6 species. The cover had no significant effect on the Laurent trap captures (Table 2).
Head width and alitrunk length correlated strongly (r > 0.9). Given the disproportionate caste-related variability in head width that does occur in some genera of Formicidae (Hölldobler and Wilson Reference Hölldobler and Wilson1990), and the observation that head width has been shown to be a poor indicator of overall ant size (Kaspari and Weiser Reference Kaspari and Weiser1999), only alitrunk length was used to assess trap type size bias. ANOVA indicated no significant differences for alitrunk length between trap types (Table 2) (trap type: F = 0.75; df = 1,16; P = 0.395; cover: F = 0.08; df = 1,16; P = 0.784; trap type and cover interaction: F = 1.45; df = 1,16; P = 0.239).
Pitfall trapping and mini-Winkler litter sampling
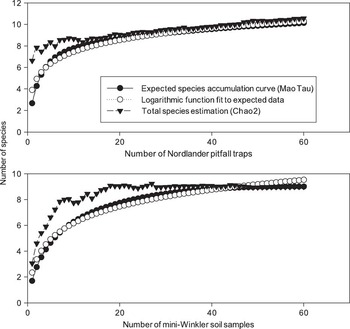
Nordlander pitfall trap sampling yielded the greatest number of collected species (Mao Tau), as well as total estimated species (Chao2) when compared to mini-Winkler soil-litter sampling (Fig. 2). An estimate of 11 species (95% CI: 11, 11) from 60 Nordlander pitfall samples, as compared to 9 species (95% CI: 9, 9.02) for equivalent sampling with mini-Winklers, arose from Chao 2 analyses, indicating a small but significant difference. Following the logarithmic function modelled to the expected species accumulation curve (Table 3), it is estimated that an additional 53 Nordlander pitfall samples would be necessary to add one more species while mini-Winkler soil-litter sampling would require 42 more samples.
Expected species accumulation curve (Mao Tau), fitted logarithmic function (S(x) = 1/z ln(1 + zax)) to the expected species accumulation curve, and incidence-based estimator (Chao2) approximation of total ant species richness derived from 60 Nordlander pitfall traps and 60 mini-Winkler litter samples collected in 2004. Sampling was performed in three, 15-year postharvest pine forest plots (subboreal spruce biogeoclimatic zone, moist cold subzone, variant 2 (Meidinger and Pojar Reference Meidinger and Pojar1991)). Mao Tau curve and Chao2 data calculated using EstimateS (Colwell Reference Colwell2006) while the logarithmic function follows Soberón and Llorente (Reference Soberón and Llorente1993).

Logarithmic parameters (S(x) = 1/z ln(1 + zax)), statistical fit (t statistic derived from null hypothesis in which model parameters (i.e., z, a) is considered zero; P-value is probability of null hypothesis being accepted), and extrapolation of an observed mean species accumulation curve (Mao Tau, EstimateS) derived from Nordlander pitfall trap samples and mini-Winkler litter extraction samples (n = 60).

Samples collected within 60 km of Houston, British Columbia, between June and August 2004.
1R 2 = 0.9712; adjusted R 2 = 0.9707; standard error estimate = 0.2477; estimated number of species at 60 samples = 10.27; estimated number of additional samples, beyond 60, necessary to add one additional species = 53.
2R 2 = 0.9727; adjusted R 2 = 0.9722; standard error estimate = 0.2814; estimated number of species at 60 samples = 9.52; estimated number of additional samples, beyond 60, necessary to add one additional species = 42.
Relating foraging ants to colonies: the spatial distribution of F. obscuripes ants
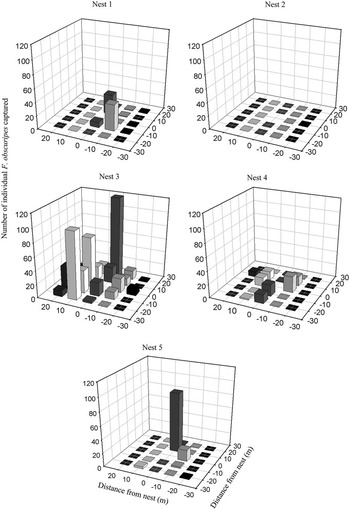
The distribution of F. obscuripes individuals in the immediate vicinity of their nests was unique to each nest and highly patchy (Fig. 3), failing to indicate any pattern relative to their proximity to the nest. Areas of most concentrated captures differed for each nest. Most of the nests included large areas within the 40 × 40 m grid in which no F. obscuripes ants were captured despite a relatively close proximity of the traps to the nest. In particular, Nest 2 (Fig. 3) collected only a single F. obscuripes ant in all grid pitfall traps despite observed worker activity, on and around the nest, appearing similar in activity to the other nests. Pitfall traps 10 m apart varied greatly in the number of individuals captured. In one case, one trap collected 120 ants while an adjacent trap, 10 m away, collected only 13 (Fig. 3, Nest 3). The maximum range in captures across the 24 pitfall traps at each nest overall was: Nest 1, 39; Nest 2, 1; Nest 3, 120; Nest 4, 24; Nest 5, 89.
Three-dimensional column plots of the distribution of captured individual Formica obscuripes ants in Nordlander pitfall traps around five established nests at Becher's Prairie, a grassland ecosystem, in 2003. The nest is in the centre position (0,0), in each plot. Nordlander pitfall traps were laid out each 10 m within a Cartesian 40 × 40 m grid for 14 days. Differing shade tones are used for visual contrast and do not represent any differences in the manipulated variable.

Relating foraging ants to colonies: relative and absolute abundance estimates of ant assemblage structure
Six species of ants, Tapinoma sessile (Say) (Dolichodinerae), Lasius crypticus Wilson, F. obscuripes Forel, F. subpolita Mayr (Formicinae), Leptothorax muscorum (Nylander), and Myrmica crassirugis Francoeur (Myrmicinae) were identified from the five 12 × 12 m plots laid out in this study. All six species were identified from both pitfall trap sampling and hand sampling. Of these, F. subpolita, was excluded from the final analysis as indicated in the section “Methods”.
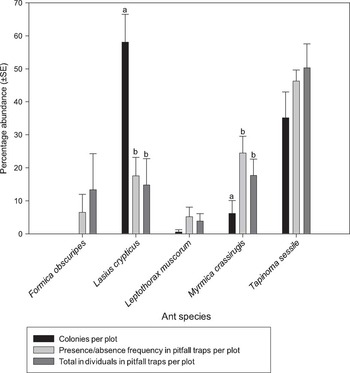
The abundance determination of species within the ant assemblage varied with both the sampling and analytical technique used to count ants and species (Fig. 4). The most common ant collected in Nordlander pitfall traps (relative abundance), either assessed as simple presence/absence per trap per plot or in total individuals in all traps per plot, was T. sessile. The most common ant species identified by hand sampling (absolute abundance) was L. crypticus. Leptothorax muscorum was the least common species, by all methodologies. No colonies of F. obscuripes were identified during hand sampling of the plots, but this species did turn up in traps in two of the plots that were ∼130 and 100 m from the nearest identified F. obscuripes nest.
Apparent assemblage structure, expressed as percentage abundance, of five species of ants at Becher's prairie, a grassland ecosystem, derived from relative and absolute abundance sampling of five 12 × 12 m plots in 2003. Relative abundance estimates (presence/absence frequency and total individuals per plot) were made using Nordlander pitfall traps, which were laid out in a Cartesian grid each 2 m within each plot. Pitfall traps operated over a period of 2 weeks. Absolute abundance estimates (colonies per plot) determined by hand sampling of the plots. Letters indicate significant differences between sampling categories.

Comparison of hand sampling (absolute abundance) to presence/absence per trap and total individuals in all traps (relative abundance) per plot by one-way ANOVA indicated a species-specific relationship. There were no significant differences between absolute or relative abundances for F. obscuripes (F = 0.89; df = 2,12; P = 0.49), L. muscorum (F = 1.21; df = 2,12; P = 0.33) or T. sessile (F = 1.47; df = 2,12; P = 0.27). Hand sampling (absolute abundance), for L. crypticus, resulted in an abundance of just under 60% of the total assessed fauna, while pitfall trapping, by either simple presence/absence tallies or total individuals, indicated a relative abundance of under 20% (Fig. 4). For this species, ANOVA across the three-sampling/tallying techniques did indicate a significant difference (F = 10.61; df = 2,12; P = 0.002) arising from two pairwise comparisons between absolute assemblage composition and both hand sampling and total individuals per plot (post-hoc Bonferroni, P = 0.007 and P = 0.004, respectively). Analysis of M. crassirugis across the three-sampling/tallying types also indicated a significant difference between groups (F = 3.98; df = 2,12; P = 0.05). Here the absolute assemblage composition for M. crassirugis was ∼6.2% as compared to an estimate of 24.5% derived from tallying presence/absence from pitfall traps (post-hoc Bonferroni, P = 0.05) (Fig. 4). No significant difference was noted between hand sampling and total individuals in all traps per plot (post-hoc Bonferroni, P = 0.34).
Discussion
Pitfall trap efficacy
Pitfall traps were first described in the literature by Laurent (Reference Laurent1917) although they are sometimes referred to as Barber traps (Barber Reference Barber1931; Lemieux and Lindgren Reference Lemieux and Lindgren1999). They are especially popular with entomologists working with epigaeic invertebrates because they are inexpensive, easy to install, and sample 24 hours a day (Agosti et al. Reference Agosti, Majer, Alonso and Schultz2000; Schlick-Steiner et al. Reference Schlick-Steiner, Steiner, Moder, Bruckner, Fiedler and Christian2006).
The Nordlander pitfall trap design has been compared to the conventional Laurent design by both Lemieux and Lindgren (Reference Lemieux and Lindgren1999) and Pearce et al. (Reference Pearce, Schuurman, Barber, Larrivee, Venier and McKee2005), although not in the context of sampling for ants, or for examining the effect of trap cover. Pearce et al. (Reference Pearce, Schuurman, Barber, Larrivee, Venier and McKee2005), focusing on Carabidae (Coleoptera) and spiders (Araneae), found the Nordlander captured fewer individuals than conventional designs but captured more species. Lemieux and Lindgren (Reference Lemieux and Lindgren1999), examining Carabidae, found Nordlanders and conventional pitfalls were 70% similar in the assemblage sampled and only differed significantly with respect to two species, with each trap type performing preferentially for one of these two species.
The significant interaction between pitfall trap design (Nordlander or Laurent) and the presence or absence of a cover, indicated an effect on the number of species sampled. Both trap design and cover combined such that the Nordlander trap with cover sampled the least species as compared to all others (Table 2). In practice, however, the Nordlander trap is used without a separate cover, making it equally efficacious (Table 2) to the conventional Laurent trap with cover, reducing concerns about trap efficacy. In a preliminary, five-replicate experiment of the same trap design configurations carried out in a different biogeoclimatic zone and with a different ant assemblage, we found no significant effect for any aspect of trap design. These data were excluded because of frequent trap disturbance by vertebrates, resulting in low sampling power. Nevertheless, these results confirmed that the Nordlander trap is suitable for sampling of ants in cool, temperate environments.
Despite the significant effect for species richness arising from the trap and cover interaction, no effect was noted for ant size (alitrunk length), suggesting that trap designs did not differ with respect to their size bias. Pitfall traps have been shown to be activity biased, with faster, usually larger species more frequently sampled (Lang Reference Lang2000; Hancock and Legg Reference Hancock and Legg2011). This was an initial and fortunately unfounded concern, given the possibility that a fast moving ant might avoid the more visible Nordlander trap or that large ant might perceive a 6 mm hole as constricting and therefore also avoid an interaction.
Although Pearce et al. (Reference Pearce, Schuurman, Barber, Larrivee, Venier and McKee2005) reported difficulty installing the Nordlander design in the field, we found that it was no more difficult to install than conventional pitfall traps. The Laurent design normally includes a physically separate cover fashioned from various materials (e.g., wood, metal, plastic, etc.) to protect the trap from flooding during rainfall and reduce evaporation of the trapping fluid. These covers can be bulky and cumbersome to carry in the field, particularly if high numbers of traps are used. As the Nordlander trap has lid integrated in the design, fieldwork can be simplified.
While a robust literature related to pitfall trapping exists (Greenslade and Greenslade Reference Greenslade and Greenslade1971; Work et al. Reference Work, Buddle and Korinus2002; Vogt and Harsh Reference Vogt and Harsh2003; Phillips and Cobb Reference Phillips and Cobb2005), the problem of vertebrate bycatch is largely ignored. Conventional open pitfall traps, here called Laurent traps (Laurent Reference Laurent1917), can easily trap small vertebrates. The Nordlander pitfall trap (Nordlander Reference Nordlander1987; Lemieux and Lindgren Reference Lemieux and Lindgren1999; Pearce et al. Reference Pearce, Schuurman, Barber, Larrivee, Venier and McKee2005) may provide a solution to this problem. As designed for this study, the only access is through the 6 mm holes, which should be large enough for all ants but too small to allow for vertebrate bycatch. No vertebrates were captured in any of the trap designs used in this study, so their relative performance could not be directly assessed. Additional and extensive use of the Nordlander design as described by Higgins (Reference Higgins2010) and McColl (Reference McColl2010) were also free of vertebrate bycatch. As vertebrate bycatch is a concern for institutional ethics committees in Canada operating under the guidelines established by the Canadian Council on Animal Care (CCAC 2007), the Nordlander pitfall trap is advantageous.
Pitfall trapping and mini-Winkler litter sampling
The need to rapidly assess the total species richness of a given taxon in a defined area is central to many ecological- and conservation-based studies. Although a wide variety of techniques exist, three are particularly common in the myrmecological literature. These are pitfall trapping, litter extraction (of which the mini-Winkler extractor is very common), and baiting (Bestelmeyer et al. Reference Bestelmeyer, Agosti, Alonso, Brandao, Brown, Delabie and Silvestre2000). The use of baits was found to be untenable in the low-density ant assemblages typical in the cool-moist, subboreal forests of west-central British Columbia. Several attempts with randomly placed baits during the course of our study failed to attract any ants over a period of 30 minutes. Pitfall traps and mini-Winkler litter extractions are, however, potentially viable sampling methodologies for estimating total species richness in these forests.
Most studies have shown both mini-Winkler litter sampling and pitfall trapping to produce unique species (Fisher Reference Fisher1999; Martelli et al. Reference Martelli, Ward and Fraser2004; King and Porter Reference King and Porter2005), although the mini-Winkler species assemblage, in our study, was entirely a subset of the pitfall trap assemblage. Nordlander pitfall trapping was shown to be more efficacious in both actual (i.e., Mao Tau) and estimated total species richness (i.e., Chao2) although the differences were not large (1–2 species for Mao Tau and Chao2, respectively). Logarithmic modelling of the Mao Tau species accumulation curve indicated, however, that it would require 42 additional litter samples to add one more species to the species list while it would take 53 additional Nordlander pitfall trap samples. This is likely because the asymptote of the logarithmic model for the mini-Winkler extractions does not appear to be as close to approaching a zero slope as is the case for the Nordlander pitfall samples (Fig. 4).
To our knowledge there has been only one study assessing the efficacy of pitfall traps and mini-Winklers in cool forests (Austria) (Tista and Fieldler Reference Tista and Fieldler2011). This work, as with ours, found that pitfall trapping was superior to mini-Winklers in sampling for total species richness, although to a greater degree than our own. It should be noted, however, that Tista and Fieldler (Reference Tista and Fieldler2011) used pitfall traps baited with honey and rum unlike our nonbaited pitfalls. The literature, though, is not consistent with respect to the performance of these two trapping techniques, and two factors may be important. First, pitfall trapping appears inferior to mini-Winkler litter sampling in tropical ecosystems where a well-developed litter fauna exists. For example, in the tropical rainforests of eastern Madagascar one study recovered five times the number of species using mini-Winklers as compared to small pitfall traps (18 mm diameter) (Fisher Reference Fisher1999). Second, in more temperate ecosystems mini-Winklers may appear superior to pitfall traps where the length of time pitfall traps remain in the field is short. For example, in temperate hardwood and pine forests in Tennessee (United States of America) litter sifting yielded 1.2–2.5 times the number of species as pitfall traps (Martelli et al. Reference Martelli, Ward and Fraser2004), a result similar to hardwood forests in Ohio (Ivanov and Keiper Reference Ivanov and Keiper2009). The poor performance of pitfall traps in these studies may have arisen from the relatively short period of trapping (48 and 72 hours, respectively). We trapped for a 2-week period, following Lemieux and Lindgren (Reference Lemieux and Lindgren1999), who used the same trap design (albeit larger) and operated in similar habitats.
Relating foraging ants to colonies: the spatial distribution of F. obscuripes ants
The information derived from the trapping of epigaeic invertebrates is normally considered suitable for determination of relative abundance information (Southwood and Henderson Reference Southwood and Henderson2000). These data may be calculated from tallies of total individuals or from simple presence–absence (incidence) observations. It is common in the myrmecological literature for tallies of total individuals captured to be used to derive relative abundance data (Savolainen and Vepsäläinen Reference Savolainen and Vepsäläinen1989; Bestelmeyer Reference Bestelmeyer2000; Parr and Chown Reference Parr and Chown2001; Wang et al. Reference Wang, Strazanac and Butler2001a; Schowalter et al. Reference Schowalter, Zhang and Rykken2003; Borgelt and New Reference Borgelt and New2005; Dunn et al. Reference Dunn, Parker and Sanders2007). The natural history of ant species and the manner in which they are distributed in the environment, however, should make myrmecologists wary of this approach.
Ants are social insects that usually create permanent to semi-permanent nests from which they forage. Foraging often results in the identification of resource-rich patches (e.g., honeydew producing aphids) to which the colony recruits a great number of workers, frequently along well-established trunk trails reinforced by pheromones (Sanders Reference Sanders1972; Hölldobler and Wilson Reference Hölldobler and Wilson1990; McIver and Yandell Reference McIver and Yandell1998). This is especially the case for ant species that have large foraging territories (e.g., thatching ants (McIver and Yandell Reference McIver and Yandell1998) or carpenter ants (Sanders Reference Sanders1972)), in which the distances required to reach resource-rich patches necessitate efficient travel. Pitfall traps placed in close proximity or directly upon such a trail may accumulate a great number of individual ants, while an identical trap just a short distance away may sample few. Further, the capture of large numbers of individuals may not be indicative of suitable resources in the immediate vicinity (few metres or tens of metres) of the pitfall trap as these individuals may simply be travelling through to a distant resource. For example, in our study, thatching ants, F. obscuripes, were captured more than 100 m from the nearest identified nest.
The patchy distribution of F. obscuripes around the five nests studied here suggest that the movement of workers is unique to each nest (Fig. 3) as would be expected for an ant focusing on the specific resources available within its foraging territory. In a Finnish study (Savolainen and Vepsäläinen Reference Savolainen and Vepsäläinen1989), two pitfall traps placed 5 m apart captured 30 and 1813 individuals of the boreal ant, Formica polyctena Foerster, at a distance of 10 m from their nest, and nine and 564 individuals at a distance of 60 m. This is consistent with the distribution in our study of F. obscuripes, which is ecologically similar to F. polyctena. In one instance, one pitfall trap collected 13 ants, as compared to 120 individuals in another pitfall trap just 10 m distant (Fig. 3, Nest 3). Traps surrounding one active colony (Fig. 3, Nest 2) yielded only a single individual throughout the entire 40 × 40 m grid sampled by 24 pitfall traps. The likely explanation is that this colony had well-established trunk trails leading out of the study grid and that the pitfall traps had not intercepted any of these.
Some authors have attempted to resolve the problem of highly variable captures of individuals by mathematically transforming the abundance capture data. This has included using a square root (Vanderwoude et al. Reference Vanderwoude, Andersen and House1997; Hamburg et al. Reference Hamburg, Andersen, Meyer and Robertson2004) or natural logarithm transformation of the total individuals captured. Other solutions reported in the literature include taking the number of individuals of a given species in a pitfall trap and dividing them by the total number of individuals of all species in the same trap to determine a proportional occurrence per pitfall trap or by adjusting the raw abundance of individuals by multiplying them by the frequency of occurrence (Lindsey and Skinner Reference Lindsey and Skinner2001; Wang et al. Reference Wang, Strazanac and Butler2001b). Although such transformations would reduce the extent of the problem, no biological rationale is provided to validate the specific transformations used.
Other authors, however, prefer to use frequency of occurrence data exclusively (Romero and Jaffe Reference Romero and Jaffe1989; Osborn et al. Reference Osborn, Goitia, Cabrera and Jaffé1999; Andersen et al. Reference Andersen, Hoffman, Muller and Griffiths2002; Martelli et al. Reference Martelli, Ward and Fraser2004), where each species is tallied only as present or absent in each pitfall trap. This is a more cautious approach to interpreting pitfall trap data that gives consideration to the natural history of ants. It is supported by the distribution of F. obscuripes reported here.
Relating foraging ants to colonies: relative and absolute abundance estimates of ant assemblage structure
Absolute abundances are defined as population counts that arise from sampling a landscape or specific habitat per unit area or volume while relative abundances refer to sampling data that cannot be translated into taxon density estimates (Southwood and Henderson Reference Southwood and Henderson2000). In the case of small invertebrates such as ants, only small areas can be effectively sampled for absolute abundance because of difficulties in locating nests, especially small cryptic nests (Anderson Reference Anderson1997) unless the nesting characteristics allow for focused searching (e.g., species that nest in woody debris). This is unfortunate, as noted previously, because counts of ant colonies represent the most appropriate metric for assessing presence or absence given the theoretical consideration of the ant colony as a superorganism (Hölldobler and Wilson Reference Hölldobler and Wilson2009) and the observation that the apparent abundance of foraging ants varies greatly with weather, time of day, and season. Pragmatic requirements, though, default to sampling techniques that are designed to concentrate on foraging ants. As a consequence, the issue that needs to be identified is the relationship between the apparent assemblage structure derived from relative abundance sampling and the less biased, at least in the context of ant colonies, estimates of absolute assemblage structure. In this study, we chose a grassland ecosystem to compare the apparent assemblage structure arising from these two sampling methodologies as this structurally simple ecosystem allows for accurate hand sampling of small areas.
Most notable was the observation that of the six species encountered, L. crypticus was the most common ant colony in the context of absolute abundance, but was much less common when considered in the context of relative abundance (i.e., pitfall traps) (Fig. 4). This is likely because this species is reported to normally tend root aphids or mealybugs for honeydew (Wheeler and Wheeler Reference Wheeler and Wheeler1963; Wheeler and Wheeler Reference Wheeler and Wheeler1986) and is likely less epigaeic than other species. Tapinoma sessile was the most relatively abundant species as determined from pitfall trapping, but less in absolute abundance (Fig. 4), although not significantly. This species is an active epigaeic forager that recruits quickly to food resources, a characteristic that makes them a common and efficient house pest (Wheeler and Wheeler Reference Wheeler and Wheeler1963). As pitfall trap catches are a function of both abundance and the relative activity of epigaeic organisms, the high capture rates of T. sessile are to be expected. In addition, the absolute abundance of M. crassirugis also differed significantly from relative abundance as determined through tallying pitfall captures by presence–absence (Fig. 4). Finally, it is notable that the absolute abundance of F. obscuripes was zero despite these ants being recovered in pitfall traps, in two cases more than 100 m from the closest nest. In our study area, F. obscuripes nests were spatially scattered at distances frequently >100 m and were unlikely to be included in the small plots used for this study. This observation, however, illustrates a basic limitation of absolute abundance sampling in that intensive hand sampling is necessarily limited spatially and may miss large ant colonies that forage over large areas.
Conclusion
The Nordlander pitfall trap was shown to be equally efficacious to the conventional Laurent pitfall trap in sampling species richness while reducing the risk of vertebrate bycatch and offering some practical advantages in field placement. These pitfall traps were marginally superior to mini-Winkler litter sampling in developing estimates of total species richness in the cool-moist, subboreal forests of British Columbia, although some of that advantage may arise from a long period (2 weeks) of pitfall trap placement in this study. The relationship between the capture of foraging ants in pitfall traps and their natal colonies is complex and not related to the number of individual ants in a pitfall. Only presence/absence data should be used when considering pitfall trap captures and it should be recognised that ant assemblage structure arising from these data is still distinct from the absolute assemblage structure that would be developed from an assessment of colonies in a given area.
Acknowledgements
We would like to thank Melissa Todd and Houston Forest Products (now West Fraser Timber Co., Ltd.) for supporting this project with staff time and material resources, as well as advocating for a partnership with the project team to develop a successful application for an industrial Natural Sciences and Engineering Research Council (NSERC) grant. This project could not have been completed without the field assistance of Deanna Danskin (University of Northern British Columbia – UNBC), David DeWit (Houston Forest Products), Honey Giroday (UNBC), Duncan McColl (UNBC), Laurel McDonald (UNBC), Anne McLeod (Houston Forest Products), Xiaokui (Lucy) Zhang, and Lisa Zukewich (UNBC). We also thank Michael Gillingham, Joselito Arocena, William McGill, Hugues Massicotte, and James Hanula for valuable comments on an earlier version of this manuscript. Additional funding was provided by an NSERC Discovery Grant to BSL.