Introduction
One of the aims of the Latitudinal Gradient Project (LGP) is to investigate how soil development changes with latitude and how this might, in turn, affect terrestrial ecosystems (Peterson & Howard-Williams Reference Peterson and Howard-Williams2001, Howard-Williams et al. Reference Howard-Williams, Peterson, Lyons, Cattaneo-Vietti and Gordon2006). This is especially important because Antarctic soils are “particularly fragile” (Campbell et al. Reference Campbell, Claridge, Balks, Campbell, Lyons, Howard-Williams and Hawes1997 p. 45) and least well developed in coastal areas (Bockheim Reference Bockheim2002). The weathering of rock provides materials and nutrients for soil to form and so changes in the rate at which weathering occurs may, through its effect on soils, influence the development of Antarctic ecosystems.
The principal factors controlling rock weathering are the rock itself, the climate and the length of time over which the weathering has operated (Robinson & Williams Reference Robinson and Williams1994). More recently, it has been recognized that it is the climate at the grain surface that is most important, in particular the temperature and moisture conditions (Warke Reference Warke2000). Although moisture conditions have been highlighted as being significant in determining the rate at which rocks breakdown (e.g. Yoshikawa et al. Reference Yoshikawa, Ishimaru and Harada2000, Hall et al. Reference Hall, Thorn, Matsuoka and Prick2002), data on the effects of different moisture levels is scarce.
Current rock weathering rates are very slow in the Arctic and Antarctic. For example, estimates of 0.3 mm a-1 in Svalbard (Jahn Reference Jahn1976) or between 0.2 and 1×10⁻⁹ mm a-1 in the McMurdo Dry Valleys (Summerfield et al. Reference Summerfield, Sugden, Denton, Marchant, Cockburn and Stuart1999) are similar to those found by André (Reference André and Slaymaker1995) for crystalline rocks in Scandinavian Lapland. However, it is not known what effect changes in temperature and precipitation may have on weathering rates.
This research used laboratory simulations to determine rates of physical rock weathering of granite collected from three locations on the Victoria Land coast. Laboratory simulations are a common means of estimating weathering rates (e.g. Hall & Hall Reference Hall and Hall1996), but Goudie (Reference Goudie2000) recommends that they be based, as much as possible, on field data and Robinson & Williams (Reference Robinson and Williams1994) stressed that it was the conditions of the rock rather than the atmosphere that were important. Using data gathered in the field the effects of two different rock temperature cycles and three moisture levels on the rate of break down of samples of rock from the three locations were investigated.
Methodology
Field locations and data
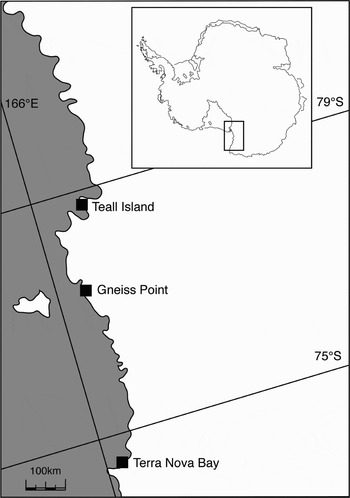
Three field locations (Terra Nova Bay: 74°41′S, 164°07′E, Gneiss Point: 77°24′S, 163°42′E and Teall Island: 79°03′S, 161°56′E) were selected along the Victoria Land coast (Fig. 1). These sites were chosen because they all had exposures of Granite Harbour Intrusives and they provided a latitudinal variation of approximately 4.5°. One rock group was selected to minimize the potential influence of rock characteristics on the results and within this rock group outcrops of medium-coarse grained granite were targeted.
Location of field sites in Antarctica.

The surface temperatures of large outcrops of rock were measured using 1 mm diameter copper-constantan thermocouples which were attached to the surface using an epoxy resin. Where practical the head of the thermocouple was covered with a rock chip or rock flour to maintain conditions as close as possible to those of the rock surface. Surface moisture was measured using a sensor that detected the presence of rainfall, dew, fog or snow. It consisted of a continuous loop of aluminium on a flat, rectangular board 11.5 by 7.5 cm with a track spacing of 1 mm. The narrow track spacing meant that the sensor could detect even the smallest amounts of moisture reaching the rock surface. The sensor responds to the presence of liquid water by recording conductivity and a zero value was returned when either no moisture was present or the surface was frozen (Elliott Reference Elliott2004). The sensors and thermocouples were connected to a Campbell CR10X datalogger which scanned at intervals of 20 seconds and stored averages at 1 or 3 hours. Subsurface moisture at 45 mm and 90 mm depths within the rock was recorded every four hours during times of field visits using a Vaisala Relative Humidity probe originally designed to measure moisture in concrete. The tip of the probe was made of a moisture sensitive polymer and the relative humidity, temperature, and dewpoint temperature of the air pocket at the tip of the probe were determined after the air in the pocket had been allowed to equilibrate to the temperature of the vapour in the rock. This was for at least 4 hours, and data recorded over several weeks/months. An empirical formula suitable for temperatures between ± 50°C was then used to calculate the vapour densities from the measured relative humidity and temperatures (Lowe Reference Lowe1977). Relative humidity, generally between 20% and 40%, was also collected during field visits using a Kestrel 4000 (a hand held instrument for measuring climatic variables).
The rock temperature and moisture levels were recorded for two aspects (south and west) at each of the sites during three summer seasons: 2002/03, 2003/04 and 2004/05 (Table I). Twelve month data was collected at Terra Nova Bay and Teall Island west-facing sites between November 2003 and November 2004 as well as the south-facing Teall Island site. Measurements on all four aspects and for all three seasons would have been ideal but equipment and logistic constraints meant this was not possible. South and west aspects were chosen because it was anticipated that these would usually produce the greatest contrasts in terms of climatic conditions. However, Hall (Reference Hall1998) reported that the northern aspect sometimes experienced the lowest rock temperatures in his study on the Antarctic Peninsula. In order to conserve battery life and memory capacity one hour averages were calculated for summer measurements and three hour averages for 12 month measurements.
Times, aspect and frequency of data collected in the field.

1One minute data was also collected during every visit.
Rock samples
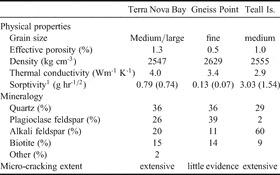
Boulders of Granite Harbour Intrusives were gathered at each field location and samples (10×5×5 cm) were later cut from these. The boulders had been examined visually for soundness in the field before being selected but those that showed significant internal weathering or cracking during sample preparation were subsequently discarded. Although one rock group was selected differences in the characteristics of the rocks between sites were evident. This was particularly the case for grain size, porosity, thermal conductivity and sorptivity (Table II).
Characteristics of the rock samples from each location.

1A measure of the ability of a rock to absorb moisture (Alexander et al. Reference Alexander, Mackechnie and Ballim1999). Measured both at room temperature and below zero (figures in brackets).
Laboratory simulations
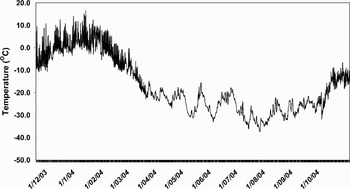
The laboratory simulations were conducted using a commercial freezer that had been adapted for the purpose. The freezer had a fan that circulated the air and holes were drilled (and subsequently sealed) to enable four thermocouples and an intake for dry air to be inserted. The freezer was programmed to undertake temperature cycles that were estimated from the rock surface temperatures gathered in the field. The temperature cycles were determined using the average of the surface temperatures from the west-facing aspect at each location (Fig. 2). The west-facing aspect was chosen partly because of its exposure to the Antarctic Ice Sheet and partly because this was the aspect for which 12 month data was available. Summer was deemed to occur between the beginning of December and the end of January and spring/autumn the two months of November and February. Although an attempt was made to fit curves to the data using Fourier series this was not particularly successful so the 75th and 25th percentiles were calculated and the inter-quartile range was used to estimate the temperature cycles to be used in the simulations (Table III).
Mean of the Terra Nova Bay and Teall Island three hourly west-facing rock surface temperatures between November 2003 and November 2004 used to determine experimental temperature cycles.

Estimated rock surface temperatures used in the simulations and resultant freezer temperature of the air in the freezer.

In order to complete the experiment in a reasonable time frame it was necessary to accelerate time. This is a common approach in rock weathering simulations. Lautridou & Seppala (Reference Lautridou and Seppala1986) for example, used a temperature change of 3–4°C hr-1 until temperatures reached -5°C and then 5°C hr-1 thereafter whereas Hall (Reference Hall1988) used a variety of rates of change from 1°C hr-1 to 6°C hr-1. Six cycles per 24 hours provided a timescale that was feasible within the time available for this experiment and gave temperature gradients that were consistent with Lautridou & Seppala (Reference Lautridou and Seppala1986) and Hall (Reference Hall1988) (Table III). The summer and spring/autumn temperature cycles only were undertaken.
Three moisture levels were applied to five replicates from each of the three locations. After investigating various methods of wetting the rock samples, it was decided to moisten them by soaking at room temperature at intervals of 3–4 days. A small controlled experiment was undertaken to estimate potential soaking times that would approximate ‘half’ and ‘full’ saturation of the least porous of the rocks (Gneiss Point, Table II). Five replicates from each location were then soaked for seven minutes to simulate ‘half’ saturation and another set of five replicates soaked for one hour to simulate ‘full’ saturation. The exterior was patted dry using an absorbent towel and the samples were re-weighed before being returned to the freezer. One set of replicates received no soaking.
Within the freezer thermocouples were attached to the surface of one rock sample from each of the locations and a fourth was used to monitor the air temperature. The temperature of a thermocouple attached to one of the Gneiss Point samples that was not to be soaked was used to switch the freezer on and off and produce the required temperature cycles (Table III). This meant that the air temperature in the freezer was a response to the cycling of the surface of the Gneiss Point rock rather than the other way round.
The actual as well as relative humidity of the freezer were also recorded and dry air was pumped into the freezer when the uppermost tolerance level for humidity was reached (based on the relative humidity levels recorded in the field). In practice this was rarely needed as the low temperature levels of the freezer maintained the necessary humidity levels.
Determination of weathering rates
The same set of samples were subjected to a simulated five years of weathering using the calculated temperature cycles (371 cycles between +6 and 0°C and 354 cycles between +2 and -6°C) and moisture levels. Weathering effects were then estimated by measuring changes in the dry weight of the samples (e.g. Hall & Hall Reference Hall and Hall1996). Prior to the start of the temperature cycling the samples had been oven dried at 60 to 65°C, weighed to an accuracy of three decimal points of a gram and their effective porosity determined by comparing dry and vacuum saturated weights. The samples were oven dried slowly over two days at the end of each set of temperature cycles and the weights recorded and the cycles were run back to back.
Weight loss can be greatly influenced by the particular micro-characteristics of the individual samples, particularly grain size and extent of micro-cracking, and so within group changes were examined at the end of each set of temperature cycles using a series of box plots (McClave & Sincich Reference McClave and Sincich2000). These identified both ‘outliers’ (defined as cases with values between 1.5 and 3 box lengths from the upper or lower edge of the box, where the box length is the inter-quartile range) and ‘extremes’ (defined as cases with values more than 3 box lengths from the upper or lower edge of the box, where the box length is the inter-quartile range) and the extremes were excluded from the subsequent statistical analysis to prevent the results from becoming overly influenced by these values. One-sided paired sample t-tests were conducted to compare weight loss between the initial weights and those after each set of temperature cycles. Analysis of variance was undertaken when comparing means between moisture levels for the three temperature cycles.
Repeated measures analysis was used to investigate any significant moisture-cycle interaction or main moisture or temperature cycle effects (i.e. the effect of moisture over all temperature cycles or the effect of temperature cycles over all moisture levels). This technique has been used in ecological studies and applies to situations where there are a number of population groups each of which is measured over either different time intervals or sets of treatments (von Ende Reference von Ende, Scheiner and Gurevitch1993). In this case the three moisture levels are the population groups and the temperature cycles are the second set of treatments, which are considered as dependent variables.
Results
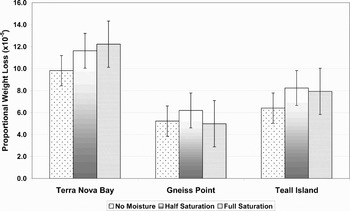
After simulation of five years of weathering weight loss (P < 0.05) was recorded for the rock samples from all locations at every moisture level (Table IV). A plot of proportional weight loss (×10-5) against location is given in Fig. 3. The greatest weight loss at each moisture level was for the Terra Nova Bay samples and within that group the greatest weight loss was for those samples that had received most moisture. The Gneiss Point samples experienced least weight loss, regardless of moisture level, but within the Gneiss Point and Teall Island samples it was the lower of the two moisture levels where most loss occurred. However, variability between replicates meant that a significant moisture effect (P < 0.005) was found only in the Gneiss Point samples between the half saturation and no moisture and the half saturation and full saturation samples (Fig. 3).
Proportional weight loss for the cumulative effect of all temperature cycles. Error bars are ±1 s.e. from the mean.

Weight loss following all temperature cycles (where n is the number of replicates and s.d. is the standard deviation of the samples).

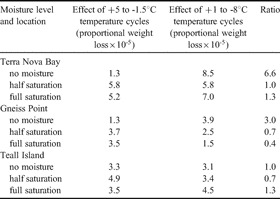
Following the +5 to -1.5°C temperature cycles, significant weight loss (P < 0.05) occurred at the end of each set of temperature cycles (Table V) with the exception of the Terra Nova Bay no-moisture samples. Repeated measures analysis indicated that there was a statistically significant (P < 0.05) linear temperature cycle effect for the samples from all three locations i.e. weight loss was affected by the particular temperature cycle being undertaken. However, the effect of the temperature cycle varied depending on the levels of moisture used. In particular, the Terra Nova Bay no-moisture samples experienced more than six times the proportional weight loss as a result of the +1 to -8°C cycles compared to the +5 to -1.5°C cycles. This was also the case for the Gneiss Point samples where the +1 to -8°C cycles had three times the effect of the +5 to -1.5°C cycles. However, when moisture was applied to the Gneiss Point samples the +1 to -8°C cycles could be less than half as effective as the +5 to -1.5°C cycles (Table V).
Effect of different temperature cycles on proportional weight loss of the replicates (see Table IV for numbers of replicates, weights and standard deviations).

Estimates of weathering rates were made by calculating the amount of surface lowering (δx) of the rock blocks using the measured weight loss and the previously calculated density of the blocks:

where δm is the relevant weight loss in grams and ρ is the density in g mm-3
Across all samples the average rate of surface lowering was 0.16×10⁻³ mm a-1 but, depending on the particular samples, this ranged from 0.11×10⁻³ mm a-1 (Gneiss Point) through 0.16×10⁻³ mm a-1 (Teall Island) to 0.23×10⁻³ mm a-1 (Terra Nova Bay).
Discussion
The estimated weathering rates found in this experiment were of the same order as those found by Summerfield et al. (Reference Summerfield, Sugden, Denton, Marchant, Cockburn and Stuart1999) using cosmogenic isotope dating for the McMurdo Dry Valleys and André (Reference André and Slaymaker1995) for crystalline rocks in northern Scandinavia using field methods. Spate et al. (Reference Spate, Burgess and Shevlin1995) found much higher estimates of weathering rates using micro-erosion meters on the high quartz content gneiss of the Larsemann and Vestfold hills, East Antarctica. Samples of granite from each of the locations investigated in this research were all subjected to the same temperature and moisture conditions in the freezer and yet produced markedly different weathering rates. The strength of granite is affected by grain size and shape, quartz content, porosity and extent of micro-cracking (Attewell & Farmer Reference Attewell and Farmer1976). Although smaller grain size increases rock strength (because of greater inter-grain contact), the length of contact between grains can decrease the strength as a result of increasing susceptibility to weaknesses at grain boundaries. In addition, the tensile strength of a rock is inversely proportional to its quartz content so that the greater the quantity of quartz the weaker the rock (Merriam et al. Reference Merriam, Rieke and Young1970). Low porosity and high density rocks are also stronger.
The Gneiss Point granite was fine grained, the least porous and revealed little micro-cracking under thin section analysis (Table II) supporting the lower of the weathering rate estimates of 0.11×10⁻³ mm a-1. In contrast the Terra Nova Bay granite had medium to large sized grains, the highest level of porosity of the rocks investigated and showed evidence of extensive micro-cracking resulting in a higher weathering rate of 0.23×10⁻³ mm a-1. The Teall Island rock had middle values of these characteristics and an estimated weathering rate of 0.16×10⁻³ mm a-1. However, both the Terra Nova Bay and the Gneiss Point rock had the same proportion of quartz (36% as determined by modal analysis) indicating that grain size and porosity had a greater influence on the weathering rate of these rocks than quartz content. Therefore, the specific combination of rock characteristics, even within the same rock group, can have an important role in determining weathering rate.
Global Climate Models (GCMs) predict that the effects of any future climate change will be greatest at the poles, particularly in winter (Callaghan et al. Reference Callaghan, Press, Lee, Robinson and Anderson1999). Any change in climate is likely to manifest itself as increased temperatures (perhaps by as much as 2.5°C by 2050) and precipitation, although the effect on the latter is less clear (Fitzharris Reference Fitzharris, Watson, Zinyowera and Moss1996). Fountain et al. (Reference Fountain, Lyons, Burkins, Dana, Doran, Lewis, McKnight, Moorhead, Parsons, Priscu, Wall, Wharton Jr and Virginia1999) expected that even very small variations in temperature and precipitation, because they can lead to extreme variations in the hydrologic regime, would have a potentially great impact in Antarctica.
The temperature of the freezer in this experiment can be considered to be the air temperature for this part of the Victoria Land coast and the two cycles considered as proxy summer (+5 to -1.5°C) and spring/autumn (+1 to -8°C) air temperatures. The three moisture levels can also be considered as proxies for three different precipitation scenarios. The results of the effects of the two temperature cycles and three moisture levels employed in the laboratory simulations can then be used to infer what may happen to rates of weathering of granite rocks from these three locations should there be future shifts in temperature and precipitation.
As noted earlier, under the same temperature conditions, more physical weathering occurred in the Terra Nova Bay samples than either Teall Island or Gneiss Point regardless of moisture level but the presence of additional moisture appeared to enhance the weathering effect (Fig. 3). However, a significant moisture effect was only found in the Gneiss Point samples between the half saturation and no moisture and the half saturation and full saturation samples indicating that moderate levels of moisture were more effective in producing weight loss in these rocks than either low or high levels. The lack of a significant moisture effect in the Terra Nova Bay and Teall Island samples implies that, at least under the moisture conditions used here, increased precipitation would have little influence on weathering rate.
The finding of a significant temperature cycle effect for the samples from all three locations indicates that a change in the ratio of summer (+5°C to -1.5°C) to spring/autumn (+1 to -8°C) temperatures could produce a change in weathering rate (Table V). For instance, a climate scenario where there was a change in air temperature sufficient to produce a 10% increase in the number of summer cycles (and a corresponding 10% decrease in spring/autumn cycles) is given in Table VI. Winter rock temperatures were so much lower (-20 to -30°C) than either the summer or spring/autumn temperatures that it was assumed any moderate increase in air temperature would be insufficient to affect the number of winter cycles.
Predicted change in weathering following a 10% increase in summer temperature cycles (see Table IV for numbers of replicates, weights and standard deviations).

Because the effect of the two temperature cycles differed depending on moisture level (Table V) a 10% change in the ratio of spring/autumn to summer temperature cycles was only noticeable in the no moisture samples from Terra Nova Bay and Gneiss Point (Table VI). The much greater influence of the spring/autumn (+1 to -8°C) temperature cycles in producing rock breakdown resulted in a reduction in proportional weight loss in the samples. This implies that a change in air temperature sufficient to increase the number of summer (+5 to -1.5°C) temperature cycles, and a similar reduction in the spring/autumn ones, is more important than the levels of moisture in determining rates of weathering. However, the magnitude of this effect was dependent on the particular rock samples so that those from Terra Nova Bay and Gneiss Point that had the higher levels of quartz and thermal conductivity but lower levels of sorptivity were affected the most and these differences appeared to override other differences such as porosity and grain size (Table II). Consequently, when investigating weathering rates under different temperature regimes the proportion of quartz in the rock, together with the ability of the rock to absorb heat and moisture should be considered.
Conclusions
Estimates of weathering rates following a simulated five years of weathering were of the same order of magnitude as those found in other studies but varied according to the particular characteristics of the rock, especially grain size, porosity and extent of micro-cracking. Rates, as determined by measured weight loss, were greatest in the Terra Nova Bay samples and least in the Gneiss Point samples, regardless of moisture level. However, a significant moisture effect was only found between the half saturated and no moisture and the half saturated and full saturation Gneiss Point samples, implying that lower levels of moisture were more effective than higher ones in producing weight loss. The temperature cycle used had a significant effect on the rates of breakdown of samples from all the locations but the magnitude of this effect varied with moisture level. For instance, the Terra Nova Bay no moisture samples experienced more than six times the weight loss following the spring/autumn cycles (+1 to -8°C) than the summer ones (+5 to -1.5°C). The spring/autumn cycles also produced more weight loss in the Gneiss Point no moisture samples but the addition of moisture reversed this effect so that the spring/autumn cycles could be as much as 40% less effective than the summer ones. When comparing weathering rates under different temperature regimes quartz content, thermal conductivity and sorptivity were the important characteristics of this rock type. The different effect of the temperature cycles indicated that under a future climate scenario where there was, for example, a 10% increase in the number of summer temperature cycles and a corresponding decrease in the spring/autumn ones little change in weathering rate would occur at Teall Island regardless of increases in moisture. However, weathering rate decreased in the samples from Terra Nova Bay and Gneiss Point that had no moisture added.
Acknowledgements
Grateful thanks to my supervisors; Ian Owens, Barry Fahey and Bryan Storey and to the Department of Geography and Gateway Antarctica at the University of Canterbury. Also to Antarctica New Zealand for their financial, logistical and other support and to the Italian Antarctic Programme for their patience, support and hospitality during the time spent at Terra Nova Bay. I would also like to thank the reviewers whose comments on the initial draft have made this a much improved paper and to Megan Balks from the University of Waikato for reading and commenting on this draft.