


I. INTRODUCTION
Research in the field of MEMS resonator has generated different techniques using periodical pattern especially for realizing piezoelectric aluminum nitride (AlN) bandpass filters [Reference Piazza, Stephanou and Pisano1–Reference Johnson6] and band gap filters [Reference Mbairi and Hesselbom7–Reference Kazakevicius and Brazis9]. The technology and the approaches proposed in the works concern: new class of single-chip AlN multiple-frequency behaving as micromechanical bandpass filter [Reference Piazza, Stephanou and Pisano1–Reference Piazza, Stephanou and Pisano3, Reference Cady5, Reference Johnson6], bulk acoustic wave devices [Reference Lakin4], microwave, and millimeterwave (mm-wave) bandstop filters using artificial periodic substrate electromagnetic band gap (EBG) [Reference Mbairi and Hesselbom7], microstrip band gap structures [Reference Griol, Mira, Martinez and Marti8], and surface modes propagating in multiple metallic layers [Reference Kazakevicius and Brazis9]. In particular, concerning the tailored devices, periodic configurations are studied for the analysis of bandstop and bandpass frequency regions obtained by band gaps. The band gaps and the cutoff frequencies, can be generated by changing the electromagnetic properties of period waveguides, for example, by applying forces on the piezoelectric material: in this case the stress properties of the piezoelectric material generates a variation of the electromagnetic field, which characterizes the guided modes of the periodic structure and the parameters of the equivalent transmission line circuit. The guided modes are defined by the working frequency and by the geometry. Several modes depending on the layout configuration can propagate along the periodic waveguides by defining the frequency response and the resonance conditions of the sensor.
The proposed layout consists of seven circular air holes arranged in a transmission line as illustrated in Fig. 1(a). The holes are etched until the Mo layer 2 (see Fig. 1(b)), and are characterized by a diameter of 2 mm and by a period of 3 mm. The width of the periodic transmission line is 4 mm. The thickness of the upper Mo layer, of the AlN layer and of the bottom Mo layer are 70, 500, and 100 nm, respectively. In this work: (i) we fabricate the proposed microwave/RF filter; (ii) we characterize its trasnmittivity response in a frequency range between 1 and 36 GHz by means of a network analyzer that measures the scattering S 12 parameter of the chip; (iii) then we analyze the effect of the pressure on the chip on the frequency response; (iv) we check the pressure sensing of the proposed device by means of a properly designed three-dimensional finite-element method (3D-FEM) tool; and (v) finally, we analyze the band gap properties at high frequencies useful for RF-filtering applications.
(a) Chip with central microwave/RF MEMS filter. (b) Cross-section of the filter with pressure applied in the middle of the periodic structure.

II. TECHNOLOGICAL ASPECTS
The AlN thin film, sandwiched into two molybdenum (Mo) electrodes, is grown on a substrate consisting of a thin SiO2 sacrificial layer on a thick (100) silicon substrate. Molybdenum has been chosen as electrode material because of its capability to promote a preferential (002) orientation of the AlN film and its low resistivity. The AlN and Mo films are grown by DC magnetron sputtering using an LLSEVO Unaxis sputtering system. The growth conditions have been optimized to achieve a good compromise between adhesion stability and crystallographic quality. Different steps of optical lithography and well-controlled both dry and wet etching are used to define the pattern of the proposed microwave/RF MEMS filter; in particular, we use a step lithography (negative mask and positive resist) and wet chemical etching H2O2, H3PO4-based solutions to remove the upper Mo layer and the AlN layer, respectively, in the region where is impressed the periodic structure of Fig. 1(a).
III. EXPERIMENTAL SETUP
Concerning the experimental setup, the chip is coupled to the coaxial cables of the Agilent 8510 c network analyzer by means of two identical tapered waveguides as illustrated in Fig. 2(a). The tapered waveguides are properly designed to match the input and the output ports with the 50 Ω impedance of the cables: the materials used are Polyvinyl Chloride (PVC) and copper (metal for the electric contacts). The tapered profile is characterized by the following geometrical parameters reported in Fig. 2(b): height W = 6.5 mm, height T = 1 mm, and L = 30 mm.
(a) Image of the used experimental setup. (b) Layout of the tapered waveguides used in the experimental setup.

The design of the tapered waveguides is based on the calculus of the characteristic impedance of a microstrip line given by [Reference Pozar10]

where W, s, and ɛ e are the substrate thickness, the conductor width, and the effective refractive index of the microstrip line, respectively. We observe that the effective refractive index is approximately [Reference Pozar10]

where ɛ r is the relative permittivity of the material of the tapered waveguides.
The calibration process [Reference Farina, Morini and Rozzi11] is performed by contacting the two tapered waveguide connected to the two ports of the network analyzer.
The final experimental setup is composed of the following components:
• two tapered waveguides with copper as metal for electric contacts (the tapered waveguides couple the coaxial cables of the network analyzer with the sensor);
• two connectors for the electric contact between coaxial cables of the network analyzer and the tapered waveguides;
• a set of weights;
• a network analyzer.
IV. BASIC PRINCIPLE AND FEM MODELING
The applied pressure changes the electromagnetic properties of the guided modes through the stress relationships of the AlN layer between the stress T, the strain S, the electric field E, and the electric displacement field D

where c E, e, and ɛ r are the elasticity matrix, the coupling matrix, and the relative permittivity matrix, respectively, defined for the AlN material as (FEMLAB libraries)
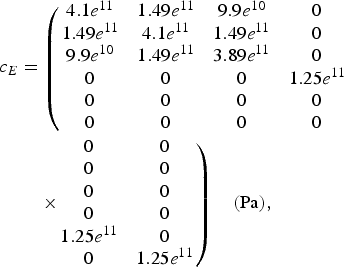


The stress of the piezoelectric material, due to applied weights, can generate gains or losses of the transmittivity response by new cutoff frequencies.
Concerning the 3D-FEM modeling, Fig. 3 shows the 3D-FEM mesh of the proposed pressure sensor where the structure is discretized by tetrahedrons. The value of a vector field quantity (such as the H-field or E-field) at points inside each tetrahedron is interpolated from the vertices of the tetrahedron. At each vertex, an FEM-based solver stores the components of the field that are tangential to the three edges of the tetrahedron. In addition, FEM stores the component of the vector field at the midpoint of selected edges that is tangential to a face and normal to the edge. The field inside each tetrahedron is interpolated from these nodal values. By representing field quantities in this way, the system can transform Maxwell's equations into matrix equations that are solved using traditional numerical methods and implementing equations (3)–(6).
3D-FEM modeling and 3D-FEM mesh of the microwave/RF pressure sensor.

For the simulation we use a modified FEM tool used for photonic crystals design [Reference Massaro12]: this tool allows us to define the input and the output of the sensor as two wave ports indicated in Fig. 3 as ports 1 and 2. We note that the 3D-FEM modeling considers the same surface touched by weights used during the experimental process.
The frequency passing/stopping principle due to the pressure is schematically illustrated in Fig. 4. The periodic layout allows the electromagnetic field to resonate at a frequency f 0. Consecutively, working at f 0 (frequency of resonance), the modes will propagate along the waveguide from the input port to the output port as illustrated in Fig. 4(a). When the pressure is applied, the waveguide becomes deformed (see Fig. 4(b) where, due to the applied weights, the thickness of the waveguide changes), and the waveguide propagation condition changes being the periodic structure different from the case of Fig. 4(a): in this case, the previous modes propagating at f 0, can be reflected at the input port.
Pressure-sensing principle and propagating modes. (a) The longitudinal section of the periodic waveguide. (b) The longitudinal section and geometrical deformation of the periodic device by applying loads.

V. MEASUREMENTS, RESULTS, AND DISCUSSION
In order to neglect the electrical interaction between the upper Mo layer and the weights, we use a material for electrical isolation as illustrated in Fig. 1(b). By using the experimental setup described in Section III, we first measure the frequency response of the chip in a frequency range between 1 and 36 GHz, and then we apply a pressure directly on the periodic structure by means of different weights: Fig. 5 shows the transmittivity (S12 response) for the chip without pressure, and the plots obtained by applying as weights P1 = 2.4 g and P2 = 19.09 g. From Fig. 5 we observe that the region with high-pressure sensitivity is defined between 1 and 11.5 GHz: the plots are convergent to the measurement without applied pressures except for particular regions or frequencies.
Scattering measured parameter S12. The measurements are performed by considering the sample without weights (sample plot), the sample with an applied weight of 2.4 g (P1 plot) and by a weight of 19.09 g (P2 plot). Inset: zoomed image around the new generated cutoff frequency.

The main variations between the values of the plots of Fig. 5 and the values of the 3D-FEM simulations are reported in Table 1. The transmittivity variations ΔS 12 of Table 1 are the differences in dB units between the transmittivity values of the device without weights and with the applied weights. The transmittivity values are chosen at the frequencies where the variation effect is strong.
Experimental and 3D FEM results: major plot variations for different frequencies.

Moreover, we observe from Fig. 6 that the plot without pressure is obtained before and after the experimentation (before to apply the loads and after the measurements without weights); this is due to the elasticity property of the whole chip. For this purpose, the presented chip is suitable for pressure-sensing applications.
Scattering measured parameter S12 before the applied weights (plot ref. [1]), and after the experimentation (plot ref. [2]): both the plots are obtained without the weights.

Figure 7 verifies the pressure sensing experimentally found at f 0 = 11.19 GHz by applying P2 as weight: the 3D FEM checks in this case the experimental results of Fig. 4 by showing the trasnmittivity as the electric field resonance at f 0. The modes associated with f 0 resonate according to the electric field distribution of Fig. 7(a) obtained without the application of loads; when the pressure P2 is applied the waveguide changes the core thickness as illustrated in Fig. 4(b) and stops the wave propagation at f 0 (cutoff frequency).
3D-FEM modeling: microwave MEMS sensor for a working frequency f 0 = 11.19 GHz by using the P2 weight. (a) Electric field configuration without applied pressure. (b) Electric field configuration by applying P2.

In order to analyze the frequency behavior of the introduced sensor layout with respect to the frequency response of the support, in Fig. 8 we compare the S 12 response with and without the sample. This comparison shows that the stray effects of the used support are low.
Scattering measured parameter S12 with and without the actual sensor introduced between the tapered waveguides of Fig. 2(a).

In order to reduce the error of the measurement, we have considered the average value of different S 12 measurements.
We estimate the error probability of the measurements of the proposed pressure sensor as error = (wrong measurements/total number of measurements)% and the sensor sensitivity as the possibility to detect correctly a weight: we observe from Fig. 9 that, over 50 g of applied weight (limit of the working range of the sensor), the experimental support described in Section III becomes unstable, and, consecutively, the error of the measurements increases, moreover, after 50 g, the thickness of the sensor changes slowly and consecutively the detection sensitivity decreases.
Error of the measurements and sensor sensitivity versus the applied weights.

The estimation of the error probability and of the sensitivity is performed by considering 50 total measurements for each applied weight (step of 1 gof weight). Finally, we observe that the sensitivity can change with the thicknesses of the Mo and AlN layers.
VI. FILTERING BEHAVIOR AT HIGH FREQUENCIES
In order to observe band gap properties, we design a chip with a central defect obtained by missing the central hole of the sensor of Fig. 1(a).
Using the experimental setup described above, we measure the frequency response of the chip in a frequency range between 20 and 50 GHz. Figure 10 shows the measured transmittivity (S12 response) of the chip: we observe from Fig. 9a band gap region (stopband region) defined around 40 GHz; the same bad gap behavior is proved by the FEM approach.
Transmittivity response of the chip of Fig. 1(a) with central defect obtained by missing the central hole. Inset: measured chip.

As in the previous cases, to reduce the error of the measurement, we consider the average value of five different measurements.
VII. CONCLUSION
In this work, we fabricate and measure a thin-film MEMS periodic filter for microwave/RF applications. The proposed device behaves as a pressure sensor and presents a high sensitivity also for low applied forces. The experimental results are validated by a 3D-FEM tool. The presented technology generates a cheap device and allows it to scale the layout easily to micro-dimensions. Finally, we study the band gap properties around 40 GHz for a chip with central defect. The pressure sensor characterization near the band gap region is under investigation.
ACKNOWLEDGEMENT
The authors gratefully acknowledge the help of the technician Diego Mangiullo.
 Alessandro Massaro received the Laurea degree in electronic engineering and Ph.D. degree in telecommunication engineering from the Università Politecnica delle Marche, Ancona, Italy, in 2001 and 2004, respectively. From 2004 to 2006, he worked as Research Scientist (post-doc) in the Department of Electromagnetism and Bioengineering at Università Politecnica delle Marche. In 2006, he spent 2 years in Research and Development at medical and industrial optics industry (endoscope design and optical systems). He worked for 2 years with National Nanotechnology Laboratory of CNR-INFM as principal investigator. He is currently team leader in Robotics Laboratory, one of the Center of Bio-Molecular Nanotechnology of Italian Institute Technology (IIT), Arnesano, Lecce, Italy. His research interests are in the design and modeling of photonic band gap circuits, in the development of computer-aided design (CAD) tools in the area of integrated optics, MEMS/NEMS technology and systems, and smart material modeling. Actually he is a member of the European Microwave Association (EuMA).
 Giuseppe Venanzoni received the Laurea degree in electronics and Ph.D. degree in telecommunication from the University of Ancona, Ancona, Italy, in 2001 and 2004, respectively. Currently, he is an Assistant Professor of electromagnetism–microwaves with the Università Politecnica delle Marche, Ancona, Italy. His research interests include design of waveguide passive devices, microwave filters, and antennas.
 Marco Farina received the Laurea degree in electronics and Ph.D. degree in electromagnetism from the University of Ancona, Ancona, Italy, in 1990 and 1995, respectively. Since 1992, he has been with the Dipartimento di Ingegneria Biomedica Elettronica e Telecomunicazioni, Università Politecnica delle Marche, Ancona, Italy, where he is currently an Associate Professor. He is also a consulting engineer in electronics. He coauthored Advanced Electromagnetic Analysis of Passive and Active Planar Structures (IEE Press 1999). He developed the full-wave software package for 3D structures EM3DS.
 Antonio Morini received the Laurea degree in electronics and Ph.D. degree in electromagnetism from the University of Ancona, Ancona, Italy, in 1987 and 1992, respectively. He is currently an Associate Professor of applied electromagnetism with the Università Politecnica delle Marche, Ancona, Italy. His research activity is mainly devoted to the modeling and design of passive microwave components such as filters and antennas.
 Tullio Rozzi received the Dottore degree in physics from the University of Pisa, Pisa, Italy, in 1965; the Ph.D. degree in electronic engineering from The University of Leeds, Leeds, UK, in 1968; and the D.Sc. degree from the University of Bath, Bath, UK, in 1987. From 1968 to 1978, he was a Research Scientist with Philips Research Laboratories, Eindhoven, The Netherlands. In 1975, he spent 1 year with the Antenna Laboratory, University of Illinois at Urbana-Champaign. In 1978, he became Chair of Electrical Engineering with the University of Liverpool. In 1981, he became Chair of Electronics and Head of the Electronics Group, University of Bath, where he was also held the Head of the School of Electrical Engineering. Since 1988, he has been a Professor with the Dipartimento di Ingegneria Biomedica, Elettronica e Telecominucazioni, Università Politecnica delle Marche, Ancona, Italy, where he is Head of the department. Dr. Rozzi is a member of the Italian National Institute for the Physics of Matter (INFM). He was the recipient of the 1975 IEEE Microwave Theory and Technique Society (IEEE MTT-S) Microwave Prize.
 Roberto Cingolani was born in Milan (Italy) in December 1961. He got a Ph.D. in physics at Scuola Normale Superiore di Pisa (Italy) and he was staff member of Max Planck Institute FKF-Stuttgart from 1989 to 1991. He had been visiting scientists at Tokyo University in 1997, and appointed full Professor of experimental physics at University of Salento since 2000. He is the Scientific Director of the Italian Institute of Technology since 2004. He is author and coauthor of more than 500 papers in international journals and he holds 20 patents. His research activity includes nanotechnology and nanofabrication, semiconductor physics and devices, molecular organic nanostructures and devices, and bio-nanotechnologies.
 Adriana Passaseo is Researcher and Coordinator of the Inorganic Material Division, National Nanotechnology Laboratory from 2001. Her main research activities are on growth and characterization of III/V heterostructures, quantum nanostructures and III-Nitride heterostructures, and related material and devices. She is author or coauthor of more than 160 international publications.
 Massimo De Vittorio was born in Gallipoli (LE), Italy, in May 1967. He graduated in electronic engineering from the University of Pavia, Pavia, Italy, in 1992, and received the Master's degree in electronic engineering on semiconductor technology from the University of Lecce, Lecce, Italy, in 1995. From 1996 to 2001, he was an Istituto Nazionale per la Fisica Della Materia (INFM) Senior Scientist Staff Member at the University of Lecce, where he was an Assistant Professor at the Engineering Faculty from 2001 to 2006. During 1999, he was a Visiting Scientist at the Center for Quantum Devices, NorthWestern University. In 2000, he was an Invited Scientist at the Advanced Telecommunications Research Institute International, Adaptive Communications Research Laboratories, Japan. He is currently with the Nanodevice Division, National Nanotechnology Laboratory of the Consiglio Nazionale delle Ricerche, INFM, Disttretto Tecnologico Istituto Superiore di Formazione Interdisciplinare, Università del Salento, Lecce, Italy, where he has been an Associate Professor since 2006, and is currently a Lecturer of electronic and photonic devices, and nanotechnologies applied to electronic devices. His research interests include the design and fabrication of photonic and electronic devices based on either electronic or photonic low-dimensional structures.



