Introduction
Head and neck cancer is the sixth most prevalent cancer worldwide.Reference Parkin, Bray, Ferlay and Pisani1 Research suggests that patients with head and neck cancer suffer more frequently from anxiety and depressive disorders than do other cancer patients.Reference Katz, Kopek, Waldron, Devins and Tomlinson2–Reference Singer, Krauss, Keszte, Siegl, Papsdorf and Severi4 This probably reflects the complexity of patients' conditions. The disfigurement commonly associated with treatment not only affects patients' body image but also has a large impact on their vital physical functions such as eating, breathing and speaking. Understandably, these challenges are associated with significant social and psychological sequelae. The reported incidence of clinically significant anxiety and depression in head and neck cancer patients ranges from 20 to 46 per cent, measured up to six years post-treatment.Reference Katz, Kopek, Waldron, Devins and Tomlinson2, Reference Kugaya, Akechi, Okuyama, Nakano, Mikami and Okamura3, Reference de Leeuw, de Graeff, Ros, Blijham, Hordijk and Winnubst5–Reference Singer, Kuhnt, Gotze, Hauss, Hinz and Liebmann8
Unfortunately, psychological problems often go unrecognised by oncological care professionals.Reference Carlson, Angen, Cullum, Goodey, Koopmans and Lamont9, Reference Sollner, DeVries, Steixner, Lukas, Sprinzl and Rumpold10 This is clinically relevant, as lack of detection and treatment of such problems is associated with reduced quality of life, non-compliance with prescribed therapy, increased complications and prolonged hospital stay.Reference de Leeuw, de Graeff, Ros, Blijham, Hordijk and Winnubst5, Reference DiMatteo, Lepper and Croghan11, Reference Jenkins, Carmody and Rush12 Indeed, one recent study found that quality of life was an independent predictor of survival in patients with advanced head and neck cancer.Reference Oskam, Verdonck-de Leeuw, Aaronson, Kuik, de Bree and Doornaert13 Cancer-related psychological problems and their clinical consequences may be avoidable, as there are effective pharmacological and psychotherapeutic interventions available; indeed, several studies have reported positive outcomes with sufficient post-treatment support.Reference Allison, Nicolau, Edgar, Archer, Black and Hier14–Reference Sheard and Maguire18 Therefore, the implementation of efficient screening techniques may be valuable in enabling adequate identification and referral of individuals requiring psychosocial input.
The Hospital Anxiety and Depression Scale is a simple self-evaluation tool which has been developed and used in primary care and hospital settings for over 25 years.Reference Zigmond and Snaith19 It consists of 14 questions each scored from 0 to 3, grouped into two subscales: anxiety and depression. Increasing scores represent an increasing symptom burden. This questionnaire has been extensively validated and found to be a worthwhile and practical screening method for identifying psychological morbidity.Reference Rampling, King, Mais, Humphris, Swindell and Sykes20, Reference Bjelland, Dahl, Haug and Neckelmann21 Various cut-off scores have been applied to distinguish patients with probable psychiatric illness. However, there is currently no conclusive agreement as to the optimal cut-off score to be used in cancer patients.
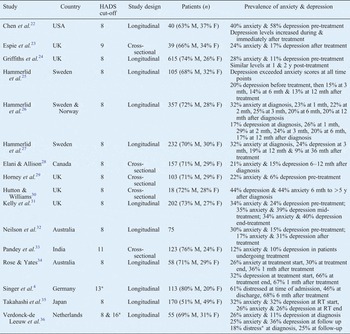
Several studies have used the Hospital Anxiety and Depression Scale to examine psychological distress in head and neck cancer patients. However, very few studies have investigated such distress over time, particularly in a UK population. Table I summarises previous studies that have assessed psychological morbidity in head and neck cancer patients around the world, and their outcomes.Reference Singer, Krauss, Keszte, Siegl, Papsdorf and Severi4, Reference Chen, Jennelle, Grady, Tovar, Bowen and Simonin22–Reference Verdonck-de Leeuw, Eerenstein, Van der Linden, Kuik, de Bree and Leemans36
Previous studies of psychological morbidity in head & neck cancer patients, using hads

*Hospital Anxiety and Depression Scale (HADS) total score. M = male; F = female; y = years; mth = months; RT = radiotherapy
The purpose of the current study was threefold.
Firstly, we aimed to perform a longitudinal analysis of psychological morbidity in head and neck cancer patients, using the Hospital Anxiety and Depression Scale, in order to identify trends in mean psychological symptom burden before and up to three years after radical treatment.
Secondly, we aimed to analyse the relationship between patients' Hospital Anxiety and Depression Scale score and their tissue toxicity rating as per the Late Effects on Normal Tissue (Subjective, Objective, Management and Analytic) (‘LENT-SOMA’) questionnaire (described in a previous paper), as well as the association with age, gender, stage and treatment type.Reference Ho, Farnell, Routledge, Burns, Sykes and Slevin37
Finally, we aimed to assess whether early symptoms of anxiety and depression were predictive of subsequent emotional distress. This information may enable the identification of specific time points and individuals at greatest risk of psychological morbidity, thus guiding the provision of targeted support.
Our overall aim was to demonstrate the value of the Hospital Anxiety and Depression Scale in routine clinical practice.
Methods and materials
Study design and sample
This was a prospective, observational study conducted between 1998 and 2003 at The Christie NHS Foundation Trust, Manchester, UK.
Approval for the study was obtained from the South Manchester Research Ethics Committee.
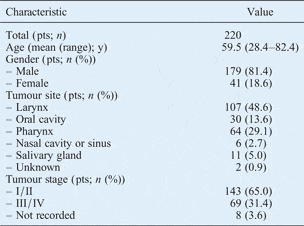
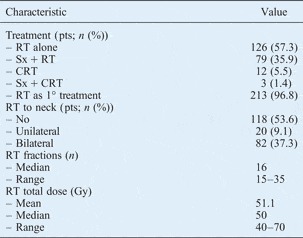
All eligible patients undergoing radical radiotherapy for head and neck cancer were approached. A total of 220 patients agreed to participate in the study. Information on patient demographics and cancer details was obtained from reviewing patients' medical records, and is shown in Tables II and III.
Patient characteristics

Y = years
Treatment characteristics

Pts = patients; RT = radiotherapy; Sx = surgery; CRT = chemoradiotherapy; 1° = primary
Questionnaire scales
The Hospital Anxiety and Depression Scale was used to assess psychological distress in the head and neck cancer patients studied. This scale is designed so that somatic questions are avoided. Item scores are summed so the possible scores range from 0 to 21 for each subscale. The Hospital Anxiety and Depression Scale total score has been shown to be a valuable screening method. In the current study, various cut-off scores were applied to each subscale to identify patients with possible psychiatric illness. Any incomplete questionnaires were excluded.
The Late Effects on Normal Tissue (Subjective, Objective, Management and Analytic) questionnaire is a comprehensive, validated, self-reported questionnaire used to assess the late effects of cancer treatment, and has recently been incorporated as part of the Common Terminology Criteria for Adverse Effects grading scale.38, Reference Davidson, Trotti, Ataman, Seong, Lau and da Motta39 The Late Effects questionnaire contains subjective item scales subdivided into seven categories representing the areas irradiated: oral and pharyngeal, skin, salivary gland, mandible, teeth, larynx, and ear. Separate questions address pain intensity and frequency. If a patient returned a questionnaire missing more than half the responses for any category, or for the entire questionnaire, then all the questionnaire scores were declared to be missing for that patient. The Late Effects questionnaire has been more fully described in a previous publication.Reference Ho, Farnell, Routledge, Burns, Sykes and Slevin40
Both questionnaires were administered on nine occasions: before and on completion of treatment, and then at 6 weeks and 6, 12, 18, 24, 30 and 36 months post-treatment. Questionnaires were initially completed (1) by the patients themselves pre-treatment, with a research nurse present to answer any queries, and (2) in face-to-face interviews conducted by two of the authors (JAR and MPB) on completion of treatment, when attending out-patient clinic follow up. In order to improve compliance, those patients who lived further away from the cancer centre were posted subsequent questionnaires for self-completion. Patients who lived closer self-completed their subsequent questionnaires during scheduled out-patient follow-up visits.
A patient satisfaction survey was administered concurrently, which enquired about questionnaire completion time as well as the perceived clarity of the questionnaire structure and content.
Statistical analysis
Data were analysed using SPSS version 16 software. As data were not normally distributed, non-parametric statistical analysis was used. Friedman's two-way analysis of variance could not be utilised to assess whether participants' scores changed significantly over time, as the sample size was small at 36 months post-treatment. Instead, the Wilcoxon matched pairs signed rank test was used and a Bonferroni correction applied. Therefore, all changes in scores over time were reported at a reduced level of 0.01 significance. The relationship between the Hospital Anxiety and Depression Scale score and age or Late Effects on Normal Tissue (Subjective, Objective, Management and Analytic) questionnaire overall score was evaluated using Spearman's rank correlation. The relationship between Hospital Anxiety and Depression Scale score and gender, stage or treatment type (i.e. radiotherapy and/or chemotherapy and surgery) was assessed using the Kruskal–Wallis or Mann–Whitney U tests where appropriate.
Results and analysis
A total of 1206 Hospital Anxiety and Depression Scale questionnaires and 1206 Late Effects on Normal Tissue (Subjective, Objective, Management and Analytic) questionnaires were completed for the 220 patients. Patients completing the Hospital Anxiety and Depression Scale questionnaire were also asked to complete the Late Effects on Normal Tissue (Subjective, Objective, Management and Analytic) questionnaire in the same sitting.
A total of 64 patients (29.1 per cent) completed both questionnaires at all specified time points during the 3-year study.
Forty-three patients (19.5 per cent) were excluded from further analysis as they developed cancer recurrence, while another 20 (9.1 per cent) patients were excluded as they died during the study. A further 39 patients (17.8 per cent) did not complete questionnaires for all time points, either because their out-patient follow up was conducted elsewhere, or because they failed to notify a change of address. Forty-six patients (21 per cent) elected not to continue, or simply ceased to return completed study questionnaires. Eight patients (3.6 per cent) had incomplete or missing data.
A total of 1073 valid questionnaires was returned during the study: 605 from face-to-face interviews and 468 via post following self-completion.Reference Ho, Farnell, Routledge, Burns, Sykes and Slevin40
Longitudinal results
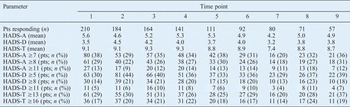
Table IV shows patients' mean Hospital Anxiety and Depression Scale scores over time, and also shows patients' prevalence of anxiety and depressive symptoms using various cut-off scores previously reported in the literature. When we used the lowest subscale cut-off scores (i.e. 7 for the anxiety subscale and 5 for the depression subscale), the proportion of patients indicated to be suffering from anxiety and depression at any single time point over the 3-year study period was high: 38 and 44 per cent, respectively. When we used a total Hospital Anxiety and Depression Scale score of 13 or more, up to 37 per cent of patients were indicated to be suffering probable psychological distress at any particular time point. Comparing the different time points, the proportion of patients with an anxiety subscale score which exceeded any of the previously published clinical cut-off points was greatest pre-treatment, while the proportion of patients with a depression subscale score exceeding any previously published clinical cut-off point was greatest at the end of treatment. Analysing patients individually, a total of 126 patients (58 per cent) had an anxiety subscale score of 7 or more at some stage during follow up, while 137 (63 per cent) had a depression subscale score of 5 or more and 116 (53 per cent) had a total score of 13 or more.
Hads results by time point

Time points: 1 = pre-treatment; 2 = completion of treatment; 3 = 6 weeks; 4 = 6 months; 5 = 1 year; 6 = 18 months; 7 = 2 years; 8 = 30 months; 9 = 3 years. HADS-A = Hospital Anxiety and Depression Scale (HADS) anxiety subscale score, HADS-D = HADS depression subscale score, HADS-T = HADS total score
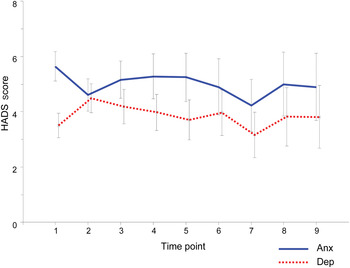
Figure 1 shows the mean Hospital Anxiety and Depression Scale anxiety and depression subscale scores over the study period. Mean anxiety scores exceeded mean depression scores at all time points. The mean anxiety scores were highest before treatment and the mean depression scores were highest on completion of treatment. There was a statistically significant decrease in the mean anxiety subscale score, comparing pre-treatment to completion of treatment (i.e. from 5.64 to 4.61, p < 0.001). Conversely, there was a significant increase in the mean depression subscale score, comparing pre-treatment to completion of treatment (from 3.5 to 4.49, p < 0.001). Apart from the changes between these two time points, there were no significant changes in mean anxiety and depression scores over time. There was no significant change in mean total scores over time.
Hospital Anxiety and Depression Scale scores for anxiety (Anx) and depression (Dep) subscales, by time point. Plot lines indicate mean scores, whiskers indicate ± 2 standard deviations. Time points: 1 = pre-treatment; 2 = completion of treatment; 3 = 6 weeks; 4 = 6 months; 5 = 1 year; 6 = 18 months; 7 = 2 years; 8 = 30 months; 9 = 3 years.

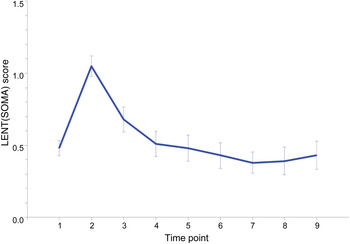
Figure 2 shows mean overall scores for the Late Effects on Normal Tissue (Subjective, Objective, Management and Analytic) questionnaire over the study period. Symptoms of tissue toxicity were greatest on completion of treatment. There was a significant correlation (p < 0.001) between changes in anxiety and depression subscale scores and Late Effects questionnaire scores. Specifically, higher depression subscale scores were associated with higher Late Effects questionnaire scores.
Late Effects on Normal Tissue (Subjective, Objective, Management and Analytic) questionnaire (LENT(SOMA)) scores by time point. Plot lines indicate mean scores, whiskers indicate ± 2 standard errors. Time points: 1 = pre-treatment; 2 = completion of treatment; 3 = 6 weeks; 4 = 6 months; 5 = 1 year; 6 = 18 months; 7 = 2 years; 8 = 30 months; 9 = 3 years.

There was a significant correlation between age and total Hospital Anxiety and Depression Scale score both before and on completion of treatment (p values of 0.002 and 0.004, respectively). Specifically, younger patients were more likely to have higher anxiety scores before and during treatment. Following treatment, there was no statistically significant difference between age and Hospital Anxiety and Depression Scale score. Although women had a higher mean total Hospital Anxiety and Depression Scale score overall, there was no statistically significant difference in scores between men and women at any individual time point. There was a significantly higher pre-treatment depression score in patients with stage IV disease, compared with other patients (p < 0.001). However, there were no statistically significant differences in anxiety, depression or total scores between patients at different stages, at any other time point.
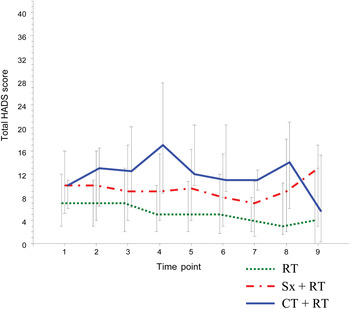
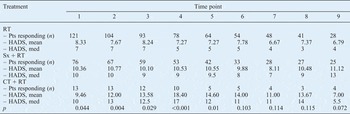
Table V shows total Hospital Anxiety and Depression Scale scores for patients receiving different treatment: either radiotherapy alone, radiotherapy plus chemotherapy or radiotherapy with prior surgery. Patients who received additional treatment had a higher mean total Hospital Anxiety and Depression Scale score than those who received radiotherapy alone. Specifically, those patients who received additional chemotherapy had a significantly worse total score up to one year following radical therapy, particularly at six months post-treatment (p < 0.001). Figure 3 presents the same data in a graph. The anxiety and depression subscale scores for each treatment type generally paralleled the total score at each time point. However, patients who received surgery prior to radiotherapy had significantly higher pre-treatment depression scores (p = 0.002).
Hospital Anxiety and Depression Scale total scores for each treatment type, by time point. Plot lines indicate medians, whiskers indicate inter-quartile range. Time points: 1 = pre-treatment; 2 = completion of treatment; 3 = 6 weeks; 4 = 6 months; 5 = 1 year; 6 = 18 months; 7 = 2 years; 8 = 30 months; 9 = 3 years. RT = radiotherapy; Sx = surgery; CT = chemotherapy.

Hads scores by time point and treatment type

Time points: 1 = pre-treatment; 2 = completion of treatment; 3 = 6 weeks; 4 = 6 months; 5 = 1 year; 6 = 18 months; 7 = 2 years; 8 = 30 months; 9 = 3 years. RT = radiotherapy; Pts = patients; HADS = Hospital Anxiety and Depression Scale score; med = median; Sx + RT = surgery prior to RT; CT = chemotherapy
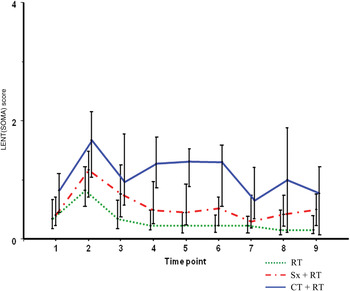
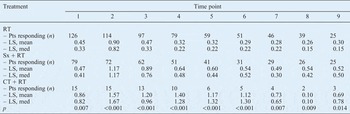
Similarly, Table VI and Figure 4 show the overall Late Effects on Normal Tissue (Subjective, Objective, Management and Analytic) questionnaire scores for patients receiving different treatments. There was a highly significant difference in toxicity scoring between patients receiving radiotherapy alone versus those also receiving additional treatment, at all time points. Patients receiving radiotherapy plus additional chemotherapy had the highest mean toxicity score.
Late Effects on Normal Tissue (Subjective, Objective, Management and Analytic) questionnaire (LENT(SOMA)) score for each treatment type, by time point. Plot lines indicate medians, whiskers indicate inter-quartile range. Time points: 1 = pre-treatment; 2 = completion of treatment; 3 = 6 weeks; 4 = 6 months; 5 = 1 year; 6 = 18 months; 7 = 2 years; 8 = 30 months; 9 = 3 years. RT = radiotherapy; Sx = surgery; CT = chemotherapy.

Lent(SOMA) scores by time point and treatment type

Time points: 1 = pre-treatment; 2 = completion of treatment; 3 = 6 weeks; 4 = 6 months; 5 = 1 year; 6 = 18 months; 7 = 2 years; 8 = 30 months; 9 = 3 years. LENT(SOMA) = Late Effects on Normal Tissue (Subjective, Objective, Management and Analytic) questionnaire; RT = radiotherapy; Pts = patients; LS = LENT(SOMA) score; med = median; Sx + RT = surgery prior to RT; CT = chemotherapy
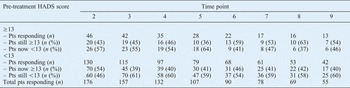
We examined the proportions of patients whose total Hospital Anxiety and Depression Scale score improved, deteriorated or remained the same, compared with their pre-treatment score (Table VII). Of those patients with an elevated score pre-treatment, we found a score of 13 or more in 43 per cent on completion of treatment, in 36 per cent at 1 year post-treatment and in 54 per cent at 3 years post-treatment. Of those patients who scored less than 13 at diagnosis, we found unchanged scores in 46 per cent on completion of treatment, in 41 per cent at 1 year post-treatment and in 60 per cent at 3 years post-treatment (Table VII).
Patients scoring above and below hads score 13, by time point and initial score

Time points: 2 = completion of treatment; 3 = 6 weeks; 4 = 6 months; 5 = 1 year; 6 = 18 months; 7 = 2 years; 8 = 30 months; 9 = 3 years. HADS = Hospital Anxiety and Depression Scale; Pts = patients
Discussion
There are only a small number of longitudinal studies that have investigated psychological distress in a UK population of head and neck cancer patients. We decided to use the Hospital Anxiety and Depression Scale questionnaire as it has long been established as an effective screening tool for psychological morbidity, and is simple to use for both patients and clinicians. However, despite its many years of use, there is still dispute over the optimal cut-off score used to identify patients with probable psychiatric illness. Initially, cut-off scores of 8 for suspicious cases and 11 for safe cases were proposed (i.e. scores of 8 or more and 11 or more were considered to indicate probable psychiatric problems in suspicious and safe cases, respectively).Reference Zigmond and Snaith19, Reference Bjelland, Dahl, Haug and Neckelmann21 However, later studies argued that lower thresholds were required specifically for cancer patients.Reference Singer, Kuhnt, Gotze, Hauss, Hinz and Liebmann8, Reference Morse, Kendell and Barton41 Recently, Singer et al. demonstrated that a cut-off score of 7 for anxiety and 5 for depression offered the best balance between sensitivity and specificity for detecting cancer patients with a true psychiatric disorder.Reference Singer, Kuhnt, Gotze, Hauss, Hinz and Liebmann8 More appealing was the suggestion that oncologists use the total Hospital Anxiety and Depression Scale score, in order to simplify routine clinical use of the questionnaire; in this case, a cut-off (total) score of 13 was found to be optimal.
Although we applied various cut-off thresholds when analysing our results, we agree that the lower limits recommended by Singer et al. are more appropriate for use in an oncological setting.Reference Singer, Kuhnt, Gotze, Hauss, Hinz and Liebmann8 From a clinical standpoint, we believe it is preferable to overestimate, and potentially refer more ‘unnecessary’ cases, than to overlook a patient suffering from a mood disorder that is quite treatable. Bearing this in mind, our results indicate that the prevalence of anxiety and depressive symptoms may be as high as 38 and 44 per cent, respectively, up to three years post-treatment. A total Hospital Anxiety and Depression Scale score of 13 or more is thought to indicate a significant likelihood of mood disorder; accordingly, up to 37 per cent of our patients may qualify for this description at any given time.
Consistent with similar research, our results indicate that symptoms of anxiety are heightened before the initiation of cancer therapy, but decrease as treatment progresses and ends.Reference Chen, Jennelle, Grady, Tovar, Bowen and Simonin22, Reference Hammerlid, Ahlner-Elmqvist, Bjordal, Biorklund, Evensen and Boysen26, Reference Neilson, Pollard, Boonzaier, Corry, Castle and Mead32 Conversely, we noted a significant, progressive increase in depressive symptoms from diagnosis to immediately after treatment. This is understandable, as the side effects of cancer treatment and resultant levels of fatigue are maximal towards the end of treatment; this explains the highly significant correlation between scores for the depression subscale of the Hospital Anxiety and Depression Scale and overall scores for the Late Effects on Normal Tissue (Subjective, Objective, Management and Analytic) questionnaire. Head and neck cancer patients are now more likely to undergo two or three different treatment modalities, with subsequent increased toxicity compared with previous treatments; thus, scores for the depression subscale of the Hospital Anxiety and Depression Scale may now be higher. Also in keeping with previous literature, we found that younger patients had considerably higher anxiety scores before and during treatment, but had no great difference at later measurement points.Reference Chen, Jennelle, Grady, Tovar, Bowen and Simonin22, Reference Hammerlid, Ahlner-Elmqvist, Bjordal, Biorklund, Evensen and Boysen26, Reference Horney, Smith, McGurk, Weinman, Herold and Altman29 However, in contrast with earlier studies we found no significant variation in Hospital Anxiety and Depression Scale scores between genders or between patients with differing cancer stages.Reference de Leeuw, de Graeff, Ros, Blijham, Hordijk and Winnubst5, Reference Hammerlid, Ahlner-Elmqvist, Bjordal, Biorklund, Evensen and Boysen26, Reference Pandey, Devi, Thomas, Kumar, Krishnan and Ramdas33
Few studies have analysed the relationship between Hospital Anxiety and Depression Scale score and treatment type in head and neck cancer patients. Our results show that patients who undergo prior surgery have higher pre-treatment depression levels. This comes as no surprise: in addition to recovering from radical, potentially disfiguring surgery, patients have to prepare themselves for more intensive therapy. Our findings also indicate that patients receiving additional chemotherapy are markedly more distressed than other patients up to a year after treatment is completed. The significantly higher tissue toxicity experienced by these patients almost certainly contributes to their increased psychological morbidity. It is important to note that only a small proportion of patients (7 per cent) received chemotherapy at the time of this study. However, the majority of patients are now given concurrent chemotherapy, suggesting that even more may be at risk of psychological distress.
Our final objective was to investigate whether patients with high Hospital Anxiety and Depression Scale scores before treatment were likely to continue to have high scores after treatment. Unlike other studies, our results indicate that an elevated score early on is not predictive of a high score at later time points.Reference de Leeuw, de Graeff, Ros, Blijham, Hordijk and Winnubst5, Reference Chen, Jennelle, Grady, Tovar, Bowen and Simonin22, Reference Neilson, Pollard, Boonzaier, Corry, Castle and Mead32 Only 43 per cent of patients with a total Hospital Anxiety and Depression Scale score of 13 or more pre-treatment remained at this level on completion of treatment. In fact, there were 70 new cases of probable psychological distress at the end of treatment (54 per cent of the patients who had scored less than 13 before treatment). A total of 36, 53 and 54 per cent of patients continued to have elevated scores at one, two and three years post-treatment, respectively, compared with baseline measurements. This large variability in symptom burden suggests that ongoing surveillance throughout treatment and follow up is crucial in order to detect distressed patients.
The limitations of this study should be mentioned. Firstly, there was a progressive decline in the number of patients completing questionnaires at each measurement time point, which may possibly have resulted in a selection bias. It is conceivable that patients exhibiting symptoms of clinical depression would be less motivated to complete questionnaires; therefore, our results may underestimate the true rates of psychological distress within our sample. Also, we did not record socioeconomic differences, smoking or alcohol consumption, or pre-morbid mental state as part of this study, so it was hard to distinguish whether the cancer alone was responsible for patients' psychological symptoms. Nevertheless, these factors may not be relevant as the main focus of this study was to explore changes in psychological symptoms over time. Besides, we should aim to recognise and offer support to all patients suffering from emotional distress, whatever the cause. Finally, it should be highlighted that the Hospital Anxiety and Depression Scale questionnaire has only been developed as a screening tool, and that a high score therefore does not constitute a psychiatric diagnosis. In addition, with any self-reported questionnaire there is the potential to exaggerate or minimise symptoms, hence the difficulty in finding the optimal cut-off score.
Despite these limitations, we believe our research greatly supports the use of the Hospital Anxiety and Depression Scale in routine clinical practice. Indeed, this is already regularly the case in some parts of Canada, and seems to be working well.Reference Sellick and Edwardson42 There is growing evidence that mental health services are under-used in cancer patient management. One study reported that, although 36 per cent of 1109 patients had significant depression, oncologists often inaccurately assessed the level of patients' depressive symptoms, and less than 3 per cent received mental health input.Reference Passik, Dugan, McDonald, Rosenfeld, Theobald and Edgerton43 Therefore, it is our duty as health professionals to make services more available to patients, and to encourage them to seek psychosocial help if necessary. Patients often feel better just knowing that support is available, even if they do not wish to accept it.Reference Singer, Kuhnt, Gotze, Hauss, Hinz and Liebmann8 Furthermore, filling out a questionnaire can help make patients more aware of their thoughts and emotions, enabling them to recognise feelings of anxiety and depression and to request help for themselves.
• Head and neck cancer patients suffer more anxiety and depression than other cancer patients
• This study assessed psychological morbidity in this group, using the Hospital Anxiety and Depression Scale and the Late Effects on Normal Tissue (Subjective, Objective, Management and Analytic) questionnaire
• Hospital Anxiety and Depression Scale scores correlated significantly with tissue toxicity, age and chemotherapy
• Patients would benefit most from psychological input immediately before and immediately after treatment
• New cases of psychological distress emerged throughout follow up, justifying repeated questionnaire administration
The Hospital Anxiety and Depression Scale is a simple, cheap, and quick screening tool that has the potential to improve the outcome of those patients undergoing cancer therapy who are also experiencing psychiatric illness. Importantly, our results suggest that this questionnaire should be used several times during the course of treatment and follow up, in order to have the greatest effect: 58 per cent of our patients had a Hospital Anxiety and Depression Scale total score of 13 or more at some stage of their treatment and follow up. We found it convenient to use the Hospital Anxiety and Depression Scale total score, and we propose that all patients with a total score of 13 or more should be referred to the psycho-oncologists. In our study, the largest difference in psychiatric symptoms was observed between the start and end of treatment; thus, there is ample opportunity to identify and refer patients suffering from anxiety and depressive symptoms, as they are seen on a regular basis during their chemoradiotherapy.
We also believe it is beneficial to simultaneously administer the Late Effects on Normal Tissue (Subjective, Objective, Management and Analytic) questionnaire, alongside the Hospital Anxiety and Depression Scale. The many advantages of the Late Effects questionnaire have been described in a previous paper.Reference Ho, Farnell, Routledge, Burns, Sykes and Slevin37 Based on our study findings, we believe that this questionnaire can help predict those patients likely to require psychosocial input due to more severe tissue toxicity.
Our research also highlights other patient groups (i.e. younger patients and those receiving additional chemotherapy) which clinicians may need to manage with extra vigilance.
Increasing numbers of studies are showing the benefit of psychosocial interventions in improving the outcome of cancer patients.Reference de Leeuw, de Graeff, Ros, Blijham, Hordijk and Winnubst5, Reference Allison, Nicolau, Edgar, Archer, Black and Hier14–Reference Sheard and Maguire18 The next step is to evaluate the best form of support to offer, to meet the changing needs of head and neck cancer patients.
Conclusion
Head and neck cancer patients suffer more anxiety and depression than other patients with cancer, with a reported prevalence of 20–46 per cent up to six years after treatment. The Hospital Anxiety and Depression Scale is a simple, validated self-evaluation tool which has been found to be effective in screening for psychological morbidity in cancer patients.
The Late Effects on Normal Tissue (Subjective, Objective, Management and Analytic) questionnaire is a comprehensive, validated, self-reported questionnaire used to assess the late effects of treatment, including tissue toxicity (it is now part of the Common Terminology Criteria for Adverse Effects scoring system).
In this study of UK head and neck cancer patients, Hospital Anxiety and Depression Scale scores correlated significantly with patient age, tissue toxicity and chemotherapy.
We believe that patients would benefit from psychological input immediately before and immediately after treatment. In our study, early symptoms of psychological distress were not predictive of emotional distress later on. In addition, new cases of psychological distress were observed at each measurement point. These findings support the repeated use of both the Hospital Anxiety and Depression Scale and the Late Effects on Normal Tissue (Subjective, Objective, Management and Analytic) questionnaire at multiple time points during treatment and follow up.