To analyze risk factors of nosocomial infections and the impact of nosocomial infection on mortality in cohort studies, the logistic regression model is the dominant approach.Reference Pierce, Lessler and Milstone 1 Recently, Pierce et alReference Pierce, Lessler and Milstone 1 provided an excellent overview of statistical models (eg, Poisson and survival models), which extend the logistic regression model by accounting for time-at-risk, time-dependency of nosocomial infection, other risk factors, and competing events. As noted by Pierce et al,Reference Pierce, Lessler and Milstone 1 different models often simply address different questions. However, for readers of published results, it is often not transparent which approaches lead to bias (and should therefore be avoided) and how the results from different models are linked.
Biased results seem to be common in articles about nosocomial infection. For instance, ignoring the time dependency of nosocomial infection in length-of-stay analyses can lead to a serious overestimation of the additional length of stay due to nosocomial infection.Reference Schumacher, Allignol, Beyersmann, Binder and Wolkewitz 2 , Reference Nelson, Nelson and Khader 3 Competing events are another serious source of bias.Reference Wolkewitz, Cooper, Bonten, Barnett and Schumacher 4 When calculating the risk of nosocomial infection depending on the time at risk, ignoring discharge and death as competing events leads to an overestimation of cumulative nosocomial infection risk.Reference Schumacher, Allignol, Beyersmann, Binder and Wolkewitz 2 , Reference Wolkewitz, Cooper, Bonten, Barnett and Schumacher 4
Multistate models have become an attractive tool to accommodate the time dependency of nosocomial infection and death or discharge as competing events. Indeed, multistate models are well suited to avoiding time-dependent and competing-risks biases, and they further provide deep time-dependent insights into the determinants and consequences of nosocomial infection (see recent examples in Ong et al,Reference Ong, Bonten and Safdari 5 Ong et al,Reference Ong, Spitoni and Klein Klouwenberg 6 van Vught et al,Reference van Vught and Klein Klouwenberg 7 De Angelis et al,Reference De Angelis, Allignol and Murthy 8 and Stewardson et alReference Stewardson, Fankhauser and De Angelis 9 ).
In this article, we aim to make the basic mechanisms of competing risks and multistate models transparent to professionals who draw conclusions from published studies of nosocomial infection. We make use of simplified assumptions (ie, time-constant hazard rates) to illustrate the basic ideas behind multistate models. With time-constant hazard rates, a first-step analysis of the multistate model for nosocomial infection can be performed easily; this is a useful tool for avoiding competing-risks bias and time-dependent bias. The corresponding mathematical proofs and the contrast with multistate models using time-dependent hazards are provided in a statistical companion paper.
METHODS
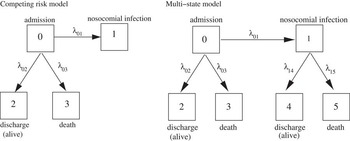
The multistate model is displayed in Figure 2. Each arrow represents a time-homogeneous hazard rate λ ij from state i to j. The hazards λ ij are interpreted as the daily risk of moving from state i to state j and are estimated by
 $${\hat{\lambda }_{{ij}}\, {\equals}\, {{{\rm Number}\,{\rm of}\,{\rm patients}\,{\rm moving}\,{\rm from}\,{\rm state}\,i\,{\rm to}\,j} \over {{\rm Summed}\,{\rm patient{\minus}days}\,{\rm in}\,{\rm state}\,{\rm i}}}$$
Only the following 7 simple numbers are needed to estimate the hazards of the multistate model: (1) the number of patients who acquire nosocomial infection, (2) the number of patients who are discharged without nosocomial infection, (3) the number of patients who are discharged with nosocomial infection, (4) the number of patients who die without nosocomial infection, (5) the number of patients who die with nosocomial infection, (6) the total patient days without nosocomial infection, and (7) the total patient days with nosocomial infection.
Based on the 5 hazards from the multistate model, it is now possible to quantify cumulative risk and clinical outcomes of nosocomial infection in terms of mortality and length of stay.
RESULTS
Displaying Raw Nosocomial Infection Data
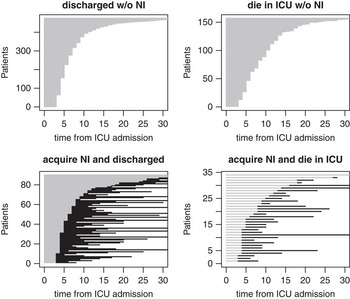
Figure 1 shows the data of a German cohort study with 756 intensive care unit (ICU) patients; it is a random sample of a larger studyReference Wolkewitz, Vonberg and Grundmann 10 and is publicly available.Reference Allignol, Schumacher and Beyersmann 11 All patients enter the ICU, and as long as they stay alive in the ICU without a nosocomial infection (which is pneumonia in this example), they are at risk to acquire a nosocomial infection, to die, or to be discharged alive uninfected (marked as a gray line). Notably, due to the definition of nosocomial infection, discharge without nosocomial infection constitutes the end of the at-risk period for nosocomial infection. This at-risk condition for the 3 competing events corresponds to state 0 from the multistate model (Figure 2). After some time at risk, each patient will either acquire a nosocomial infection (n=124, lower panels of Figure 1), be discharged without nosocomial infection (n=475, left upper panel of Figure 1), or die without nosocomial infection (n=157, right upper panel of Figure 1), meaning that he or she moves to state 1, 2, or 3, respectively. The gray patient days from all 4 panels in Figure 1 contribute to the state 0; the total of all patient days in state 0 is 6,442 patient days. Notably, this sum equals the product of number of patients and the mean duration time of staying alive at the ICU without nosocomial infection of 8.52 (6,442=756×8.52). All patients were followed-up until discharge or death; there was no administrative censoring.
Real data from a German hospital cohort study that are publicly available. Each line represents 1 patient admission. The gray line means that the patient is not infected with nosocomial infection, black means that the patient is infected (usually assumed until death or discharge).

Competing risks (left) and multistate model (right). We assume constant hazards λij (hazard from state i to j).

Patients with a nosocomial infection (marked with a black line after nosocomial infection acquisition) are still at risk to die or will be discharged. The black patient days (of the same patients) contribute to the state 1 in the multistate model (Figure 1). Thus, infected patients contribute both to the at-risk time in state 0 (ie, the pre-nosocomial infection time marked in gray) as well as in state 1 (ie, the post-NI time marked in black). The sum of all (black) at-risk times is 1,527 patient days in state 1; the mean duration time of staying alive at the ICU with nosocomial infection is 12.5 days.
Incidence Density, Risk, and Odds of Nosocomial Infection
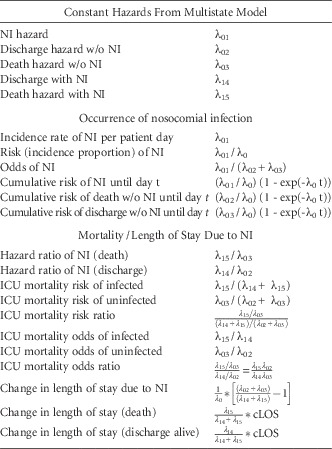
The 5 hazards can now be used to perform basic multistate analyses (Tables 1 and 2). The incidence density of nosocomial infection per patient days is simply λ01, which is interpreted as the daily probability to acquire a nosocomial infection during the hospital stay. The risk of nosocomial infection, however, is
 ${{\lambda _{{01}} } \over {\lambda _{{01}} {\plus}\lambda _{{02}} {\plus}\lambda _{{03}} }}$
, the probability that a nosocomial infection will occur during hospital stay. In the data example, it is 124/(124+475+157)=16.4% because the denominators (summed patient days in state 0) cancel out. The formula shows how the risk of nosocomial infection depends not only on the incidence density λ01 but also on the discharge and death without nosocomial infection hazards λ02 and λ03. The odds of nosocomial infection are
 ${{\lambda _{{01}} } \over {\lambda _{{02}} {\plus}\lambda _{{03}} }}$
=19.6% , the probability that a nosocomial infection will occur during the hospital stay divided by the probability that a nosocomial infection will not occur during hospital stay. It is often similar to the risk of nosocomial infection if the nosocomial infection is rare (ie, a risk<10%).
Overview of Basic Multistate Analysis of Nosocomial Infection That Can Be Done With Constant HazardsFootnote a

NOTE. NI, nosocomial infection; ICU, intensive care unit; cLOS, change in length of stay.
a Short notation: λ 0 =λ 01 +λ 02 +λ 03 , λ 1 =λ 14 +λ 15
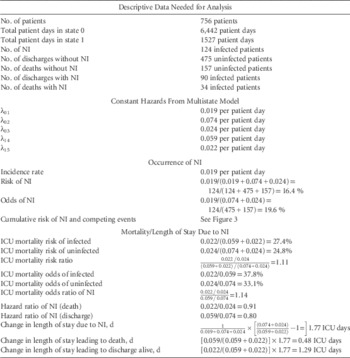
Real Data Example From a German Cohort StudyFootnote a
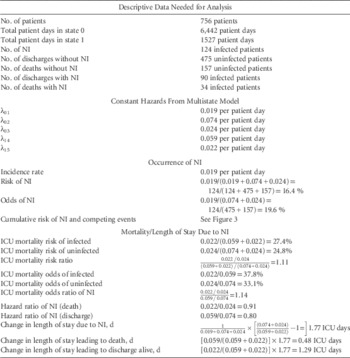
NOTE. NI, nosocomial infection; ICU, intensive care unit.
a For calculations, we used the exact values; constant hazards have been rounded.
Analysis of Risk Factors Associated With Nosocomial Infection
The first step to performing an analysis of risk factors for nosocomial infection (eg, older age or invasive devices) is to study the effect on the 3 event-specific hazards λ01, λ02, and λ03. Thus, for a binary risk factor (1=present, 0=absent), one calculates the event-specific hazard ratios
λ1 01 ∕ λ0 01, λ1 02 ∕ λ0 02 and λ1 03 ∕ λ0 03. The superscripts 1 or respectively 0 indicate the corresponding hazard with or respectively without the risk factor. Such an analysis, usually done with event-specific Cox or Poisson regression models, provides information on the way the risk factor is associated with the instantaneous risk (or the speed) to acquire a nosocomial infection, to be discharged, or to die in the hospital. This etiological approach does not study the effect on the cumulative risk of nosocomial infection. For this cumulative metric, the risk odds ratio is a commonly used association measure and can be calculated with the logistic regression model. The dependency on λ 02 and λ 03 is the reason that risk odds ratios often differ from hazard ratios because risk factors of nosocomial infection are also often associated with discharge and death without nosocomial infection hazards (and thus a Cox or Poisson is often different from a logistic regression analysis). However, the following relationship exists between the odds ratio of a binary risk factor for nosocomial infection and the hazard ratios of the multistate model in the simple setting of time-constant hazards:
 $$\eqalignno{ {\rm odds}&\,{\rm ratio}\,{\rm of}\,{\rm risk}\,{\rm factor}\,\left( {{\rm NI}} \right) \cr &{{\equals}\, {{{\rm hazard}\,{\rm ratio}\,{\rm of}\,{\rm risk}\,{\rm factor}\,\left( {{\rm NI}} \right)} \over {{\rm hazard}\,{\rm ratio}\,{\rm of}\,{\rm risk}\,{\rm factor}\,\left( {{\rm discharge}\,{\rm or}\,{\rm death}} \right)}}$$
which equals more formally
 ${{\lambda _{{01}}^{1} \,/\,\lambda _{{01}}^{0} } \over {\left( {\lambda _{{02}}^{1} {\plus}\lambda _{{03}}^{1} } \right)\,/\,\left( {\lambda _{{02}}^{0} {\plus}\lambda _{{03}}^{3} } \right)}}$
. Notably, the sum of the 2 hazards λ02 and λ03 is the hazard of the combined end point of death and discharge. The formula shows that a decreasing or increasing effect of a risk factor on the discharge or death hazard leads to increasing or decreasing nosocomial infection odds.
Cumulative Risk of Nosocomial Infection Depending on Time
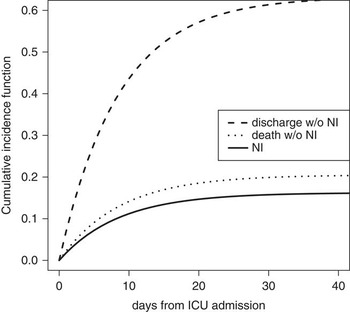
The cumulative risk of nosocomial infection is the probability of acquiring nosocomial infection until day t and can be written as (λ01/(λ01+λ02+λ03))×(1−exp(−(λ01+λ02+λ03)×t)) (see also Schumacher et alReference Schumacher, Allignol, Beyersmann, Binder and Wolkewitz 12 and Beyersmann et alReference Beyersmann, Gastmeier and Schumacher 13 ). In other words, it displays the way the risk of nosocomial infection increases with time, up to the proportion λ01/(λ01+λ02+λ03) (Table 1 and Figure 3).

The impact of competing risk bias can be seen easily if these estimates are compared to the estimate where competing events are treated as censored observation. For instance, censoring competing events for nosocomial infection means setting λ02 and λ03 to zero. Thus, the biased measures are 1−exp(−λ01 t) for nosocomial infection, 1−exp(−λ02 t) for discharge, and 1−exp(−λ03 t) for death without nosocomial infection.
Impact of Nosocomial Infection on ICU Mortality
The first step in quantifying the consequences of nosocomial infection is to model the association between nosocomial infection and the death and discharge hazards. Our data example shows that nosocomial infection patients are associated with a decreased discharge as well as death hazard (hazard ratios λ14 /λ02=0.80 and λ15 /λ03=0.91, respectively). Notably, this analysis is a simplified version of 2 event-specific Cox or Poisson regression models (one for outcome death with censoring discharged patients and another for outcome discharge with censoring the deaths) with nosocomial infection treated as a time-dependent variable. The hazard ratios show that patients with nosocomial infection stay longer at the ICU (hazard ratio of nosocomial infection, ie, discharge, is much lower than 1) and that the daily probability to die in the ICU is almost not influenced by nosocomial infection (hazard ratio of nosocomial infection, ie, death, is close to 1). In contrast, a logistic regression model estimates the odds ratio of nosocomial infection regarding death. This model ignores any timings of nosocomial infection, death, and discharge and can be regarded as a snapshot at the end of stay in the ICU.Reference Wolkewitz, Beyersmann, Gastmeier and Schumacher 14 In the data, the estimated odds ratio for ICU death of 1.14 (ie,=(34×475)/(90×157)) shows that nosocomial infection increases ICU mortality meaning that more patients with nosocomial infection eventually die in the ICU than without nosocomial infection. Thus, even though the death hazard ratio of nosocomial infection is lower than 1, the odds ratio for ICU death is >1. In the simple setting of time-constant hazards, the dependency between the odds ratio and the hazard ratios (and thus between logistic and 2 time-dependent Cox or Poisson regression models) can be displayed as follows:
 $${\rm odds}\,{\rm ratio}\,{\rm of}\,{\rm NI}\,\left( {{\rm death}} \right)\, {\equals}\, {{{\rm hazard}\,{\rm ratio}\,{\rm of}\,{\rm NI}\,\left( {{\rm death}} \right)} \over {{\rm hazard}\,{\rm ratio}\,{\rm of}\,{\rm NI}\,\left( {{\rm discharge}} \right)}}$$
which equals more formally
 $${{\lambda _{{15}} \,/\,\lambda _{{03}} } \over {\lambda _{{14}} \,/\,\lambda _{{02}} }}$$
. Both OR as well as RR, are summary measures of both event-specific hazards for ICU death and discharge. From the formula, it follows that a reducing/increasing effect on the discharge hazard has an increasing/decreasing effect on the ICU mortality risk and odds. It also follows that if there is no effect of nosocomial infection on the death or discharge hazard (ie, λ03=λ15 and λ02=λ14), the odds ratio (OR) and risk ratio (RR) equals 1. If there is no effect on the death hazard (λ03=λ15) and the nosocomial infection is associated with a reduced discharge hazard (λ14<λ02) (meaning that nosocomial infection patients stay longer at the ICU), then the risk ratio and odds ratio are >1 (OR>RR>hazard ratio [HR]=1). Analogously, an increased discharge hazard (λ14>λ02) leads to reduced risk and odds ratios (OR<RR<HR=1).
Change in Length of ICU Stay Due to Nosocomial Infection
Allignol et alReference Allignol, Schumacher and Beyersmann 15 showed the way how the change in the length of the ICU stay due to nosocomial infection depends on the 5 hazards, including the distinction between patients being discharged and dying in the ICU (Table 1). Applied to the data, patients with nosocomial infection stay 1.77 days longer in the ICU than patients without nosocomial infection; 0.48 additional ICU days regarding death; and 1.29 additional days regarding discharge. These estimates consider the time-dependency of nosocomial infection (patient days before infection belong to the ‘uninfected group’ and not to the ‘infected group’) and therefore avoid the time-dependent bias. In the data, the time-dependent biased estimate would be the difference of 21.0 days (eventually with nosocomial infection) and 8.5 days (eventually without nosocomial infection), resulting in 12.5 additional ICU days. In the time-dependent biased analysis, the patient days before infection are incorrectly counted as ‘infected’ patient days.
DISCUSSION
In this article, we provided the concept and framework of basic multistate modeling for nosocomial infection. Without sophisticated software, a first-step analysis of risk and consequences of nosocomial infection can be performed easily using the plug-in values of 5 accessible hazard rates. This procedure has been demonstrated with real ICU data. At least, the results are free of time-dependent and competing-risk biases. Even if the assumption of time-constant hazards is not realistic, the plug-in analysis can give good approximations. The formulas shown herein can be used to reconstruct analyses from published articles if the values are available (see examples in Wolkewitz et alReference Wolkewitz, Harbarth and Beyersmann 16 and Wolkewitz et alReference Wolkewitz, Di Termini, Cooper, Meerpohl and Schumacher 17 ).
The following quantities can also be displayed in dependency of the constant hazards and time: mortality risk of patients with and without nosocomial infection, attributable mortality, and population-attributable fraction (unpublished data). All time-dependent measurements approximate eventually (for large time points) the ones shown in Table 2.
The basic multistate model can be extended in several ways. The first extension is that the hazards themselves might depend on time. From our experience, the discharge hazard λ02 often starts large at earlier time points and then decreases because the proportion of shorter-stay patients is usually large.Reference Wolkewitz, Zortel, Palomar-Martinez, Alvarez-Lerma, Olaechea-Astigarraga and Schumacher 18 Even though a simple mathematical form (as shown in this article) is then intractable, all time-dependent measurements can be estimated with nonparametric estimation methods allowing for time-dependent hazards.Reference Allignol, Schumacher and Beyersmann 15 , Reference Beyersmann, Allignol and Schumacher 19 , Reference Schumacher, Wangler, Wolkewitz and Beyersmann 20 Notably, the exact relationships between the event-specific hazard ratios and the odds ratio (as shown in this paper) do not hold if the hazards depend on time. The next extension is to allow for confounding adjustments and control. Time-independent potential confounders can be easily included in the corresponding regression models (ie, logistic, Cox, and/or Poisson). The time-dependent extension of the logistic regression model for nosocomial infection is the Fine and Gray model, which yields so-called subdistribution hazard ratios and quantifies effects in terms of the cumulative risk of nosocomial infection (see examples in Wolkewitz et alReference Wolkewitz, Cooper and Palomar-Martinez 21 ). If cohort data from many ICUs are available, frailty models account for the fact that patients are clustered within ICUs.Reference Wolkewitz, Cooper and Palomar-Martinez 21 , Reference Liquet, Timsit and Rondeau 22 In the presence of time-dependent variables (eg, invasive devices such as mechanical ventilation), some approaches aim to adjust for time-dependent confounding via marginal structural models.Reference Bekaert, Timsit and Vansteelandt 23
These techniques are not restricted to nosocomial infection and can also be applied to other time-dependent complications in the hospital such as delirium during ICU stay.Reference Klein Klouwenberg, Zaal and Spitoni 24 To improve reports from cohort studies about nosocomial infection, we recommend that the corresponding event counts be provided as well as the total patient days so that a simple multistate model reanalysis can be performed.
ACKNOWLEDGMENTS
We thank Kim Harris for English proofreading.
Financial support: This work was supported by the German Research Foundation (grant no. WO 1746/1-2 to M.W.). M.v.C. has received support from the Innovative Medicines Initiative Joint Undertaking (grant no. 115737-2, Combatting Bacterial Resistance in Europe—Molecules Against Gram-Negative Infections, ie, COMBACTE-MAGNET). The funders had no role in data collection and analysis, decision to publish, or preparation of the manuscript. Potential conflicts of interest: All authors report no conflicts of interest relevant to this article.