Introduction
The ability to infer other people's emotional states from faces is crucial for normal social interaction. Emotion recognition in humans is considered to be an innate ability that largely generalizes at least for a specific set of basic emotions across different cultures (for a comprehensive meta-analytic overview, see Elfenbein and Ambady, Reference Elfenbein and Ambady2002). The normal processing of facial expressions requires two different processes namely perception and emotion recognition.
Recent evidence shows that individuals with PD are impaired in the recognition of emotions from facial cues. However, contradictory results have been reported in recent studies aimed at investigating FER. So far, studies have either found general emotion deficits or deficits in recognizing specific emotions (such as disgust, fear, and anger) in individuals with PD (Sprengelmeyer et al., Reference Sprengelmeyer2003; Yip et al., Reference Yip, Lee, Ho, Tsang and Li2003; Dujardin et al., Reference Dujardin2004; Lawrence et al., Reference Lawrence, Goerendt and Brooks2007; Ibarretxe-Bilbao et al., Reference Ibarretxe-Bilbao2009; Assogna et al., Reference Assogna2010; Clark et al., Reference Clark, Neargarder and Cronin-Golomb2010; Herrera et al., Reference Herrera, Cuetos and Rodriguez-Ferreiro2011). In other studies however, no FER deficits were found (Adolphs et al., Reference Adolphs, Schul and Tranel1998; Pell and Leonard, Reference Pell and Leonard2005). One prior study found that emotion recognition deficits develop at a very early state of PD, even before motor symptoms become manifest (Ibarretxe-Bilbao et al., Reference Ibarretxe-Bilbao2009).
Two recent narrative reviews (Assogna et al., Reference Assogna, Pontieri, Caltagirone and Spalletta2008; Peron et al., Reference Peron, Dondaine, Le Jeune, Grandjean and Verin2012) and one meta-analysis (Gray and Tickle-Degnen, Reference Gray and Tickle-Degnen2010) revealed heterogeneous and inconsistent results regarding potential FER performance impairments in PD patients. The causes for these deficits are currently unclear and need to be evaluated. Moreover, it is unknown whether FER deficits in PD are secondary to specific neurocognitive deficits or broader cognitive impairments. Executive or memory deficits and overt dementia seem to be independent non-motor aspects of PD that play an important role in determining functional outcomes (Kehagia et al., Reference Kehagia, Barker and Robbins2010; Litvan et al., Reference Litvan2011). So far, only few studies have examined associations between FER performance and cognitive functions, executive functions in particular, and results remain inconclusive (Dujardin et al., Reference Dujardin2004; Assogna et al., Reference Assogna2010). Thus, the potential role of executive function constraints in FER needs further investigation. In order to recognize facial emotions, it seems necessary to have certain language and memory capabilities. However, no study has yet investigated whether specific memory or language impairments in PD patients are related to FER.
Altered FER has also been shown in depressed individuals. Typically, depressed patients perform lower on FER tasks for some, but not all emotional expressions (Anderson et al., Reference Anderson2011). Depression is a prominent non-motor feature of PD (Lehrner et al., Reference Lehrner2014a) and may have a strong influence on emotional experiences and behavior in PD. Currently, it is unknown whether FER deficits in PD are secondary to comorbid depression (Gray and Tickle-Degnen, Reference Gray and Tickle-Degnen2010).
Previous studies found a positive link between intelligence test performance and FER (Sullivan and Ruffman, Reference Sullivan and Ruffman2004). To the authors’ knowledge, this association has not been investigated in PD patients so far.
Several cortical and subcortical brain regions are related to the recognition of emotions from facial expressions, including the occipital–temporal cortex, the amygdala, the orbitofrontal cortex, the basal ganglia, and the right parietal cortex (Adolphs et al., Reference Adolphs, Schul and Tranel1998). Several studies suggest an important role of the prefrontal cortex for processing of emotional stimuli, thus making damage to this brain region a likely candidate underlying these impairments (e.g. Vandekerckhove et al., Reference Vandekerckhove2014). Some of these areas, namely the nigrostriatal system, the amygdala, and the insular cortex, are affected by PD-related pathology (Braak and Del Tredici, Reference Braak and Del Tredici2009). Furthermore, it has been shown that neurodegenerative processes impair emotion recognition. Recent neuroimaging studies indicate a relationship between gray matter loss in the orbitofrontal cortex and FER impairments in early PD (Ibarretxe-Bilbao et al., Reference Ibarretxe-Bilbao2009). In this vein, potential FER impairments of PD patients with differing severity of cognitive deficits warrant attention.
PD-MCI is a clinical condition defined by the presence of cognitive impairment in the context of essentially unaltered activities of everyday living. Usually, MCI groups are subtyped according to diagnostic criteria for patients with non-aMCI who are impaired in attention, executive functioning, and language but not memory whereas patients with aMCI show impairments in memory with or without cognitive deficits in attention, executive functioning, and language (Litvan et al., Reference Litvan2011; Lehrner et al., Reference Lehrner2014b). According to a more recent alternative approach, MCI groups may be subtyped according to sMCI or mMCI impairments of cognitive functions (Litvan et al., Reference Litvan2012).
In the present study, we compare initially FER in groups of PD patients without cognitive impairment, non-aMCI, or aMCI with a large age-equivalent sample of healthy controls. To substantiate our results, we subsequently present results for FER group differences according to alternative MCI classification criteria into sMCI versus mMCI. To our knowledge, this is the first study to present evidence of differences in FER between subgroups of PD patients with and without (amnestic) and single- or multi-domain cognitive impairments. FER related to aMCI might reflect a memory related effect, possibly due to neuropathological changes in the mesial temporal lobe whereas non-aMCI-related FER might reflect an executive function-related effect possibly due to frontal lobe pathology. We expect increasing FER deficits with progressing cerebral pathology. Specifically, we expect higher FER performance for controls than PD samples with and without cognitive impairment. We provide evidence for potentially moderating influences of age, sex, number of educational years, self-reported depressive symptoms, and premorbid IQ test performance.
Methods
Participants
The current data are part of a larger research project, the Vienna Mild Cognitive Impairment and Cognitive Decline in Parkinson's Disease Study (VMCI-CD-PD Study). The VMCI-CD-PD Study is a prospective cohort study including consecutive, community-dwelling PD patients who attend the movement disorder clinic for assessment of their Parkinsonism (Lehrner et al., Reference Lehrner2014b). The study protocol is in accordance with the Helsinki Declaration and has been approved by the Ethics Committee of the Medical University of Vienna.
All PD patients underwent a clinical examination and neuropsychological testing. The clinical examination involved assessment of the complete medical history, detailed history of PD, which was obtained using a standardized interview, and a complete neurological examination of patients including administration of the motor section of the Unified Parkinson's Disease Rating Scale (UPDRS-III) and the modified Hoehn and Yahr scale (Fahn et al., Reference Fahn, Elton, Fahn, Marsden, Calne and Goldstein1987).
Clinical examination and neuropsychological testing were performed during the “on” state of patients (that is, while patients were adhering to their usual medical regimen). The “on” state was secured through clinical judgment and subjective patient reporting during the “on” state.
Potential medication response (fluctuators vs. non-fluctuators) was not assessed. Patients who had never undergone brain X-ray computed tomography (CT) or magnetic resonance imaging (MRI) during the course of PD and patients showing clinical features incompatible with previous imaging results were referred to structural imaging. Both neuroimaging and clinical features were used to determine significant cerebrovascular disease or other co-morbid conditions with a potential impact on cognitive outcomes. Imaging data were used to assess suitability of patient participation in the present study according to the below criteria.
Following standard approaches in similar studies, a number of criteria had to be fulfilled for patients to be included in the present study. All PD patients had to fulfill the UK Parkinson's Disease Society Brain Bank criteria for PD (Gibb and Lees, Reference Gibb and Lees1988). Patients were excluded from the study if any of the following conditions applied: (a) evidence of having had a stroke as determined by neuroradiologic and clinical examinations; (b) history of severe head injury; (c) current psychiatric diagnosis according to ICD-10 (Dilling et al., Reference Dilling, Mombour and Schmidt2000) with the exception of patients with (sub)depressive symptoms; (d) any medical condition that can lead to cognitive deterioration including renal, respiratory, cardiac, and hepatic disease; or (e) diagnosis of dementia according to DSM-IV (Saß et al., Reference Saß, Wittchen, Zaudig and Houben2003). Patients with Mini-Mental State Examination (MMSE; Folstein et al., Reference Folstein, Folstein and McHugh1975) scores below 26 were excluded.
In all, 99 PD patients were recruited. The median PD onset was 55 (range 39–75) years. The median disease duration was 6 years (range 0.25–19.00). The mean UPDRS-III Motor score was 25.1 (SD = 12.4). Moreover, a sample of 168 healthy volunteers of about the same age range (mean age = 62.72; SD = 12.57; 106f) was recruited from senior citizen community meetings and through advertisements in hospitals and at general practitioners. All healthy controls had scores > 26 in the MMSE, thus meeting common criteria of cognitively healthy samples (median = 29; interquartile range = 28–30; mean = 28.82). Preceding inclusion in either of the present samples, all participants underwent neuropsychological and medical screenings. After the completion of the evaluation, the cognitive status of MCI subtypes was determined according to the Peterson criteria (Petersen, Reference Petersen2004) and according to the Litvan criteria (Litvan et al., Reference Litvan2012), and the cut off score used was 1.5 standard deviations below age- and education-corrected norms using a normative sample of cognitively healthy controls. For this purpose, the flexible GAMLSS (Generalized Additive Models for Location, Scale and Shape) model class was used. The domain structure of the NTBV has previously been investigated empirically by means of cluster analysis. The clustering into domains reflects the correlation structure of the z-scores as implemented in “proc varclus” of the software package SAS, version 9.2. The variable clustering procedure revealed a 6-cluster solution defining 6 domains for the 30 cognitive variables (Pusswald et al., Reference Pusswald2013). The naming of the domains is not meant to be absolute and is oriented toward the most strongly correlated variables.
For the Petersen criteria, the mean mode of MCI classification was used and patients were divided into three groups of patients based on cognitive features as follows: PD patients cognitively intact (PD-CI; mean z-scores of each domain were larger than −1.5 SD), PD patients with aMCI (PD-aMCI; mean z-score of the memory domain was below −1.5 SD or the mean z-score of the memory domain was below −1.5 SD and at least one of the mean z-scores of the remaining domains was below −1.5 SD) and PD patients with non-amnestic MCI (PD-non-aMCI; mean z-scores of at least one domain other than memory domain were below −1.5 SD), respectively.
For the Litvan criteria, patients were divided into three groups of patients based on cognitive features as follows: PD patients cognitively intact (PD-CI; z-score of each single test was larger than −1.5 SD), PD patients with single MCI (PD-sMCI; z-scores of two tests within a single cognitive domain were below −1.5 SD), and PD patients with multiple MCI (PD-mMCI; at least one test in two or more cognitive domains was below −1.5 SD).
As indicated above, PD patients were categorized twice into three groups, respectively. According to Petersen's classification (i.e. cognitively intact vs. non-aMCI vs. aMCI; Petersen, Reference Petersen2004), the sample comprised patients exhibiting no cognitive decline (i.e. cognitively intact PD patients: PD-CI; n = 26; mean age = 65.46; SD = 9.58; 9f; MMSE: median = 29; interquartile range = 28–30; mean = 28.81), PD-non-aMCI (n = 57; mean age = 67.32; SD = 9.93; 22f; MMSE: median = 28; interquartile range = 27–29; mean = 27.65), or PD-aMCI (n = 14; mean age = 68.71; SD = 5.72; 3f; MMSE: median = 27.5; interquartile range = 26.8–28.3; mean = 27.00). According to Litvan's classification (i.e. cognitively intact vs. sMCI vs. mMCI; Litvan et al., Reference Litvan2012), the sample comprised patients exhibiting no cognitive decline (i.e. cognitively intact PD patients: PD-CI; n = 17; mean age = 64.59; SD = 10.05; 7f; MMSE: median = 29; interquartile range = 28–30; mean = 29.06), PD-sMCI (n = 30; mean age = 66.07; SD = 11.27; 11f; MMSE: median = 28; interquartile range = 26–29; mean = 27.53), or PD-mMCI (n = 50; mean age = 68.42; SD = 7.60; 16f; MMSE: median = 28; interquartile range = 27–29; mean = 27.66).
Materials
Vienna emotion recognition task – short form (VERT-K)
The VERT-K consists of 36 colored pictures of faces either expressing anger, disgust, fear, happiness, sadness (i.e. basic emotions), or showing neutral facial expressions in six pictures respectively. The stimuli comprised Caucasian actors only and included an equal number of male and female pictures presented on a black background. Stimulus pictures are presented in randomized order on a computer screen and participants are instructed to select emotions that correspond to the respective facial expression (for a detailed description, see Derntl et al., Reference Derntl, Kryspin-Exner, Fernbach, Moser and Habel2008). Scores are based on the total number of correct responses.
Beck depression inventory II (BDI II; Hautzinger et al., Reference Hautzinger, Keller and Kühner2006)
The BDI II is a 21-item self-report measure for assessment of depression. Participants need to select in each item one out of four statements (each statement reflecting more or less depressive states) which most closely corresponds to their affect during the past two weeks. Scores were calculated with higher scores indicating higher depression.
Vocabulary test (WST; Schmidt and Metzler, Reference Schmidt and Metzler1992)
The vocabulary test is a widely used Rasch-calibrated measure of crystallized intelligence in German language. In 42 items, participants have to indicate one meaningful word in presence of five distractor words. Scores of the vocabulary test have been considered to provide a useful estimate of premorbid IQ because test performance appears to be largely unaffected by age or neurodegenerative processes.
Neuropsychological assessment
All participants were assessed on the NTBV (Lehrner et al., Reference Lehrner2014b). The NTBV is a multidimensional test battery comprising the six domains attention, executive functions (interference, lexical verbal fluency, planning and non-verbal fluency), language, and memory. The Alters-Konzentrations-Test (Gatterer, Reference Gatterer2008), which is a geriatric cancellation test, was administered to assess attention. The symbol counting task from the cerebral insufficiency test (Lehrl and Fischer, Reference Lehrl and Fischer1997), which uses 42 squares to be counted with the dominant hand was used to assess attention.
The digit-symbol subtest of the German form of the revised Wechsler Adults Intelligence Scale (Tewes, 1994), the symbol counting task from the cerebral insufficiency test (Lehrl and Fischer, Reference Lehrl and Fischer1997), the Trail Making Test B, and the score difference of the Trail Making Test A and B (Reitan, Reference Reitan1979) were used to assess attention. Executive functions were assessed using the Trail Making Test A (Reitan, Reference Reitan1979), the Five-Point Test (Regard et al., Reference Regard, Strauss and Knapp1982), the Maze Test, and the Stroop Test of the Nürnberger Alters Inventar (Oswald and Fleischmann, Reference Oswald and Fleischmann1997). The interference score from the cerebral insufficiency test (Lehrl and Fischer, Reference Lehrl and Fischer1997) was used for evaluating executive functions.
Semantic lexical fluency was assessed by participants having to name as many words beginning with the letters b, f, and l that came to their mind within one minute for each letter. Furthermore, in order to assess language functions, we used verbal fluency tasks and a confrontation naming task (Goodglass and Kaplan, Reference Goodglass and Kaplan1983). Naming as many animals, supermarket items and tools that came to mind within one minute for each task was used to tap semantic verbal fluency. The modified Boston Naming Test (Morris et al., Reference Morris1989) was used for assessment of word retrieval. Episodic memory was tested using the Verbal Selective Reminding Test (Lehrner et al., Reference Lehrner, Gleiß, Maly, Auff and Dal-Bianco2006).
Procedure
Upon agreeing on participation, volunteers took part individually in a clinical interview in which potential reasons for study exclusion were determined. If all exclusion criteria were ruled out, participants were invited to individual neuropsychological assessments taking place at the movement disorder clinic of the Vienna General Hospital. Confidentiality of data was ensured and participants provided written informed consent. Tests were administered by a trained researcher in a quiet location and took about two hours. All assessments were administered as pen-and-paper tests with the exception of the VERT-K which was administered on a computer.
Statistical analysis
We performed our analyses in four steps for both Petersen's and Litvan's classification. First, we calculated a series of one-way analyses of variance to assess differences between patient groups and controls in regard to emotion recognition performance and neuropsychological variables. Second, Bonferroni-corrected post-hoc tests were used to examine pairwise group differences. Third, we assessed bivariate two-tailed Pearson correlations between FER and demographic, neuropsychological, as well as cognitive performance variables. Finally, in a hierarchical stepwise multiple regression, theory-guided inclusion of predictors for FER took place in three steps. Type of diagnosis was entered in a first, participant sex and age in a second, and self-reported depression, number of school years, and premorbid IQ in a third block. Model fit of our three resulting regression models was evaluated based on changes of explained variance. Effect sizes were interpreted according to well-established classifications into small, medium, and large effects (Cohen, Reference Cohen1988). All analyses were performed in SPSS 21.0 and the open-source software R 3.2.2 (R Core Team, 2015).
Results
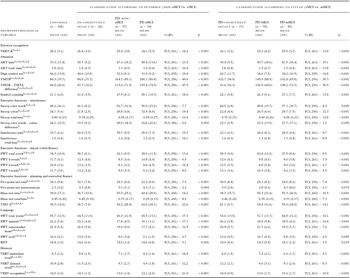
We describe first our findings according to Petersen's and subsequently according to Litvan's classification. For Petersen's classification, healthy controls outperformed patients in FER performance, yielding large significant effects when compared to non-aMCI and aMCI PD patients (Cohen ds = 0.84 and 1.22, respectively) and a medium-sized albeit non-significant effect when compared to cognitively intact PD patients (Cohen d = 0.58). Although differences between patient groups did not reach nominal significance, non-trivial small- to medium-sized effects were observed for all pairwise comparisons. Cognitively intact patients showed higher scores than both non-aMCI and aMCI patients (Cohen ds = 0.28 and 0.57, respectively) and non-aMCI patients scored higher than aMCI patients (Cohen d = 0.31).
Consistent with our expectations, significant group differences emerged for virtually all neuropsychological variables. Differences were most pronounced between MCI patients and the other two groups with the former performing worse than the latter in virtually all investigated variables. Unsurprisingly, non-aMCI PD patients performed significantly better than aMCI PD patients in memory-related tasks, but performance between groups did not significantly differ on the other tasks. No significant differences emerged between healthy controls and cognitively intact PD patients except for semantic verbal fluency where interestingly, cognitively healthy patients performed better than healthy controls. Detailed results for between-groups differences are provided on the left-hand side of Table 1.
Group differences in emotion recognition and neuropsychological variables by domain classified according to Petersen's criteria into non-aMCI versus aMCI and according to Litvan's criteria into single-versus multi-domain MCI

Note. PD cognitively intact = Parkinson's disease patients that are otherwise cognitively intact; PD-non-aMCI = Parkinson's disease patients with non-amnestic mild cognitive impairment; PD-aMCI = Parkinson's disease patients with amnestic mild cognitive impairment; PD-sMCI = Parkinson's disease patients with single-domain mild cognitive impairment; PD-mMCI = Parkinson's disease patients with multi-domain mild cognitive impairment; AKT = Alters-konzentrations-test (geriatric alertness test); BNT = Boston Naming Test; PWT = Phonematische Wortflüssigkeit (phonematic verbal fluency); SWT = Semantische Wortflüssigkeit (semantic verbal fluency); TMT = Trail Making Test; VERT-K = Vienna Emotion Recognition Task – Short Form; VSRT = Verbal Selective Reminding Test; Bonferroni-corrected significant pairwise differences: a = Controls versus PD cognitively intact according to Petersen; b = Controls versus PD-non-aMCI; c = Controls versus PD-aMCI; d = PD cognitively intact according to Petersen versus PD-non-aMCI; e = PD cognitively intact according to Petersen versus PD-aMCI; f = PD-non-aMCI versus PD-aMCI; g = Controls versus PD cognitively intact according to Litvan; h = Controls versus PD-sMCI; i = Controls versus PD-mMCI; j = PD cognitively intact according to Litvan versus PD-sMCI; k = PD cognitively intact according to Litvan versus PD-aMCI.
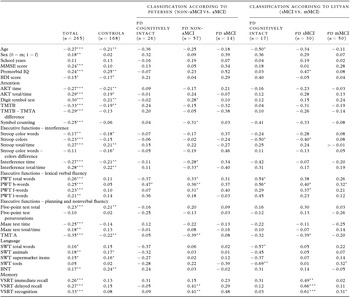
In our total sample, performance on the FER tasks was negatively related to age and self-reported depression, but positively with being female as well as IQ and MMSE scores. Moreover, higher FER performance was almost invariably related to higher performance in neuropsychological tasks. More fine-grained analyses showed that most of these associations were primarily driven by healthy controls and failed to reach significance in patient groups (signs of correlation coefficients predominantly maintained their direction across groups though; see left-hand columns of Table 2).
Total and diagnosis-specific correlations of emotion recognition performance (VERT-K) with demographics, premorbid IQ, Mini-Mental State scores, BDI scores, and neuropsychological subtests

Note. PD cognitively intact = Parkinson's disease patients that are otherwise cognitively intact; PD-non-aMCI = Parkinson's disease patients with non-amnestic mild cognitive impairment; PD-aMCI = Parkinson's disease patients with amnestic mild cognitive impairment; PD-sMCI = Parkinson's disease patients with single-domain mild cognitive impairment; PD-mMCI = Parkinson's disease patients with multi-domain mild cognitive impairment; AKT = Alters-konzentrations-test (geriatric alertness test); BDI = Beck Depression Inventory; BNT = Boston Naming Test; PWT = Phonematische Wortflüssigkeit (phonematic verbal fluency); MMSE = Mini-Mental State Examination; SWT = Semantische Wortflüssigkeit (semantic verbal fluency); TMT = Trail Making Test; VERT-K = Vienna Emotion Recognition Task – Short Form; VSRT = Verbal Selective Reminding Test. * = p < 0.05, ** = p < 0.01, *** = p < 0.001.
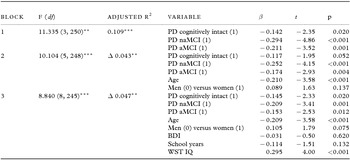
For our hierarchical regressions, diagnosis types were initially dummy-coded and entered in a first block as predictors of FER performance. Signs of regression coefficients indicated significantly better performance of healthy controls than patient groups. Inclusion of participant age and sex in a second block significantly improved model fit, although only age but not sex emerged as a significant negative predictor. In our third block, we added self-reported depression, number of school years, and premorbid IQ as predictors which again led to significant increases in explained variance although only premorbid IQ emerged as significant positive predictor of FER. Consequently, model three was adopted, explaining about 16% of FER variability (Adjusted R 2 = 0.157) and indicating higher premorbid IQ, younger age, and belonging to healthy controls as significant positive predictors of FER (Table 3A).
Hierarchical regression on emotion recognition scores (VERT-K) for Petersen's classification (non-aMCI vs. aMCI)

Note. n = 254; PD cognitively intact = Parkinson's disease patients that are otherwise cognitively intact; PD-non-aMCI = Parkinson's disease patients with non-amnestic mild cognitive impairment; aMCI = Parkinson's disease patients with amnestic mild cognitive impairment; β = standardized regression coefficient; BDI = Beck Depression Inventory; WST = Wortschatztest (vocabulary test); Dummy-coded variables are referenced to Controls (0); all VIFs < 1.8; Significant changes in R 2 indicate best model fit of model 3; ** = p < 0.01; *** = p < 0.001.
For Litvan's classification, a broadly similar pattern of results was observed. Again, substantial differences in FER favoring controls compared to cognitively intact, sMCI, and mMCI PD patients were observed (Cohen ds = 0.67, 0.89, and 0.83, respectively), although only the latter two comparisons reached nominal significance. Moreover, non-trivial, albeit non-significant effects emerged yielding higher FER scores for cognitively intact compared to sMCI and mMCI PD patients (Cohen ds = 0.22 and 0.17). Comparison of sMCI and mMCI patients did not show meaningful FER differences (Cohen d = −0.08).
Similar to the above results, significant between-groups differences were observed for most neuropsychological variables, yielding typically higher performance of controls than patient groups and cognitively intact than MCI groups in pairwise comparisons. Interestingly though, no between-group differences emerged for sMCI and mMCI groups, thus indicating less differentiation on neuropsychological tasks between sMCI and mMCI (see right-hand columns of Table 1).
Again, patient group correlations with neuropsychological variables were less pronounced than total sample correlations, although signs of correlation coefficients largely maintained their direction. Of note, associations of FER performance appeared to be more strongly associated with memory-related tasks in sMCI than in the other two patient groups (for detailed results, see right-hand columns of Table 2).
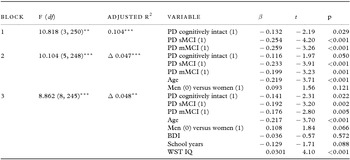
In the first step of our second hierarchical regression analysis, patient groups showed significantly lower FER performance than healthy controls. Inclusion of age and sex in the second step improved model fit but only age contributed significantly to variance explanation, yielding a negative sign of the regression coefficient. Again, the third model explained our data best (Adjusted R² = 0.199), with premorbid IQ emerging as the only additional significant positive predictor of FER whilst self-reported depression and number of school years did not contribute significantly to variance explanation. Consistent with our above results, FER performance appears to be driven by higher premorbid IQ test performance, belonging to the healthy control group and younger ages (Table 3B).
Hierarchical regression on emotion recognition scores (VERT-K) for Litvan's classification (sMCI vs. mMCI)

Note. n = 254; PD cognitively intact = Parkinson's disease patients that are otherwise cognitively intact; PD-sMCI = Parkinson's disease patients with single-domain mild cognitive impairment; PD-mMCI = Parkinson's disease patients with multi-domain mild cognitive impairment; β = standardized regression coefficient; BDI = Beck Depression Inventory; WST = Wortschatztest (vocabulary test); Dummy-coded variables are referenced to Controls (0); all VIFs < 1.8; Significant changes in R 2 indicate best model fit of model 3; ** = p < 0.01; *** = p < 0.001.
Discussion
The present investigation provides further evidence for impaired FER in PD. Stronger performance impairments were observed in PD patients with MCI than in cognitively intact PD patients. MCI type (i.e. non-aMCI vs. aMCI) appeared to play only a minor role.
FER performance was substantially better in controls than in PD patients. In pairwise comparisons, effects were large between controls and PD-MCI patients and medium-sized between controls and cognitively intact PD patients. Cognitively intact PD patients showed higher performance than non-aMCI patients which in turn scored higher than aMCI patients, although effect sizes were only small. Our results corroborate prior findings that PD patients show impairments in FER (Assogna et al., Reference Assogna, Pontieri, Caltagirone and Spalletta2008; Gray and Tickle-Degnen, Reference Gray and Tickle-Degnen2010; Peron et al., Reference Peron, Dondaine, Le Jeune, Grandjean and Verin2012). Similar results were observed for Litvan's classification (Litvan et al., Reference Litvan2012), indicating substantially higher FER scores of healthy controls than patient groups and higher scores of cognitively intact PD patients than PD patients with MCI. However, no meaningful differences between sMCI and mMCI patients emerged.
Importantly, our results suggest that FER performance continuously deteriorates from controls to cognitively intact PD patients to PD-MCI, regardless of the type of classification (i.e. non-aMCI and aMCI vs. sMCI and mMCI). This is a novel finding and presents several points of interest as discussed below. FER deficits have been previously found in studies examining non-demented PD patients (Herrera et al., Reference Herrera, Cuetos and Rodriguez-Ferreiro2011). When keeping in mind recent findings of impaired FER in early stages of PD (Hipp et al., Reference Hipp, Diederich, Pieria and Vaillant2014), these results support the idea that emotion recognition deficits may be present in PD without the contribution of further cognitive deficits. Our observation of FER impairments in cognitively intact PD patients compared to controls conform to these findings and suggest that emotion recognition deficits may develop independently from cognitive impairments.
Age predicted FER negatively, indicating better performance of younger participants. On one hand, these findings could be interpreted as a genuine age effect, indicating negative effects of age on FER. On the other hand, this negative association could be an expression of progressing pathology with aging. A similar (albeit non-significant) negative association between age and FER performance has been recently shown in non-PD patients suffering from subjective cognitive decline, aMCI, or non-aMCI (Pietschnig et al., Reference Pietschnig2016). In fact, an age-related decline of emotion recognition has been previously shown. It has been argued that the observed pattern of age-related change is most consistent with a neuropsychological model of adult aging stemming from changes in frontal and temporal volume or changes in neurotransmitters (Calder et al., 2003; Ruffman et al., Reference Ruffman, Henry, Livingstone and Phillips2008). However, the detected age effect of emotion recognition might also be due to context effects and the perceiver's age. Results from a recent study indicates that contextual influence on emotion perception is not constant, but can vary based on the type of contextual cue, cue relevance, and the perceiver's age (Ngo and Isaacowitz, Reference Ngo and Isaacowitz2015).
Premorbid IQ emerged as a positive predictor of FER performance, thus indicating cognitive task performance as an important component of FER. These findings are consistent with previous accounts of links between FER performance and premorbid IQ in patients with brain pathology (Pietschnig et al., Reference Pietschnig2016). Because premorbid IQ should be largely unaffected of neurological damage, this measure may be considered to be a good estimate of patients’ cognitive abilities preceding disease onset. This is of interest, because it suggests two potential causes to be particularly suitable to explain this positive association. On the one hand, FER performance may be at least to a certain extent a function of general cognitive abilities. Such an explanation is in line with evidence of positive associations of emotion recognition performance with cognitive abilities in healthy samples (Sullivan and Ruffman, Reference Sullivan and Ruffman2004). On the other hand, higher premorbid IQ may act as a protective factor against neural pathology. Higher IQ may be indicative of a larger cognitive reserve (Barulli and Stern, Reference Barulli and Stern2013), which provides compensatory potential for other abilities such as FER in the event of neurodegenerative processes. This explanation is supported by our observation of a robust association between IQ and FER performance even when taking type of diagnoses into account.
We observed a trend of higher FER performance of women compared to men. Although in bivariate correlations, this effect emerged only for the total sample and not in subgroups, the sign of the correlation remained positive in all subgroups. Moreover in our regression models, being female predicted FER performance positively, although the predictor barely failed to reach nominal significance in both analyses. Our results corroborate prior studies reporting female superiority in respect to accuracy. Women tend to perform better than men when all emotions are considered as a set. Regarding specific emotions, there seem to be no sex-related differences in the recognition of happiness, whereas results are quite heterogeneous in respect to the remaining emotions, especially sadness, anger, and disgust (Forni-Santos and Osorio, Reference Forni-Santos and Osorio2015). Therefore, the present evidence provides some support for sex differences in FER; however, it has been suggested that such differences may be most pronounced on more subtle emotional expressions (Hoffmann et al., Reference Hoffmann, Kessler, Eppel, Rukavina and Traue2010).
Although a small negative association emerged between self-reported depression scores and FER performance in zero-order correlations for the total sample, this association did not hold up when further moderating variables were accounted for in our multiple regression models. Consistent with prior evidence (Pietschnig et al., Reference Pietschnig2016), self-reported depression scores did not emerge as meaningful predictors of FER performance.
Lesion and neuroimaging studies have proposed that FER is mediated by pathways projecting to the inferior frontal area within the prefrontal cortex and to the temporo-parietal cortex (Sprengelmeyer et al., Reference Sprengelmeyer2003). Correlational studies revealed an association between poor emotion recognition performance and atrophy in the ventral striatum, amygdala, anterior cingulate cortex and orbital frontal cortex (Ibarretxe-Bilbao et al., Reference Ibarretxe-Bilbao2009; Baggio et al., Reference Baggio2012). In this vein, FER impairment in PD may be explained by amygdala dysfunction. The amygdala's involvement in emotional processing is now well documented in the literature (Adolphs, Reference Adolphs2010). The fact that we have found FER deficits in PD patients with normal cognitive functions, suggests that the FER deficit is not associated with cognitive dysfunction.
Decreased hippocampus and amygdala volume have recently been found to be associated with affective disorders in PD (van Mierlo et al., Reference van Mierlo, Chung, Foncke, Berendse and van den Heuvel2015; Vriend et al., Reference Vriend, Boedhoe, Rutten, Berendse, van der Werf and van den Heuvel2016). Affective disorders such as depression and anxiety are frequently co-occurring in PD and may have partly overlapping underlying pathophysiological mechanisms with FER (Peron et al., Reference Peron, Dondaine, Le Jeune, Grandjean and Verin2012; Dissanayaka et al., Reference Dissanayaka, White, O'Sullivan, Marsh, Pachana and Byrne2014; Vriend et al., Reference Vriend2014). Apathy is an important symptom in PD as well and may also be associated with FER in PD (Pagonabarraga et al., Reference Pagonabarraga, Kulisevsky, Strafella and Krack2015).
A number of limitations in the present study need to be acknowledged. First, our relatively small sample size may limit generalizability to all patients with PD. Moreover, failure to reach nominal significance in pairwise comparisons and subgroup correlations may at least in some cases be attributed to low power because of comparatively small sample sizes (see Tables 1 and 2). However, calculation of effect sizes allowed us to assess the relevance of observed effects beyond mere significance statistics. Second, although we used a comprehensive neuropsychological test battery for controlling cognitive functioning, we did not control for primary vision deficits (e.g. color discrimination) and visuo-constructive functions. Recent evidence suggests that at the early PD stage there are marked deficits of lower order vision performances, while higher order vision performances are still intact. At this stage, PD patients seem still to compensate the deficient input of low-contrast sensitivity (Hipp et al., Reference Hipp, Diederich, Pieria and Vaillant2014). There is also evidence that visuo-constructive functions are impaired in early PD. Because low-order vision and visuo-constructive functions are compromised in PD, both should be controlled in future studies. Third, PD patients were tested, while being “on” their usual medication. It has been shown, that in non-medicated patients emotional face perception may be worse than in medicated patients (Sprengelmeyer et al., Reference Sprengelmeyer2003). Therefore, medication effects should be controlled in future studies. This can be achieved by using newly diagnosed PD patients who do not take PD medication and compare them to PD patients on their standard medication. Fourth, apathy may also influence FER in PD. Thus, apathy should be controlled in future studies by using PD samples with and without apathy.
Fifth, we did not assess differences in FER within specific basic emotions but only on general emotion recognition. This approach was appropriate because of the psychometric properties of the VERT-K. The VERT-K has been shown to provide concise and reliable assessment of global emotion recognition performance, but due to its brevity reliabilities deteriorate substantially in the specific subscales (e.g. Pietschnig et al., Reference Pietschnig2016). Therefore, only global FER performance was investigated in the present study. Finally, we did not correct for multiple testing in our correlational analyses which may have led to a number of significant results due to chance (i.e. 14 coefficients out of 280 coefficients would be expected to be significant in either direction due to chance). However, we observed a substantially larger number of significant correlations (i.e. 71) which were largely consistent with prior evidence in healthy and patient populations (see Pietschnig et al., Reference Pietschnig2016) and provide effect sizes which are more informative than mere interpretation of significance thresholds (see above).
In conclusion, we provide robust evidence for FER impairments in PD. Importantly, FER deficits were even found in cognitively intact PD patients which indicates FER dysfunction prior to development of overt cognitive deficits. Finally, FER was positively predicted by IQ but negatively predicted by age whilst self-reported depression was not associated with FER.
Conflict of interest
None.
Description of the authors’ roles
JL designed the study and supervised the data collection. LS and IR collected the data. IKE, MP, DM, EA, WP, and GP contributed to writing the article. JP designed and carried out the statistical analysis. JL and JP wrote the first draft of the paper.