I. INTRODUCTION
Fossil fuels are becoming increasingly depleted, human demand for energy has increased drastically, and energy has become a worldwide problem facing the 21st century, making improving the comprehensive utilization of existing energy sources and finding new renewable energy urgent. Thermoelectric (TE) devices with n-type and p-type TE material with a lightweight structure; that are simple, environmentally friendly, safe, and stable, etc.; and have no moving parts, no maintenance, and no noise have attracted widespread attention in recent years. Reference Snyder and Toberer1–Reference Disalvo4
Dimensionless thermoelectric figure of merit (ZT) is used to measure the most important indicators of the performance of thermoelectric materials, where ZT = S 2σT/κ (S, σ, κ, and T represent the Seebeck coefficient, electrical conductivity, thermal conductivity, and absolute temperature, respectively). The electrical properties of the material (power factor S 2σ) are closely related; ideal thermoelectric material should have a high S absolute value, high σ, and low κ. Reference Chen, Dresselhaus and Dresselhaus5 Over the years, Bi2Te3-based alloys were used as room-temperature TE materials, Reference Zhao, Zhang, Liu and Li6,Reference Zhou, Li and Kita7 PbQ (Q = Te, Se, or S) alloys, Reference Wang, Li, Nan, Zhou, Liu, Zhang and Kita8,Reference Shi, Yang, Bai, Yang, Wang, Chi, Salvador, Zhang, Chen and Wong-Ng9 Skutterudite compounds were used as middle-temperature TE materials Reference Liu, Zhang, Zhao, Zhang and Li10,Reference Zhao, He, Berardan, Lin, Li, Nan and Dragoe11 ; and SiGe alloy, oxides were used as high temperature TE materials. Reference Samarelli, Llin, Cecchi, Frigerio, Chrastina, Isella, Müller Gubler, Etzelstorfer, Stangl, Zhang, Weaver, Dobson and Paul12,Reference Mansour13 Unfortunately, the high-performance thermoelectric materials used commercially are limited by expensive and toxic raw materials, especially Pb and Te. Reference Zhao, Zhang, Liu and Li6–Reference Shi, Yang, Bai, Yang, Wang, Chi, Salvador, Zhang, Chen and Wong-Ng9 Therefore, TE materials made of cheap, and earth-abundant elements such as SnSe, Reference Zhao, Lo, Zhang, Sun, Tan, Uher, Wolvrton, Dravid and Kanatzidis14,Reference Ge, Wei, Lewis, Martin and Nolas15 Cu2Se, Reference Liu, Shi, Xu, Zhang, Zhang, Chen, Li, Uher, Day and Snyder16,Reference Zhong, Zhang, Li, Chen, Cui, Li, Xie, Hao and He17 Cu–S compounds, Reference Ge, Zhang, Yu, Liu and Li18–Reference Jiang, Yan, Shen, Simpson and Reece20 and AgCuSe Reference Guin, Pan, Bhowmik, Sanyal, Waghmare and Biswas21–Reference Guin and Biswas23 have received increasing attention.
Copper sulfides [Cu2−x S (0 ≤ x ≤ 1)] are superionic conductors with good conductivity, and according to varying of the copper stoichiometry, the band gap of these compounds could be adjusted, and those compounds are widely used in conductive fiber, photoelectric conversion film, solar cells, and other areas. Reference Lou, Samia, Cowen, Banger, Chen, Lee and Burda24,Reference Morimoto and Kullerud25 But Cu2−x S cannot be seen as a unified system. Because, when the stoichiometry of Cu2−x S is even a little different, the crystal structure and physical and chemical properties of Cu2−x S will be completely different. For example, Cu1.8S with a hexagonal phase at room temperature will change to a cubic phase when the temperature is in excess of 361 K. Cu2S possesses a monoclinic phase structure at room temperature, but it will transform into hexagonal phase at temperatures beyond 361 K, then change to a cubic phase when the temperature exceeds 817 K. Reference Ge, Liu, Feng, Lin and He26
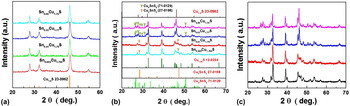
Cu1.8S has been reported as a promising p-type thermoelectric material with high σ and relatively low thermal conductivity, but a low S. Reference Ge, Liu, Feng, Lin and He26 Therefore it would be a good TE material for application in business if its S could be improved. In this study, the effects of Sn addition on the TE properties of Cu1.8S were investigated at temperatures from 323 to 773 K. The Sn x Cu1.8−x S samples with different Sn contents (x = 0.005, 0.01, 0.03, and 0.05) were fabricated by mechanical alloying (MA) combined with spark plasma sintering (SPS). The Sn was supposed to substitute Cu and introduce electron concentration and decrease the carrier concentration in p type Cu1.8S to reduce electrical conductivity and increase Seebeck coefficient. The phase and microstructure of all the bulk samples were checked by X-ray diffraction (XRD) and field emission scanning electron microscopy (FESEM), respectively. The main phase of all the bulk samples are Cu1.96S, but with different second phases. The second phase in the samples x = 0.005 and x = 0.01 is Cu2SnS3. The second phase in the samples x = 0.03 and 0.05 is Cu4SnS4, and the Cu1.8S phase was also detected for the samples x = 0.03 and 0.05.
II. EXPERIMENTAL SECTION
Commercial high-purity powders [99.99% Cu (under 200 mesh), 99.99% S (under 200 meshes), and 99.99% Sn (under 200 meshes)] were used as raw materials. These powders were subjected to an MA process with the chemical compositions of Sn x Cu1.8−x S (x = 0.005, 0.01, 0.03, and 0.05) in a planetary ball mill (QM-4F, Nanjing University, Nanjing, China) at 425 rpm for 18 h under high-purity nitrogen atmospheres with 5% hydrogen. Stainless steel vessels and balls were used, and the weight ratio of ball to powder was kept at 20:1. The ball-milled powders were sintered at 723 K for 5 min in a Φ15 graphite mold under an axial pressure of 50 MPa in a vacuum, using the SPS system (Sumitomo SPS1050, Tokyo, Japan). The ramp-up speed was 90 K/min. The sintered specimens were disk-shaped with dimensions of 15 × 3 mm.
The density of the sample was measured by the Archimedes method. Phase identification was analyzed with X-ray diffraction (XRD; Cu Kα, Bruker D8, Karlsruhe, Germany). The fractographs were observed by field emission scanning electron microscopy (FESEM; JSM-6460, JEOL, Tokyo, Japan). The Seebeck coefficient and electrical resistance were measured using a Seebeck Coefficient/Electrical Resistance Measuring System (ZEM-3, Ulvac-Riko, Kanagawa, Japan) at 323–773 K in a helium atmosphere. The thermal diffusivity (D) was measured by a laser flash method (NETZSCH, LFA457, Selb, Germany), the specific heat (C p) was measured using a thermal analyzing apparatus (Dupont 1090B Fayetteville, North Carolina), the thermal conductivity (k) was determined from the density (d), and the specific heat and thermal diffusivity using the relationship k = DC p d.
The Hall coefficients (R H), carrier concentration, and carrier mobility of the samples were measured at 323 K using a physical properties measurement system (PPMS-9T, Quantum Design Inc., San Diego, California), and a magnetic field of 2 T and electrical current of 30 mA were applied.
III. RESULTS AND DISCUSSION
A. Phase and microstructure
There is no detected impurity phase inside powders before SPS. We were measured the XRD patterns of the Sn x Cu1.8−x S (x = 0.005, 0.01, 0.03, and 0.05) powder samples synthesized by MA, as shown in Fig. 1(a). All the diffraction peaks of the powder samples are indexed as α-digenite phase (PDF card no. 23-0962), which indicates that all the powder samples are pure Cu1.8S without any detected impurity. Figure 1(b) shows the XRD patterns of the Sn x Cu1.8−x S bulk samples (x = 0.005, 0.01, 0.03, and 0.05) sintered by SPS at 723 K for 5 min. The patterns of Sn0.005Cu1.795S and Sn0.01Cu1.79S bulks samples showed well-matched patterns with the binary Cu1.96S (PDF#12-0224), indicating that the main phase of all the bulk samples is Cu1.96S instead of target product Cu1.8S. It may be due to the Sn addition or the too-long ball milling time. A second phase indexed as Cu2SnS3 (PDF#27-0198) appears for the samples x = 0.005 and 0.01, suggesting that Sn does not enter the lattice of Cu1.8S and cause the appearance of Cu1.96S after SPS. However, according to the XRD patterns, the main phase of Cu1.8S with Cu4SnS4 impurities were detected for the bulk samples with x = 0.03 and 0.05. This is reasonable because the generated Cu4SnS4 will reduce the Cu contents in the Cu1.96S matrix resulting in the Cu-deficient to product Cu1.8S. The XRD patterns of bulk samples on both sides of the pellets after SPS showed the similar patterns, as shown in Figs. 1(b) and 1(c), indicating no texture and no segregation in the bulk samples.
(a) XRD patterns of the Sn x Cu1.8−x S (x = 0.005, 0.01, 0.03, and 0.05) powder that was subjected to MA at 425 rpm for 18 h, (b) XRD patterns of Cu1.8S bulk samples sintered by applying SPS using the MA-treated powders for 18 h, (c) the XRD patterns of Sn x Cu1.8−x S (x = 0.005, 0.01, 0.03, and 0.05) bulk samples in the other direction.

After SPS sintering all the bulk samples showed the composites phase structure. The secondary phase species depend on the Sn content at the same SPS condition. The second phase of the samples x = 0.005 and x = 0.01 is Cu2SnS3. The second phase in the samples x = 0.03 and 0.05 is Cu4SnS4. The reason is an open problem, but the possible reason is that when Sn content is low, Cu2SnS3 is more stable in the SPS process compared to Cu2SnS3 and vice versa.
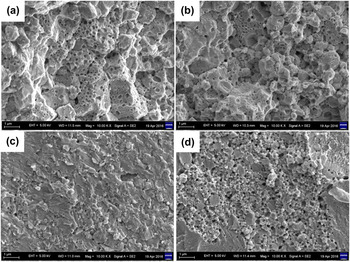
Figure 2 shows the FESEM images of the fractured Sn x Cu1.8−x S bulk sample. As shown in Figs. 2(a) and 2(b), the bulk samples of x = 0.005 and x = 0.01 have porous microstructures, with the relative density of both over 90%. And the grain size was decreased from ∼3 μm for the sample x = 0.005 to ∼700 nm for the sample x = 0.01. As shown in Figs. 2(c) and 2(d), the bulk samples x = 0.03 and 0.05 also have porous microstructures, but smaller grain sizes 500 nm and 100 nm for x = 0.03 and 0.05, respectively. The bulk samples with the highest Sn content (x = 0.05) got the lowest relative density (89%) due to the S volatilization and the impurity pinning. This result is in agreement with the XRD analysis of S volatilization. These pores observed in bulk samples, as shown in Fig. 2, are favorable for reducing κ. The appearance of the pores also matches with the S volatilization or incomplete reaction of S, as described by the reactions in Eq. (1) Reference Ge, Liu, Feng, Lin and He26 :
 $${\rm{C}}{{\rm{u}}_{1.8}}{\rm{S}} \to {\rm{C}}{{\rm{u}}_{1.96}}{\rm{S}} + 0.089{\rm{S}} \uparrow \quad .$$
FESEM images of Cu1.8S with via Sn addition. (a) 0.005 mol, (b) 0.01 mol, (c) 0.03 mol, (d) 0.05 mol.

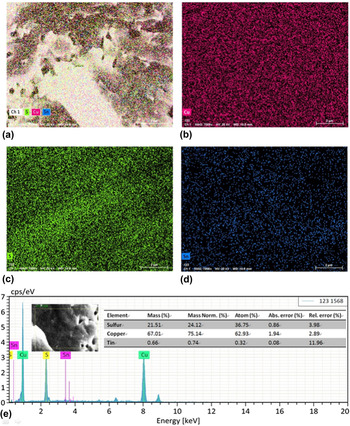
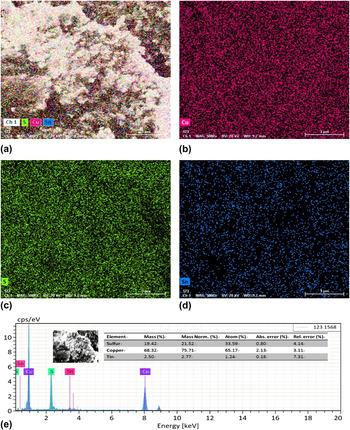
The elemental mapping and EDX face scanning were performed for Sn x Cu1.8−x S (x = 0.01, 0.03) and it was observed that Cu and S are effectively distributed in the entire matrix uniformly, whereas Sn distribution has been observed to near heterogeneous, as shown in Figs. 3 and 4, indicating that Sn doped Cu1.8S samples exhibited second phases. Further, the quantitative elemental analysis of the samples are shown in inset of Figs. 3(e) and 4(e), confirmed the real stoichiometry of the two samples are Sn0.32Cu62.39S36.75 and Sn1.24Cu65.17S33.59, which are near to the nominal stoichiometries of Sn0.01Cu1.79S and Sn0.03Cu1.77S, respectively.
SEM images of p-type polycrystalline Sn0.01Cu1.79S (a) showing the elemental distribution for Cu, S, and Sn, (b) showing the elemental distribution for Cu, (c) showing the elemental distribution for S, (d) showing the elemental distribution for Sn, (e) showing the elemental distribution map for Sn0.01Cu1.79S and its stoichiometry.

SEM images of p-type polycrystalline Sn0.03Cu1.77S (a) showing the elemental distribution for Cu, S, and Sn, (b) showing the elemental distribution for Cu, (c) showing the elemental distribution for S, (d) showing the elemental distribution for Sn, (e) showing the elemental distribution map for Sn0.03Cu1.77S and its stoichiometry.

B. Thermoelectric properties
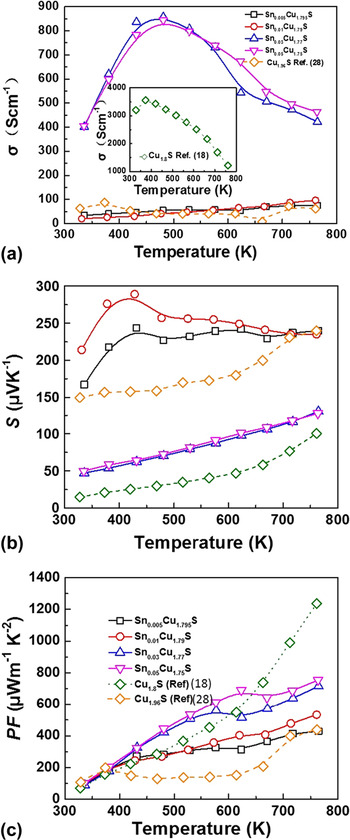
Figure 5(a) illustrates the temperature dependence of σ for the Sn x Cu1.8−x S (x = 0.005–0.05) bulk material. For the pure Cu1.8S sample, the σ was initially 3560 S/cm and decreased to 1220 S/cm with increasing temperature, showing a turning point of the σ. The appearance of the turning point at 373 K for the pure Cu1.8S, which was sintered at 773 K, can be explained by the phase change, where Cu ion positions were changed. Reference Ge, Liu, Feng, Lin and He26 For the Sn0.03Cu1.77S and Sn0.05Cu1.75S samples, the values of the σ were initially 401 S/cm and 405 S/cm, respectively, due to the main phase of them is Cu1.8S (as shown in Fig. 1), the temperature dependences of the transport behavior is similar to the pure Cu1.8S sample. However, because of the second phase and nano pores scattering the value of the samples x = 0.03 and x = 0.05 are much lower than that of pure Cu1.8S sample. Reference Ge, Liu, Feng, Lin and He26 The σ decreased to 33–74 S/cm, 19–96 S/cm in the whole temperature range for the x = 0.005, 0.01, respectively, due to the main phase of them is Cu1.96S (as shown in Fig. 1), the temperature dependences of the transport behavior are similar with the pure Cu1.96S sample. The two samples x = 0.03 and x = 0.05 have a relatively high σ due to the high electrical impurities of Cu1.8S and Cu4SnS4. Cu4SnS4 is a p-type semiconductor with an σ of 70 S/cm at room temperature. Reference Zhao, Zhang, Liu, Zhang and Li27 The x = 0.01 sample got the lowest electrical conductivity (19 S/cm) because of the low σ of Cu1.96S Reference Zheng, Zhang, Li, Pei and Yu28 matrix and the second phase of Cu2SnS3. Cu2SnS3 has been reported as a solar energy material with an σ of 0.5 S/cm. Table I shows carrier concentration and carrier mobility of all Sn x Cu1.8−x S bulk samples at room temperature. With the increasing Sn concentration, the carrier concentration of the bulk samples decreased due to increased impure contents. However, the mobility of the samples linearly increases with increasing Sn contents due to the increased Cu vacancies. In this work, we supposed that the Sn will occupy the Cu site, the Cu content was therefore reduced when preparing the sample. But the Sn become the second phases and leaving the increased Cu vacancies with increasing Sn content. Cu1.8S is a kind of superionic conductor in which Cu ions have a large mobility in the lattice as in liquid electrolytes and the main carrier is hole. The hole concentration and hole mobility appear to be closely related to an excessive number of available sites. Reference Mansour13 With the increasing Cu vacancies, the mobility of the samples increased. According to the formula σ = neμ, where n is the carrier concentration and μ is the carrier mobility, the electrical conductivity of the sample decreased with increasing Sn content at room temperature, just as shown in Fig. 5(a).
The temperature dependence of (a) electrical conductivity, (b) the Seebeck coefficient, and (c) power factor for each bulk sample.

Carrier concentration and carrier mobility of Sn x Cu1.8−x S at room temperature.

Figure 5(b) shows the temperature dependence of the S for Sn x Cu1.8−x S (x = 0.005–0.05). The positive values of the S indicate that all the samples are p-type semiconductors. The S of sample is inverse to σ. S ≈ γ − ln n, where γ and n are scattering factor and carrier concentration. The absolute values of the S for pure Cu1.8S are 14–100 μV/K. The second phase also affects the S of the samples significantly. For the sample Sn0.03Cu1.77S and Sn0.05Cu1.75S, the main phase is Cu1.8S, because of the second phase Cu2SnS3, the S were improved to 50–125 μV/K. The Sn0.005Cu1.795S and Sn0.01Cu1.79S samples have the higher S of 243 μV/K and 289 μV/K, respectively, at 423 K, due to the matrix of Cu1.96S and scattering effect of Cu4SnS4. The S values of Sn0.005Cu1.795S and Sn0.01Cu1.79S samples are higher than that of Cu1.96S samples due to the exist of the second phase in the matrix. Besides the effects of porosity and impurity phase on S of the sample, the main phase also affects the S of the sample. The main phase of Sn0.03Cu1.77S sample is Cu1.8S, which has a low S. However, the main phase of Sn0.01Cu1.79S is Cu1.96S, which has a high S compared to Cu1.8S. It is therefore, even the Sn0.03Cu1.77S sample has more porosity and impurity but the lower S compared to Sn0.01Cu1.79S. Figure 5(c) indicates the temperature dependence of the PF (PF = S 2σ) for Sn x Cu1.8−x S with different Sn contents. Reference Ge, Zhang, Shang, Yu, Chen and Li29 The PF of the pure Cu1.8S sample is 70 μW/(m K2) at 323 K and increases to 1237 μW/(m K2) with temperatures increasing to 773 K. All the samples show a similar positive-temperature dependence of PF, while having different slopes. The Sn0.05Cu1.75S sample shows a higher PF than other samples at high temperatures, and has a maximum value of 755 μW/(m K2) at 773 K.
Figure 6 shows the temperature dependence of thermal transport properties for Sn x Cu1.8−x S with different Sn contents, in which the κ value was calculated from the thermal diffusivity (D), the heat capacity (C p, C p values of all samples are shown in Fig. S1), and the density (d), and κ = DC p d. The lattice thermal conductivity has been evaluated and shown in Fig. 6(b) by using κl = κ − κc, where, κl, κ, and κc are lattice thermal conductivity, total thermal conductivity, and carrier thermal conductivity, respectively, κc = LσT, where L, σ, T is Lorenz number (The value of L was shown in Fig. S2), electrical conductivity, and temperature, respectively. Temperature dependence of κc of all the sample were shown in Fig. 6(a), which is highly dependent on the electrical conductivity. The calculated κl data were shown in Fig. 6(b), for Sn0.005Cu1.795S and Sn0.01Cu1.79S samples, the κl is from 0.6 to 0.4 W/(m K) in the entire temperature range, and the κl of Sn0.01Cu1.79S sample is lower than that of the Sn0.005Cu1.795S due to the higher second phase contents and lower relative density. For Sn0.03Cu1.77S and Sn0.05Cu1.75S samples, the κl is from 0.8 to 0.2 W/(m K) across the whole measured temperature range of 323–773 K, and the κl value of Sn0.05Cu1.75S is lower than that of the Sn0.03Cu1.77S due to the high Sn contents which introduced more second phases and the more pores in the matrix. The total thermal conductivity (κ) was shown in Fig. 6(c), the κ value of pure Cu1.8S decreased from 4.8 to 1.9 W/(m K) from 323 to 773 K. Reference Ge, Zhang, Yu, Liu and Li18 And the κ value of pure Cu1.96S decreased from 0.54 to 0.48 W/(m K) from 323 to 773 K. Reference Zheng, Zhang, Li, Pei and Yu28 The κ of Sn0.005Cu1.795S and Sn0.01Cu1.79S samples decreased to 0.51 W/(m K) and 0.50 W/(m K), respectively, at 773 K due to low electrical conductivity, which led to low κc. Because of the formation of both the second Cu2SnS3 phase (Fig. 1) and pores (Fig. 2), the Sn0.03Cu1.77S and Sn0.05Cu1.75S samples achieved a low κ that is commonly below 1.7 W/(m K) at all temperature intervals. Because of the formation of both the second Cu4SnS4 phase (Fig. 1) and the porous microstructure (Fig. 2), the Sn0.005Cu1.795S and Sn0.01Cu1.79S samples achieved very low κ [0.4–0.6 W/(m K)] over the measured temperature range.
The temperature dependence of (a) carrier thermal conductivity (b) lattice thermal conductivity, and (c) total thermal conductivity for each bulk sample.

The temperature dependence of ZT calculated by the expression ZT = S 2σT/κ is shown in Fig. 7. All the Sn x Cu1.8−x S samples showed an enhanced ZT value with rising temperatures, which is owed to the decreased κ [Fig. 6(c)]. The ZT value also increased with rising sintering temperatures, therefore the Sn0.01Cu1.79S samples at 773 K obtained the maximum ZT value of 0.81 due to its high S and very low κ, which is 1.6-fold higher than that of a pristine Cu1.8S sample and is 1.28-fold higher than that of a pristine Cu1.96S sample. The circle measurements of electrical conductivity, thermal diffusivity, and Seebeck coefficient for the sample Sn0.01Cu1.79S are displayed in Fig. 8. The results reveal that Sn0.01Cu1.79S shows quite good repeatability for the electrical conductivity, Seebeck coefficient and thermal diffusivity during the repeated heating and cooling processes below the temperature of 773 K.
The temperature dependence of the ZT value for each bulk sample.

Temperature dependence of the electrical conductivity, thermal diffusivity, Seebeck and specific heat for the fabricated Sn0.01Cu1.79S polycrystalline bulks: (a) electrical conductivity, (b) thermal diffusivity, and (c) Seebeck coefficient. For each sample, we measured six times with three heating and three cooling processes.

Fig. S3 shows the Vickers hardness values of the Sn x Cu1.8−x S (x = 0.005, 0.01, 0.03, and 0.05) polycrystalline bulks. The Vickers hardness values of several other thermoelectric materials are also presented for comparison. Reference Zhao, Wang, Fei, Wang and Cheng30 It was reported that hot-pressed polycrystalline Cu2−x Se, Reference Zhao, Zhang, Li, Zhou, Liu and Liu31 Bi2Te3, Reference Zhao, Zhang, Li, Zhou, Liu and Liu31 and PbTe Reference Gelbstein, Gotesman, Lishzinker, Dashevsky and Dariel32 bulks show hardness of around 0.62, 0.46, and 0.40 GPa, respectively. Compared to the Cu2−x Se polycrystalline bulks having hardness of around 0.46 GPa, the Sn x Cu1.8−x S bulks exhibit much higher hardness, with values of 0.64 GPa for the Sn0.005Cu1.795S, 0.63 GPa for the Sn0.01Cu1.79S, 0.58 GPa for the Sn0.03Cu1.77S, and 0.56 GPa for the Sn0.05Cu1.75S, respectively. The above results indicate that the Cu2−x S have a good mechanical property for being fabricated to devices.
IV. CONCLUSIONS
The Sn x Cu1.8−x S bulk materials were fabricated by MA and SPS. The electrical transport properties and κ of all the bulk samples were examined over the temperature range of 323–773 K. As a potential TE material, the properties of Cu1.8S were enhanced by Sn addition, which serves to optimize carrier concentration by introducing a second phase and introducing nanopores to reduce κ. The κ of all Sn doped samples ranged from 0.30 to 1.7 W/(m K). The highest ZT value reached about 0.81 at 773 K for the Sn0.01Cu1.79S sample. The present results confirmed that the thermoelectric properties of Cu1.8S-based materials could be significantly improved by adding Sn in a Cu1.8S compound.
Supplementary Material
To view supplementary material for this article, please visit https://doi.org/10.1557/jmr.2017.288.
ACKNOWLEDGMENT
This work was supported by the National Natural Science Foundation of China (Grant No. 51501086).