


Introduction
Ice wedges and polygons are characteristic features of the periglacial landscape. Ice wedges are massive, generally wedge-shaped bodies of ground ice with their apexes pointing downward, composed of foliated or vertically banded ice (Canada: National Research Council, 1988). They form in thermal contraction cracks in continuous permafrost regions when the mean annual air temperature is lower than –6˚C. The ice-wedge growth mechanism results from the annual filling of frost cracks in frozen ground with ice, over a long period of time (Reference LachenbruchLachenbruch, 1966; Reference MackayMackay, 1974, Reference Mackay1975, Reference Mackay1986; Reference Harris and FrenchHarris, 1982). In many cases, growth has extended throughout the Holocene, and ice wedges therefore represent archives for palaeoclimatic and palaeoenvironmental investigations. Polygons and ice wedges in arctic and subarctic areas have been studied intensively since the beginning of the last century (Reference Leffingwell and deLeffingwell, 1915), and much literature exists on this topic (Reference FrenchFrench, 1996). In Antarctica, polygons, ice and sand wedges are common throughout southern Victoria Land. In the Dry Valleys and in the McMurdo area they were first studied by Péwé (1959), Reference Black and BergBlack and Berg (1963, Reference Black, Berg and Adie1964, Reference Black and Berg1966), Reference Black and BergBerg and Black (1966), Reference Black, Fahey and ThompsonBlack (1973 a, Reference Blackb) and Reference Ugolini, Bockheim and AndersonUgolini and others (1973). They also occur in the Antarctic Peninsula (Reference Kato, Corte and FukudaKato and others, 1990; Reference Fukuda, Strelin, Shimokawa, Takahashi, Sone, Trombotto, Yoshida, Kaminuma and ShiraishiFukuda and others, 1992; T. Koizumi and M. Fukuda, unpublished information).
In northern Victoria Land the presence of ice-wedge polygons was recognized by Reference Baroni and OrombelliBaroni and Orombelli (1988), Reference BaroniBaroni (1989) and Reference ChinnChinn (1991). Reference FrenchFrench and Guglielmin (2000), in their studies on frozen-ground phenomena in the Northern Foothills, reported the existence of small ice wedges on Mount Browning. More recently the widespread presence of ice wedges in a vast area of northern Victoria Land was identified by Reference RaffiRaffi (2003), during the 1998/99 and 2000/01 field seasons.
The Pain Mesa ice wedges in northern Victoria Land represent the highest in altitude and the most inland in the Terra Nova Bay area. In this paper, the morphological features of an ice wedge of Pain Mesa are defined, and texture and fabrics of ice crystals determined. Oxygen (δ18O) and hydrogen (δD) isotope compositions and the tritium activity on the ice samples of the wedge were analyzed, as well as chemical determinations of both major cations and anions.
The aim of the study was to define the wedge growth mechanism, the origin of the ice forming the wedge and to establish whether the growth processes are still active under present climatic conditions.
Study Area
The investigated area is located at about 2200ma.s.l., 8.5 km to the north of Mount Masley, in the uppermost part of Pain Mesa that forms the northern sector of the Mesa Range (Fig. 1). No automatic weather stations are close to the studied area. The average annual temperature value of –28.5˚C is obtained using the equation T (˚C) = –0.005h – 17.5, where h is the elevation in metres (Reference StenniStenni and others, 2000). This equation defines the lapse rate for the mountain areas of Victoria Land. Southerly katabatic winds blow in the Rennick Valley, inducing deflation and ablation, as indicated by both the aeolian morphologic features and the presence of blue-ice areas in the Mesa Range (Reference FrezzottiFrezzotti, 1998). For the upper Rennick sector the long-term mean accumulation rate may be considered 105 mmw.e. a–1 (Reference StenniStenni and others, 2002). The assessment of ground temperatures may be only speculative for the investigated site and is based on the data of the permafrost automatic monitoring stations located in the Wright Valley (Reference Thompson, Craig and BromleyThompson and others, 1971a, Reference Thompson, Bromley and Craigb) and in the Northern Foothills (Reference GuglielminGuglielmin and Dramis, 1998). At these stations, the respective ground temperatures at 300 cm depth drop to –27˚C and –24˚C in winter, and rise to about –12˚C and –9˚C in summer. The mean annual air temperature is –20˚C at Vanda station, Wright Valley, and –14.7˚C at Terra Nova Bay Station, Northern Foothills.
Location of the study area. Satellite image by Programma Nazionale di Ricerche in Antartide (PNRA) Remote Sensing Support Group.

Methods
Ice-wedge field survey
The characteristics of an ice wedge were studied using a jackhammer to excavate the frozen ground, in an interpolygon trough to a depth of up to 0.70–0.80 m. The ice was sampled by inserting an ice screw, with an internal diameter of 14mm, into the ice wedge in vertical sequences and parallel to the axial plane (Reference LewkowiczLewkowicz, 1994). Oriented block samples of ice for thin sections were taken from the centre to the sides, and from the top to the apex of the ice wedge. Temperature measurements in the ice-wedge core holes were performed in a vertical sequence during excavation. An electronic thermometer connected to a penetration probe with a Pt100 (platinum) sensor was used. Thermometer and probe accuracy were respectively ±0.2˚C and Class A.
Some physical parameters were measured in repeated series during the excavation of the section: air temperature, soil surface temperature and irradiance by a radiometric probe with a spectral measurement range of 450–950 nm.
Petrographic analyses
Petrographic analyses were made on thin sections from five oriented block samples. Eighteen horizontal and vertical thin sections, normal and parallel to the wedge axial plane, were prepared and examined under single- and cross-polarized light to determine crystal size, shape, c-axis orientation and gas inclusions by means of a Universal Stage (Reference LangwayLangway, 1958). Fabric diagrams of crystal c-axis distribution were plotted as lower-hemisphere projections on a Schmidt equal-area net, according to Reference Salvini, A. and WiseSalvini and others (1999).
Isotopic analyses
Measurements of δ18O and δD (where δ18O or δD = {[(18O/16O)sample/(18O/16O)V-SMOW] – 1}×1000) were made using the CO2/H2 water equilibration technique by means of an automatic equilibration device on line with the mass spectrometer, with an analytical precision better than ±0.05‰ and ±0.7‰ for δ18O and δD respectively. The δ18O and δD measurements were performed on the same water aliquot. Tritium analyses were carried out by direct liquid scintillation counting using a 1220 Quantulus apparatus. Tritium values are given in tritium units (TU) where 1 TU corresponds to T/H=10–18. Errors range from 2 TU (2σ) at the background level to 4TU at the level of 35 TU.
Chemical analyses
Ice samples were melted under a laminar-flow hood and filtered on 0.45μm mixed cellulose ester membrane filters (filter HA Millipore, MA, USA) before inorganic ion analyses were performed. Cations (Na+, NH4 +, K+, Mg2+ and Ca2+) were determined using air–acetylene-flame atomic absorption spectrometry (Perkin-Elmer 3300), after addition of a lanthanum solution (5 g L–1) as interference suppressant for Ca and Mg determinations. Anions (Cl–, NO3 – and SO4 2–) were separated on an IonPac AS4A column (1.8mM Na2CO3/1.7mM NaHCO3, 2 mL min–1), with an IonPac AG4A precolumn, using a Dionex 2000i ion chromatograph equipped with an ASRS-ultra (4mm) anion self-regenerant suppressor and a CDM-II conductivity detector.
Results and Discussion
Morphological features of the ice wedge
The ice wedge was found on a slightly sloping bench facing north, at about 2200ma.s.l. (Reference Raffi, Stenni, Flora, Polesello and CamussoRaffi and others, 2003). This altitude is below a well-defined erosional trimline that in this sector of Pain Mesa is at 2380ma.s.l. (Reference Denton, Bockheim, Wilson, Schluchter and StumpDenton and others, 1986). A volcanic regolith covered the bench; it was arranged in a superficial pattern mainly characterized by orthogonal and pentagonal polygons (Fig. 2). They were 6–10m wide and bordered by shallow inter-polygon troughs, 0.2–0.4m deep and 0.40–0.50m wide. The inter-polygon troughs were occupied by a concentration of openwork matrix of coarse angular clasts. The deflation pavement of polygons was composed of angular clasts of the Kirkpatrick Basalt (Reference Elliot, Siders, Haban and StumpElliot and others, 1986) in the range of decimetres, supported by dry, very fine, loose sandy-silt matrix, yellowish brown (10 YR 5/4) in colour. Smaller clasts in the centimetre and decimetre range were embedded in the matrix. The soil surface was similar in colour to the one examined by Reference Denton, Bockheim, Wilson, Schluchter and StumpDenton and others (1986) in the same area of Pain Mesa.
Oblique air view of frost-fissure polygons developed on volcanic regolith at Pain Mesa, Mesa Range, Rennick Valley. Polygons show either orthogonal or pentagonal forms. Snow highlights the inter-polygon furrows. Arrow indicates the location of the ice wedge. Photograph by R. Raffi, 30 January 2001.

In the excavated section, the frost table was 10–13cm deep. Permafrost was rich in structureless ice cement (Reference FrenchFrench, 1996) containing many air bubbles. The ice wedge was found at 13cm depth from the ground surface, being 35 cm wide at the top and > 50 cm long (Fig. 3). The ice wedge was milky white in colour, free of sediments and with numerous clearly visible, oriented gas inclusions forming vertical bands. Foliations were well developed along the bottom of the wedge and parallel to the sides, suggesting an epigenetic origin of the wedge. A vertical fissure, 2 –3 mm wide, filled with small loose ice grains, was present in the centre. The size of the ice wedge matches with the size of the ice wedges located in southern Victoria Land (Berg and Black, 1966), at Mount Browning in the Terra Nova Bay region (Reference FrenchFrench and Guglielmin, 2000), as well as of some of those located in northern Victoria Land (Reference RaffiRaffi, 2003). All are formed in deposits of different origin. Compared with the ice wedges occurring in bedrock in Seymour Island, Antarctic Peninsula, studied by T. Koizumi and M. Fukuda (unpublished information) and Reference Kato, Corte and FukudaKato and others (1990), the Pain Mesa ice wedge was similar in width but was much shallower (about two-thirds of the depth of other wedges). –21˚C wind-chill factor). These temperature differences between soil surface and air close to the ground denote thermal gradients of a maximum of 18.3˚C. Reference Black and BergBlack and Berg (1963), in their studies on the hydrothermal regime of patterned ground on Ross Island and in Taylor Valley, ascribed a fundamental role to high thermal gradients, coupled with vapour-pressure gradients, in the moisture transfer in and out of contraction cracks and in the formation of hoar-frost crystals during the winter. The presence of hoarfrost crystals may have had a relevant role in the growth process of the Pain Mesa wedge, as highlighted by the stable-isotope data (see below: Stable-isotope and tritium activity).
Top view and cross-section of the Pain Mesa ice wedge. The ice wedge was >50 cm long and 35 cm wide at the top. (a) Position of ice samples within the wedge (PM = Pain Mesa): PM1–5 are samples for chemical analyses; PM6–20 are samples for isotopic analyses. (b) Schematic sketch of the ice wedge; x: frost table; y: frost crack. Photograph by R. Raffi, 30 January 2001.

Temperature inside the wedge ranged from –5.0˚C to –8.6˚C at 3 and 50cm respectively from the ice-wedge top. During the survey, soil surface temperature ranged from –3.5˚C to +9.0˚C respectively: between 1100 h, with –12.0˚C air temperature (455Wm–2 incident solar radiation, clear sky, –30˚C wind-chill factor) and 1420 h with –9.3˚C air temperature (680Wm–2 incident solar radiation, clear sky, –2.1˚C
Texture and fabrics of ice crystals
Ice-crystal petrographic characteristics of ice wedges and massive ice have been studied since the second half of the last century in the Arctic, and they are well documented in the literature (Reference BlackBlack, 1951, Reference Black1953, Reference Black, Fahey and Thompson1978; Reference CorteCorte, 1962; Reference ShumskiiShumskii, 1964; Reference GellGell, 1978a, Reference Gellb; Reference French and PollardFrench and Pollard, 1986; Reference French and HarryFrench and Harry, 1988; Reference Harry, French and PollardHarry and others, 1988; Reference Pollard, Dallimore and SennesetPollard and Dallimore, 1988). According to the literature, optic axis lineations, recrystallization and grain growth are the result of temperature gradients and lateral stress. In this paper, petrologic analysis was performed in order to verify the existence of variations in texture and fabrics across the Pain Mesa wedge.
Vertical thin sections, both normal and parallel to the wedge axial plane, yielded the most information. Vertical sections displayed larger crystal dimensions and predominantly subhedral shapes, while horizontal thin sections displayed smaller crystal dimensions and predominantly anhedral shapes. The ice crystals were predominantly elongated in vertical thin sections (Fig. 4a). The average crystal size is 11–37mm2, with average lengths of 4–16 mm. A slight decrease in crystal sizes was observed from the centre toward the boundaries of the wedge. Crystal dimensions and their fall in size match well with measurements by Reference GellGell (1978b) on the large ice wedges in the Tuktoyaktut Peninsula–Mackenzie Delta area (12–30mm2), and are a little larger than those measured by Reference Pollard, Dallimore and SennesetPollard and Dallimore (1988) at King Point East (7–15mm2).
Vertical thin section cut parallel to the wedge axial plane from sample PM5 (a) under crossed polaroids, and (b) under single polaroid.

All the examined sections contained myriads of elongated, rounded or irregular gas inclusions, most of which were 0.5–2.0mm long. Sediment inclusions were absent. Gas inclusions are both intra-crystalline and inter-crystalline. Vertical lineation of bubbles was evident in vertical thin sections cut parallel to the wedge axis (Fig. 4b), and produced the vertically foliated appearance observed in the field.
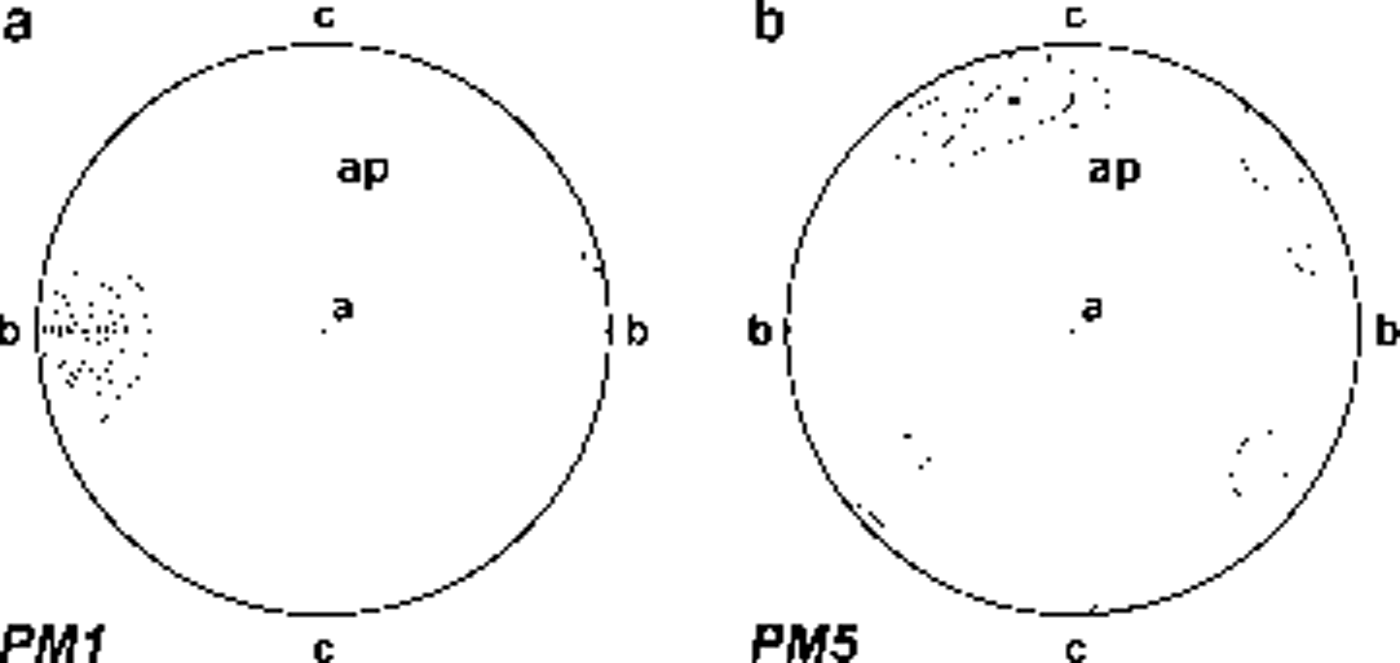
Fabric diagrams for crystals at the centre and boundaries of the wedge highlighted different c-axis orientations. A preferred horizontal to sub-horizontal orientation normal to the axial plane was found in the middle and in the upper part of the wedge, with crystal basal planes tendentially parallel to the axial plane (Fig. 5a). A preferred vertical orientation of the c axis was found at the wedge boundaries (Fig. 5b), denoting a rotation of crystals from the centre towards the sides.
Fabric diagrams of ice-wedge ice: (a) sample PM1, 36 crystals; (b) sample PM5, 39 crystals. Diagrams in vertical plane parallel to axial plane. a is normal-direction ice at wedge centre, b is parallel-direction ice at wedge boundary, c is vertical direction and ap is axial plain. Fabric diagrams are plotted as lower-hemisphere projections on a Schmidt equal-area net. Contours at intervals of 5%, 15%, 25%, 35%, 45%, 55%.
Stable-isotope and tritium activity
Recently, oxygen and hydrogen isotopes and tritium analyses were performed on large ice wedges in northern Siberia (Reference Dereviagin, Chizov, Hubberten and SimonovDereviagin and others, 2002; Reference Meyer, Dereviagin, Siegert, Schirrmeister and HubbertenMeyer and others, 2002a, Reference Meyer, Dereviagin, Siegert and Hubbertenb). In Antarctica, by contrast, isotopic studies on ice wedges are quite rare.
Co-isotopic (δ18O and δD) studies are necessary and widely used in order to determine whether melting– refreezing processes have affected a ground ice body (i.e. Reference Souchez and JouzelSouchez and Jouzel, 1984; Reference Souchez, Jouzel, Lorrain, Sleewaegen, Stievenard and VerbekeSouchez and others, 2000). Ice samples subjected to melting, without isotopic fractionation, and subsequent refreezing with isotopic fractionation, align on a straight line with a lower slope (called ‘freezing slope’) than that of the meteoric water-line (MWL; δD=8δ18O + 10; Reference DansgaardDansgaard, 1964) on which glacier ice samples originating from precipitation align. The initial liquid corresponds to the intersection between the two straight lines (Reference Jouzel and SouchezJouzel and Souchez, 1982; Reference Souchez and JouzelSouchez and Jouzel, 1984). In addition, the co-isotopic analysis allowed us to calculate the deuterium excess, which is defined as follows: d = δD–8δ18O (Reference DansgaardDansgaard, 1964). This second-order parameter is mainly dependent on the climatic conditions (sea surface temperature, relative humidity and wind speed) in the precipitation source regions (Reference Merlivat and JouzelMerlivat and Jouzel, 1979).
Co-isotopic (δ18O and δD) studies are necessary and widely used in order to determine whether melting– refreezing processes have affected a ground ice body (i.e. Reference Souchez and JouzelSouchez and Jouzel, 1984; Reference Souchez, Jouzel, Lorrain, Sleewaegen, Stievenard and VerbekeSouchez and others, 2000). Ice samples subjected to melting, without isotopic fractionation, and subsequent refreezing with isotopic fractionation, align on a straight line with a lower slope (called ‘freezing slope’) than that of the meteoric water-line (MWL; δD=8δ18O + 10; Reference DansgaardDansgaard, 1964) on which glacier ice samples originating from precipitation align. The initial liquid corresponds to the intersection between the two straight lines (Reference Jouzel and SouchezJouzel and Souchez, 1982; Reference Souchez and JouzelSouchez and Jouzel, 1984). In addition, the co-isotopic analysis allowed us to calculate the deuterium excess, which is defined as follows: d = δD–8δ18O (Reference DansgaardDansgaard, 1964). This second-order parameter is mainly dependent on the climatic conditions (sea surface temperature, relative humidity and wind speed) in the precipitation source regions (Reference Merlivat and JouzelMerlivat and Jouzel, 1979).
Co-isotopic (δ18O and δD) studies are necessary and widely used in order to determine whether melting– refreezing processes have affected a ground ice body (i.e. Reference Souchez and JouzelSouchez and Jouzel, 1984; Reference Souchez, Jouzel, Lorrain, Sleewaegen, Stievenard and VerbekeSouchez and others, 2000). Ice samples subjected to melting, without isotopic fractionation, and subsequent refreezing with isotopic fractionation, align on a straight line with a lower slope (called ‘freezing slope’) than that of the meteoric water-line (MWL; δD=8δ18O + 10; Reference DansgaardDansgaard, 1964) on which glacier ice samples originating from precipitation align. The initial liquid corresponds to the intersection between the two straight lines (Reference Jouzel and SouchezJouzel and Souchez, 1982; Reference Souchez and JouzelSouchez and Jouzel, 1984). In addition, the co-isotopic analysis allowed us to calculate the deuterium excess, which is defined as follows: d = δD–8δ18O (Reference DansgaardDansgaard, 1964). This second-order parameter is mainly dependent on the climatic conditions (sea surface temperature, relative humidity and wind speed) in the precipitation source regions (Reference Merlivat and JouzelMerlivat and Jouzel, 1979).
The δ18O, δD and d values obtained from the analyses of the ice-wedge samples are reported in Table 1. These data differ from precipitation values expected for this elevation (about 2200 ma.s.l.); values around –35‰ and –270‰ could be assumed for present-day precipitation in this area, for δ18O and δD respectively (Reference StenniStenni and others, 2000). In contrast, all Pain Mesa ice-wedge samples are less negative and show highly negative d excess values. Normally, d values for present-day snowfalls range from 2‰ to 18‰ in East Antarctica (Reference Petit, White, Young, Jouzel and KorotkevichPetit and others, 1991).
δ18O, δD, d and tritium activity data from Pain Mesa ice-wedge samples

The obtained results, reported on a δ18O–δD diagram (Fig. 6), lie below the MWL. We did not calculate the regression line because of the limited number of co-isotopic data. However, the large difference found between the ice-wedge and the expected local precipitation isotopic values is far higher than the isotope enrichment factor expected after a freezing process. This suggests that a melting–refreezing process, at least starting from local snowfalls, does not explain the isotopic composition of the Pain Mesa ice wedge.
δ18O–δD diagram for the ice-wedge samples (open circles) from Pain Mesa. The solid line refers to the MWL for global precipitation.

Taking into account a sublimation process to explain these high isotopic values, we must consider the following: (1) As shown by Reference Moser, Stichler, Fritz and FonteMoser and Stichler (1980), isotope fractionation is not normally observed during melting or sublimation of glacier ice, but if the solid phase is in the form of porous firn, snow or hoar-frost, a kinetic fractionation will occur. (2) The sublimated samples will align along a straight line with a slope lower than that of the MWL. This ‘snow/hoar-frost’ sublimation process would also explain the highly negative d excess values obtained from the ice-wedge samples. Another possible explanation for the shift in the isotopic values has been reported by Reference Dereviagin, Chizov, Hubberten and SimonovDereviagin and others (2002) and Reference Meyer, Dereviagin, Siegert, Schirrmeister and HubbertenMeyer and others (2002a) in the case of northern Siberia ice wedges, and is related to sublimation of ice occurring in an open frost crack during the cold period. This hypothesis is based on the presence of a quasi-liquid film on the ice surface.
The tritium analysis is a widely used tool for examining whether ice wedges have been active in recent decades (Reference BurnBurn, 1990). Tritium, the radioactive isotope of hydrogen with a half-life of 12.43 years, is produced naturally by the interaction of cosmic radiation with the atmosphere where it enters the hydrological cycle after being oxidized to tritiated water (HTO). During the early 1950s and 1960s, thermonuclear atmospheric bomb tests emitted large amounts of artificial radionuclides (particularly from 1952 to 1962) into the atmosphere worldwide. Fallout of radionuclides following these periods produced remarkably high concentrations of artificial tritium in atmospheric precipitation. Reference Jouzel, Merlivat, Pourchet and LoriusJouzel and others (1979) found that tritium contents in the South Pole firn peaked in 1966. Nowadays, the values of tritium contents observed in the firn layers of northern Victoria Land for the 1965/66 peak range from about 50 to 110TU (Reference StenniStenni and others, 2002; Reference Flora, Genoni, Stenni, Proposito and FrezzottiFlora and others, 2003). By contrast, the values observed in present-day precipitation range from 10–20TU for coastal sites to 30–35TU for inner sites (Reference PropositoProposito and others, 2002).
The tritium activity data reported in Table 1 show low values (near the detection limit) except for sample PM8, which has the highest value (14.2 TU), and samples PM15, PM18 and PM20 (Fig. 3). Their values may be considered in the range of those found in present-day precipitation at coastal sites (Reference PropositoProposito and others, 2002). These samples are located in the upper part and in the centre of the ice wedge, and can be ascribed to contamination of the ice with present-day precipitation or atmospheric moisture. In fact, ice-wedge growth occurs in the centre, with ice filling the upper part of the open fissure.
Chemical concentrations
High concentrations of major ions have been measured in six samples collected from the ice wedge (Fig. 3), as shown by conductivity values ranging from 657 to 1929 μS cm–1 (Table 2). With regard to the total ionic content, expressed as calculated conductivity, samples can be divided into two groups: samples PM1bis, PM3 and PM5, located in a horizontal transect in the upper part of the ice wedge, are characterized by higher values of conductivity than samples PM1, PM2 and PM4, which represent a vertical transect in the central part of the ice wedge. A substantial homogeneity of ion concentrations with depth can be inferred from the data, with the exception of the upper part, where ions, especially calcium and sulphate, accumulate.
Major-ion concentrations in ice samples from the ice wedge
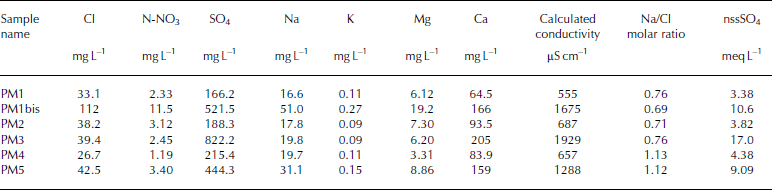
Calcium and sulphate represent 70–90% of the total ion content in all samples, and achieve maximum concentrations of 205 and 486 mg L–1 respectively. Their presence at a very high concentration can be attributed to gypsum deposits, common in soils of high-elevation areas of the Transantarctic Mountains (Reference Campbell and ClaridgeCampbell and Claridge, 1987). The origin of sulphate in high inland Antarctic soils is still controversial but, from 17O isotopic studies (Reference Bao, Campbell, Bockheim and ThiemensBao and others, 2000), the most probable source is the atmospheric oxidation of reduced gaseous sulphur compounds. This source led to very small concentrations of sulphur compounds during internal deposition, so the high sulphate concentrations measured in the ice wedge can only be explained by the concomitant mechanisms of ion concentration (e.g. evaporation or sublimation) and gypsum precipitation that occurred during the formation of the ice wedge. Calcium, together with magnesium and sodium, have weathered from ferromagnesian minerals in the Ferrar Dolerites, as suggested by the very high Ca2+/K+, Mg2+/K+ and Na+/K+ ratios (Reference Campbell and ClaridgeCampbell and Claridge, 1987).
Another peculiarity of these ice-wedge samples is the high value of nitrate concentrations, which are generally much higher than those measured in other ice wedges analyzed by our group (Polesello, unpublished results), at lower altitudes and smaller distances from the Terra Nova Bay coastal area. In fact, as reported by Reference Campbell and ClaridgeCampbell and Claridge (1987), nitrate concentrations in soils increase with increasing distance from the coast. Nitrate concentrations in the Pain Mesa ice wedge are also higher than those reported by Reference Kato, Corte and FukudaKato and others (1990) for an ice wedge in Seymour Island, Antarctic Peninsula. In the latter case, high ionic concentrations have been attributed to repeated cycles of melting and evaporation during ice-wedge formation.
Conclusion
The observed variations in fabrics and textures across the wedge, similar to the Arctic wedges, were the result of recrystallization and grain growth under a horizontal stress field and a high temperature gradient. The presence of a vertical open crack in the centre of the ice wedge, and the tritium activity value obtained for the ice sample located in the upper part and in the centre of the ice wedge indicate that the growth process is still active under the present climatic conditions.
Ionic ratios in ice-wedge samples reflect the typical salt distribution of a weathered soil in this elevated trans-Antarctic area. Nevertheless, the absolute high concentrations of some ionic compounds, such as sulphate, calcium and nitrate, can only be explained if a concentration process, such as evaporation or sublimation, was active during the ice-wedge formation.
The stable-isotope analyses of the ice samples suggest that sublimation processes of a porous medium (snow and/or hoar-frost) seem to have occurred during the growth of the ice wedge. A high temperature gradient between low air temperature and higher permafrost temperature, thin or absent snow cover, low humidity, and open cracks during winter are factors which may control the sublimation processes, as also highlighted by the isotope analyses of northern Siberia ice wedges (Reference Dereviagin, Chizov, Hubberten and SimonovDereviagin and others, 2002; Reference Meyer, Dereviagin, Siegert, Schirrmeister and HubbertenMeyer and others, 2002a). In addition to all these factors, strong katabatic winds acting in the Mesa Range area may enhance sublimation.
The sublimation phenomena highlighted in the formation of the ice wedge considered in the present study should be checked at other sites in northern Victoria Land where ice wedges have been found. Stable-isotope and tritium activity measurements should be carried out in order to enhance our understanding of ice-wedge growth processes, ideally also in other environmental settings. At the present time, the scarcity of isotopic data regarding ice wedges in Antarctica, and the special conditions of this site prevent the extension of the conclusions to other geographical areas.
Acknowledgements
This research was carried out within a Project on Glaciology of the Italian PNRA and was financially supported by Ente per le Nuove Tecnologie, l’Energia e l’Ambiente (ENEA) through a cooperation agreement with the Università degli Studi di Milano Bicocca. Thanks are due to H. M. French and A. G. Lewkowicz (University of Ottawa) for their valuable suggestions for the field investigation, and to G. Orombelli (Università di Milano Bicocca) and F. Dramis (Università Roma Tre) for their encouragement and support. Thanks are also due to the guide Warrant Officer R. Guadagnin (Scuola Militare Alpina di Aosta) for his assistance and active participation in the fieldwork, to E. Selmo (Università di Parma) and to L. Genoni (Università di Trieste) for the isotopic analyses, to M. Filipazzi (Università di Milano Bicocca) for the thin sections and to R. Mazza (Università Roma Tre) for graphics. M.Meccheri (Università di Siena) kindly shared the results of his geologic surveys. Finally, thanks are also due to N. F. Glasser, to an unknown referee and to the scientific editor G. Casassa for their valuable suggestions.



