Urgently needing to equip the fleet, on 2 January 1672 Charles II defaulted on the loans borrowed against Treasury orders, which is known as the Stop of Exchequer (Horsefield Reference Horsefield1982). The creditors included not only the goldsmith-bankers directly involved in the King’s financial affairs but also members of the public who had deposited money with the bankers. When the crown’s fiscal situation eased following the third Anglo-Dutch war, Letters Patent were issued in April 1677 to secure the payment of interest to those affected by the default. Despite this, the government’s initial creditors were badly treated (Milevsky Reference Milevsky2017, pp. 185–90); in the literature, this default is used as a classic example to demonstrate the lack of credibility of the Stuart monarchs.
Following the rapid expansion of joint-stock companies in the late seventeenth century, the growing trade in joint-stocks led to the development of a secondary market for financial assets (Davies Reference Davies1952; Carlos and Van Stone Reference Carlos and Van Stone1996; Carlos, Key, and Dupree Reference Carlos, Key and Dupree1998; Murphy Reference Murphy2009, pp. 10–38). Since the first payment of interest, a secondary market for sovereign debt related to the Stop developed, and original creditors could transfer their right to permanently receive annual interest payments to a third party. Interest payments initially received by creditors and later re-assignments in the period 1677–1705 were recorded in the Exchequer of Receipt.Footnote 1 This documents that the trade in sovereign debt was active and the annuity had a certain liquidity.Footnote 2 Records of these secondary transactions provide a data-rich (both quantitatively and qualitatively) resource allowing this article to examine the government debt market itself, and quantitatively assess the long-standing question of the impact of the Glorious Revolution on the government’s credibility perceived by the investors.
Douglas North and Barry Weingast (Reference North and Weingast1989) argued that the constitutional change of 1689, which resulted in strengthening property rights, laid the foundation for the development of the financial market in the eighteenth century. Since then, scholars have fiercely debated the connection between the institutional change, the development of the capital market, economic growth, and later British hegemony. However, the argument that property rights were strengthened following the Glorious Revolution is not supported by the rate of return on land in the period 1540–1730, which remained stable throughout the period and was not affected by the constitutional change (Clark Reference Clark1996). Instead of lowering the cost of private borrowing and thus promoting the private capital market, increasing public borrowing after the Glorious Revolution competed for loanable funds with the private sector and thus raised the rate on private loans (Quinn Reference Quinn2001).
North and Weingast (Reference North and Weingast1989) also argued that another consequence of the Glorious Revolution was to bind the Crown’s behaviors within a set of rules, making the Crown more accountable. Hence, the new political institution should have reduced the cost of public borrowing. Nathan Sussman and Yishay Yafeh (Reference Sussman and Yafeh2006) construct a series of the cost of British public debt for the period 1690–1790, demonstrating that the political reform of 1689 did not have an immediate effect on the capital market, and that until the 1730s the costs of government borrowing remained high in relation to those in the Netherlands.Footnote 3 Two possible explanations for the delayed response are that the credibility of the new institutions was only established over time (Murphy Reference Murphy2013), and that the new political settlement remained under threat until the ascent of George I to the throne (Wells and Wills Reference Wells and Wills2000).
The crucial challenge faced by empirical study of the impact of the Glorious Revolution on financial markets is the limitation of data. As noted in the literature (Sussman and Yafeh Reference Sussman and Yafeh2006; Temin and Voth Reference Temin and Voth2008), private and public capital markets were segregated at the time, and inferences drawn only from private borrowing are likely to be inadequate. The current literature has relied on fragmentary archival data or other proxies to measure the cost of public debt prior to the mid-eighteenth century, after which market prices for government debt became continually available. This article contributes a new data source which can be used to directly measure the changes in the government’s credibility perceived by the investors.
Based on information for the assignment and re-assignment of interest payments spanning the years 1677–1705, this article quantifies the activity of the secondary market for sovereign debt, calculates the current yields of government debt, and directly assesses the effect of the constitutional change of 1689 on the government’s credibility. Rather than measuring the cost of public borrowing, this study discusses whether and to what extent the creditworthiness of government, as perceived by investors, altered with the change in political settlement. For a given coupon rate, the purchasing price of annuity should reflect investors’ expectation of government commitment to the payment of interest: the higher the price offered (the lower the current yield), the more the investors trusted that the government would honor its promises. The analyses reveal that although the creditors’ rights were violated during the first 12 years of the Glorious Revolution, once the government committed to resume the payment of interest, the yields of the government debt fell and converged to 6 percent; the maximum legal rate of interest and the rates of return of alternative investment. The movement of current yields of the sovereign debt suggests that the government’s creditworthiness was significantly improved under parliamentary supremacy.
THE STOP OF EXCHEQUER, 1672
With the restoration of Charles II in 1660, the Exchequer devised various schemes to encourage people to make loans to the King, one of which was to borrow against specified tax revenues.Footnote 4 The lenders advanced money to the King, receiving receipts numbered in sequence and signed by the Lord Treasurer. These receipts (also called Treasury Orders) could, with written notice to the Auditor of the Receipt, be sold and assigned to a third party. Treasury Orders were issued in anticipation of future tax revenue to pay for the government’s expenses and to borrow money. At first, the issue of Treasury Orders was strictly controlled to ensure that tax revenue was sufficient to guarantee full and prompt repayment. However, once Treasury Orders were no longer issued against taxes earmarked to pay them, but against revenue in general, over-issue became a potential problem (Feavearyear Reference Feavearyear1963, pp. 111–13; Horsefield Reference Horsefield1982; Carruthers Reference Carruthers1996, pp. 60–61). The combination of the second Anglo-Dutch War of 1665–1667, the plague of 1665, and the Great Fire of London in 1666, delivered a severe blow to royal revenues and impaired the government’s financial situation (Chandaman Reference Chandaman1975, pp. 210–13). The fiscal position failed to improve following the peace treaty of Breda of July 1667, because the government faced considerable arrears for debts incurred during the war (Browning Reference Browning1996, p. 831). This grew worse when Charles II secretly committed himself to join Louis XIV in an attack on the Dutch.Footnote 5 Given the pressing demand for cash, the government diverted revenue that should have been used to redeem Treasury Orders to outfit the Navy in anticipation of war. The Stop of Exchequer was the unavoidable solution to Charles II’s embarrassing fiscal position and an illustration that the monarch could arbitrarily default on his obligations.
On 2 January 1672, the government suspended repayments and interest on registered Treasury Orders for one year, excepting those paying for public services and those secured against certain resources.Footnote 6 The Stop was initially designed to be a temporary device to alleviate the fiscal shortfall and divert money for urgent military use. However, even with two further extensions, Charles II remained mired in financial difficulties and the Stop became permanent.Footnote 7
Upon receiving orders from the Treasury, departmental officials would quickly assign them to others in return for cash before the maturity. One example will suffice to illustrate the re-assignment process. In December 1665, Sir George Carteret, the Treasurer of the Navy, received 90 Treasury Orders with a total face value of £400,000 as payment for navy expenses. He assigned these orders to Dennis Gawden (a victualler) and Captain Cock as imprest, and seven other assignees (the East India Company, four goldsmiths, Sir Joseph Sheldon, mayor of London, and John Brown, gentleman). Only five unassigned orders were left in Carteret’s hands, with a value of £12,000 (3 percent of the total original value). Later, Gawden and Cock, who presumably preferred cash rather than waiting a few months for the orders to be redeemed, re-assigned their orders to third parties, mainly goldsmith-bankers. In the end, goldsmith-bankers held 53 orders with a total value of £215,000 (Rosevere Reference Roseveare1962). Thus, a large part of the government’s credit operated through the re-assignment of Treasury Orders.
Besides the 6 percent rate of interest designated for Treasury Orders, it was common to accept the orders below their face value as a discount. For example, Samuel Pepys advanced to Sir William Warrant the sum of £1,900 against the assignment of orders with a face value of £2,602 2s 7d, amounting to a 27 percent discount (Coleman Reference Coleman1963, p. 36). Advancing money to the crown by accepting Treasury Orders was a lucrative business. London’s goldsmith-bankers became the ultimate creditors to the crown by accepting re-assignment of Treasury Orders. Thus, when the crown ceased repayment, the goldsmith-bankers were the biggest losers from the Stop of Exchequer. Of the total £1,211,065 debt affected, goldsmith-bankers owned £1,173,352 (96.8 percent).Footnote 8
Much of the money the goldsmith-bankers were advancing to the crown through purchases of Treasury Orders came from deposits of numerous clients. Since the mid-seventeenth century, merchants and landowners had placed money with London goldsmiths for safekeeping and the interest payment thereon.Footnote 9 While they may have been personally reluctant to lend to the crown, through the goldsmiths’ financial dealings, their capital was involuntarily held in the form of sovereign debt. As a result, when the crown ceased honoring its obligations, not only did the goldsmiths suffer, but also those who had deposited money with them. The Stop of Exchequer thus caused a liquidity crisis and credit shortage in London. Following the Stop, several London goldsmiths were unable to meet the heavy demand for the withdrawal of deposits and slipped into insolvency and bankruptcy: Colvile by 1679, Backwell by 1682, Vyner by 1684, and Meynells in 1685 (Horsefield Reference Horsefield1982, p. 524).
In April 1677, by Letters Patent, Charles II authorized payment of annual interest at 6 percent on the debt owed to those affected by the default, but with no repayment of the principal. The payment of interest was made regularly in the years leading up to 1680 but faltered afterwards. Following the accession of William and Mary in 1689, uncompensated creditors petitioned parliament and brought their cases to the courts to pursue repayment. The Court of Exchequer agreed that Charles II’s debt would be legally binding on the successors to the throne (Figley and Tidmarsh Reference Figley and Tidmarsh2009, pp. 1231–34). The dispute between the Treasury and creditors over the settlement of the debts did not conclude until the Act of 1701Footnote 10: the discharge of interest on the debt was made at the lower rate of 3 percent and the first repayment began in December 1705. Moreover, the debt could be redeemed by the payment of half of the principal. In 1720, the debt related to the Stop of Exchequer was converted into South Sea stock and is no longer identifiable.
DATA SOURCES
A large proportion of defaulted loans was, as noted previously, money deposited with goldsmiths. Under the repayment scheme of 1677, in order to receive interest payments on the deposits affected by the Stop, the goldsmiths’ creditors were required to enroll with the Exchequer and verify the sum of principal owed them and the yearly interest payment to which they were entitled. As a result, the exact amount of debt owed to the goldsmiths and their respective creditors is documented in the Assignment Books of Exchequer of Receipt.Footnote 11 Furthermore, the Assignment Books also recorded the re-assignments of the right to receive the annual interest payment between original creditors and third parties, with some giving a market price for the transaction.
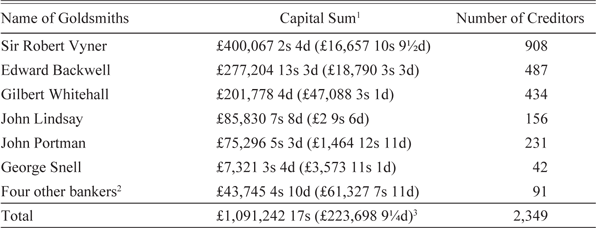
The Assignment Books comprise two parts: Goldsmith’s Assignment Books and Pells’ Office Assignment Books.Footnote 12 This article uses the second series of Goldsmith’s Assignment Books and Pell’s Office Assignment Books, which document the creditors of six goldsmith-bankers: Sir Robert Vyner, Edward Backwell, Gilbert Whitehall, John Lindsay, John Portman, and George Snell. While the contents of Pell’s Office Assignment Books are mainly duplicates of those kept in Goldsmith’s Assignment Books, they also documented some creditors of four other goldsmith-bankers: Thomas Rowe, Robert Ryves, Sir Jeremiah Snow, and Robert Welsted. The capital sum owed to the creditors of various goldsmith-bankers recorded in the Assignment Books is shown in Table 1. There is a difference between the sums entered into the Assignment Books, and those reckoned in 1677 by Lord Danby, when the government made provision for the payment of interest. The biggest discrepancy arises with the four goldsmith-bankers recorded in the Pell’s Office Books, which only listed an undercounted number of 91 creditors. The difference of £61,327 is attributable to a lacuna in the data. The capital sum recorded in the Assignment Books accounts for 83 percent of the total reckoning made in 1677.
MONEY OWED TO CREDITORS RECORDED IN THE ASSIGNMENT BOOKS

1 In 1677, Lord Treasurer Danby estimated that the total principal sum (including capitalised interest) due to 25 creditors amounted to £1,314,940 17s 9¼d. The discrepancy between the sums recorded in the Assignment Books and those estimated by Danby is shown in parentheses.
2 Thomas Rowe, Robert Ryves, Sir Jeremiah Snow, and Robert Welsted.
3 The total discrepancy is between the sum recorded in the Assignment Books and the total sum reckoned in 1677, which includes another 15 creditors (Joseph Hornby, Bernard Turner, Isaac Collier, John Thruston, Isaac la Gouche, Sir Edmond Turner, Dr. Edward Chamberlain, George Toriauo, Sir John Shaw, Francis Millington, Henry Johnson, Robert Wynne, Richard Lant, Isaac Alvarez, and William Gomeldon).
Sources: The National Archives, London, E406/16 44; Calendar of Treasury Books, vol. III: xlviii.
A typical entry in the Goldsmith’s Assignment Books reads as follows:
“[w]hereas William Moyer of London Merch[ant] hath delivered up unto me John Lindsay of London goldsmith all his securities for, and hath discharged me of the sume of eight hundred and sixteen pounds which was due unto him by John Colvile of London goldsmith dec[eased], and is content to accept of an assignment of a propor[t]ionable part of the rent or yearly sume of five thousand one hundred forty nine pounds seventeen shillings and four pence granted unto me, my heirs and assignees by his Maj[esty] […] and payable out of his hereditary Revenue of Excise by virtue of his Maj[esty’s] Letters Patents dated the third day of May last past. Know all men therefore by these presents, that I the said John Lindsay in consideration thereof, and in pursuance of the trust reposed in me by the said Letters Patent have granted and assigned and by these presents do grant and assign unto the said William Moyer and his heirs the sume of forty eight pounds nineteen shillings and two pence yearly being his propor[t]ionable part of the said yearly sume of five thousand one hundred forty nine pounds seventeen shillings and four pence in satisfaction for his said debt. […] To hold receive and enjoy the said yearly sume of forty eight pounds nineteen shillings and two pence unto the said William Moyer and his heirs assignees forever to commend from…”Footnote 13
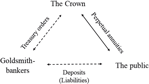
The text indicates that there were two distinct credit chains: one between the goldsmith-bankers and the crown, and the other between the depositors and the goldsmith-bankers as illustrated in Figure 1. Charles II used tax revenue to repay the debt owed to London goldsmith-bankers, who in turn owed money to their original depositors. Goldsmith-bankers discharged their personal obligations by assigning the interest payment received from the government to their creditors, who received the yearly payment of interest in proportion to their deposit. The personal debt owed by goldsmith-bankers to their depositors was de facto converted into the debt of the crown. The creditors of goldsmith thus became holders of English sovereign debt. By Letters Patent, the liability of goldsmith-bankers became assignable government debt. Holders of this debt could pass it to their heirs or assign it to a third party. As a result, a secondary market for government debt emerged in the last quarter of the seventeenth century. Indeed, the method used to repay the £1.3 million debt created by the Stop of the Exchequer was the precursor of annuities financed by regular tax which emerged in the 1690s (Dickson Reference Dickson1967).
THE CREDIT RELATIONSHIP BETWEEN THE CROWN, GOLDSMITH-BANKERS, AND THE PUBLIC

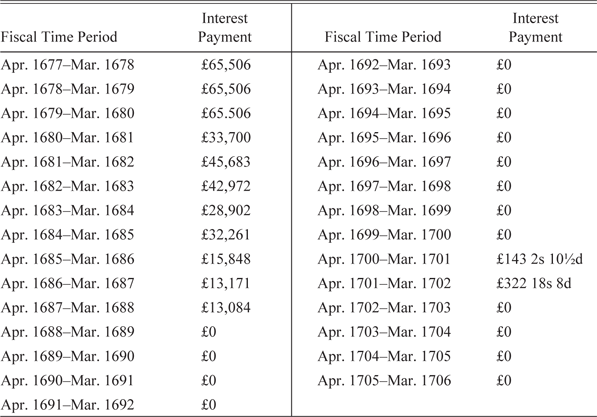
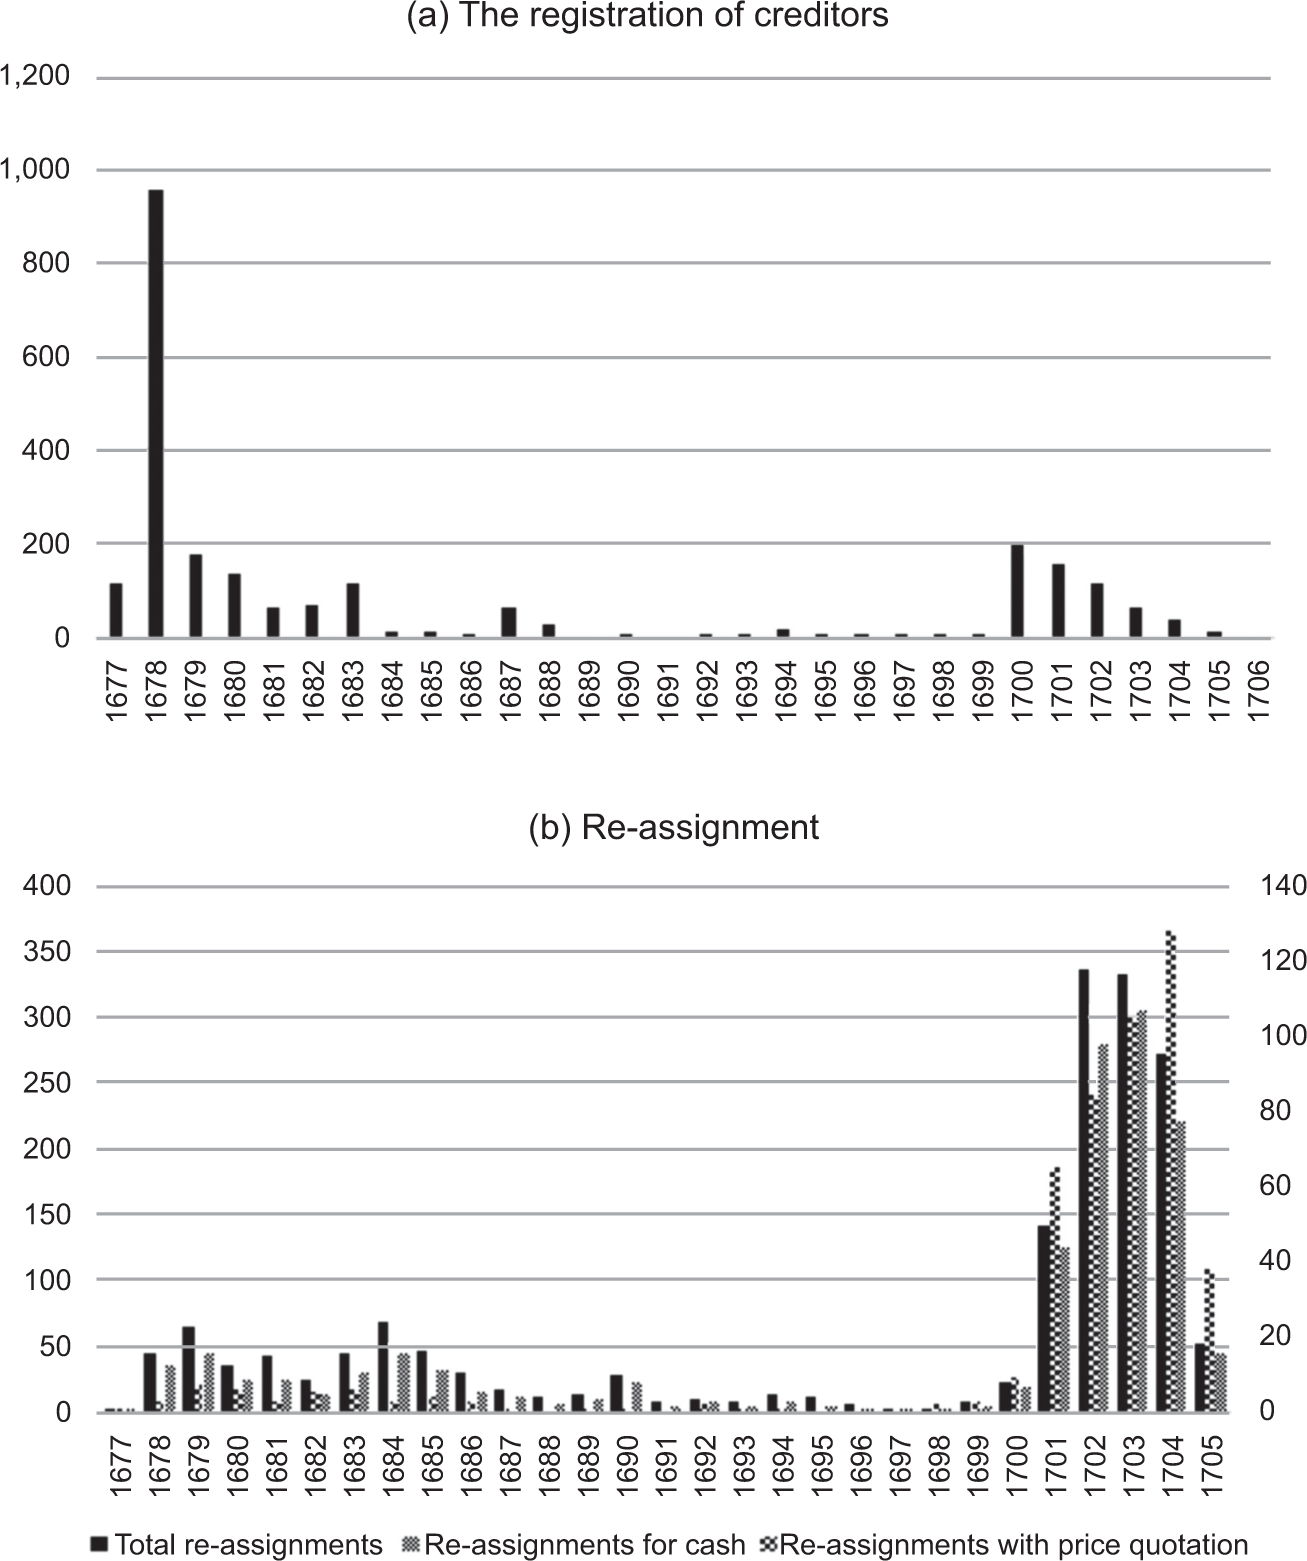
Between September 1677 and June 1705, 2,349 entries between original depositors and their goldsmith-bankers (assignments), and another 1,692 entries of secondary transactions (re-assignments) were recorded in the Assignment Books. Among these secondary transactions, there are 487 transactions with a price quotation. The distribution of transactions is shown in Figure 2 and the yearly interest payments made out by the Exchequer are listed in Table 2.
THE PAYMENT OF INTEREST MADE IN YEARS 1677–1705

Note: In early 1700 Robert Williamson won the court case for his £1,000 capital affected by the Stop. The two interest payments in February and April 1701 were made to Robert Williamson, being part of £1,067 accrued by 17¾ years’ arrears of interest. The £466 1s 6½d was all the interest payment he had received.
Sources: Milevsky (Reference Milevsky2017, p. 181); Horsefield (Reference Horsefield1982, pp. 521–52).
THE NUMBER OF TRANSACTIONS, 1677–1705

Most depositors registered themselves within the first eighteenth months of the issue of Letters Patent, and the secondary market for the annuity developed immediately. The government regularly made interest payment between 1677 and 1679, and the interest payment accounted for 20 to 70 percent of the annual amount owing in 1680–1687. In the aftermath of the Glorious Revolution, payments stopped completely. The resumption of interest payment was sanctioned by an Act of Parliament in 1701 but the payment only began from December 1705 onwards.
In the years 1677–1687, when the payment of interest was intermittently made, the annuity was transferred regularly, with an average of 42 re-assignments, and 28 re-assignments involving money transactions annually. From 1688–1700, when no interest was paid, the number of secondary transactions fell to a negligible level. After several years of lawsuits and petitions, in 1701 creditors were granted the repayment of interest at the lower rate of 3 percent (rather than 6 percent) to commence from December 1705. The surge of re-assignments in the period 1701–1705 was a result of the promised resumption of interest payment, although no payment had actually been made.Footnote 14 The numbers of secondary transactions were 417 (25 percent) from 1677–1687, 145 (8 percent) 1688–1700, and 1,130 (67 percent) 1701–1705.Footnote 15 Activity in the secondary market for sovereign debt reflected to some extent whether the government honored its debt.
THE SECONDARY MARKET OF GOVERNMENT DEBT
A nascent secondary market for government debt had already begun to develop in London as early as the mid-seventeenth century.Footnote 16 Trading in the secondary market solved the problem of illiquidity and provided the only means to recover part of the original investment, especially when the government was likely to default or delay the payment of interest. According to Moshe Milevsky (Reference Milevsky2017, p. 189), the rate of return for initial creditors was a negligible 0.01 percent if they held the government debt to December 1705.Footnote 17 On the other hand, the available price quotations reveal that on average a third of the initial deposit could have been recouped from the secondary market.Footnote 18
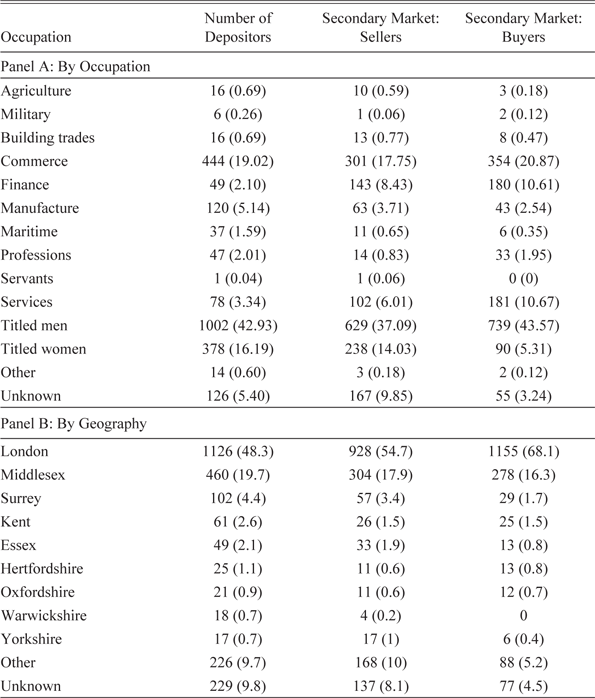
The secondary market for this sovereign debt reveals several characteristics of financial investment in late seventeenth-century England. The occupational and geographical distribution of sellers and purchasers are presented in Table 3. It suggests that participants in the secondary market were concentrated in the Home Counties. The category of occupations follows the classification used by Ann Carlos and Larry Neal (Reference Carlos and Neal2006). Titled men (including gentleman and nobility) dominated the secondary market, accounting for 37 percent of sellers and 44 percent of buyers of government debt; followed by tradesmen—commerce, finance, and service, accounting for another 32 and 42 percent, respectively. Goldsmiths and scriveners, traditionally financial intermediaries, accounted for just a quarter of the total purchases of tradesmen; most transactions done by tradesmen were carried out by men in commerce and service. The proportion of female sellers remained similar to that of female depositors and other female investments, however their participation as buyers fell dramatically to 5 percent of the observations. Compared to female participation in the stock markets, fewer women bought government debt on the secondary market (Carlos and Neal Reference Carlos and Neal2004; Carlos et al. Reference Carlos, Fletcher, Neal, Coffman, Leonard and Neal2013). Taking into consideration the irregular payment of interest, being more risk-averse, women tended to dispose of their holdings and invested less in government debt (Barsky et al. Reference Barsky, Juster and Kimball1997; Sundén and Surette Reference Sundén and Surette1998; Eckel and Grossman Reference Eckel and Grossman2002).
DISTRIBUTION OF HOLDERS OF SOVEREIGN DEBT

Note: The percentage of the total observations is in parentheses.
Source: The National Archives, London, E406/16 44. Carlos and Neal (Reference Carlos and Neal2006, Appendix A).
As revealed in Table 3, Panel B, the money deposited with London goldsmiths was drawn from a limited geographic pool: the city of London, Middlesex, and Surrey. Trade in annuity indicates an even smaller catchment area for the secondary market of government debt. Although the proportion of sellers who gave their residence in these three areas remained at the same level as depositors, only one-tenth of purchasers came from other counties. London’s pre-eminence was especially pronounced in terms of purchasers of annuity, rising to 68 percent of total purchases. This skewed geographic distribution is likely a result of the accessibility of information and the use of credit in the city and neighboring counties.
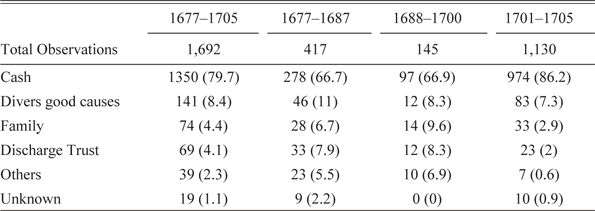
When the Assignment Books recorded the re-assignment, the reasons for the transaction were provided. The reasons behind the re-assignments are summarized in Table 4. Although across all transactions trading for cash predominates, there are signs that these perpetuities were considered quite useful and acceptable in the sphere of family finance, for example, endowment, legacy or dowry. For example, Peter Aylworth, a cloth-worker of London, granted his yearly interest payment of £12 6s as dowry to his son-in-law, John Hoyle.Footnote 19 The annuities were also employed for debt settlement, and acted as security for future payment. For instance, Edward Harwood was indebted to John Langwith for £50. On 26 November 1695, Edward Harwood assigned his annuity of £14 14s to John Langwith as collateral for the repayment of £50 along with the interest at the rate of 6 percent annually.Footnote 20
THE REASONS BEHIND RE-ASSIGNMENTS
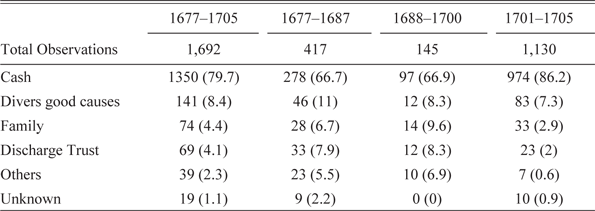
Note: The percentage of the total observations is in parentheses.
Source: The National Archives, London, E406/16 44.
During the non-payment period, since there was little likelihood of receiving interest payment in this period, people were reluctant to purchase the perpetuity, resulting in a smaller number of transactions. The proportion of re-assignments between family members increased but those trading for cash remained stable at two-thirds of observations. When the intention to resume payment of interest was made public, the proportion of transactions associated with trading for cash rose to 86 percent, implying that the public, at least in terms of buyers, trusted the parliamentary government to honor the promise and make interest payment, and thus became more willing to buy annuities.
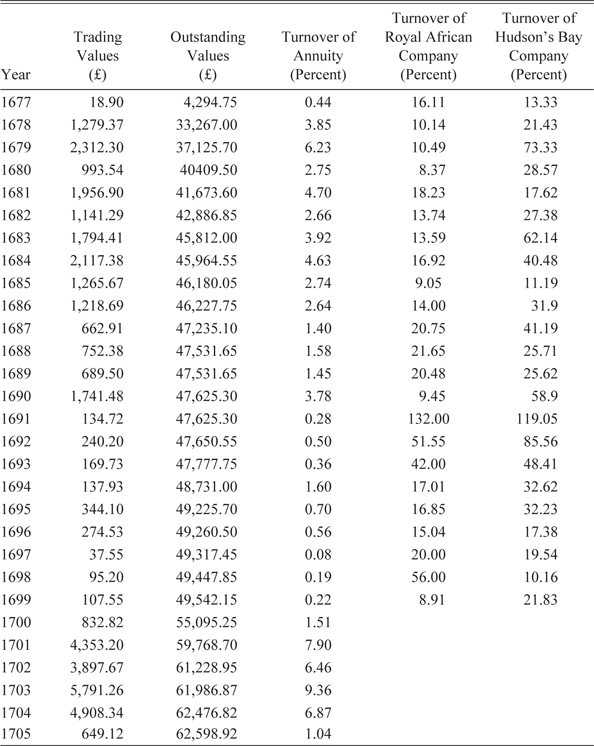
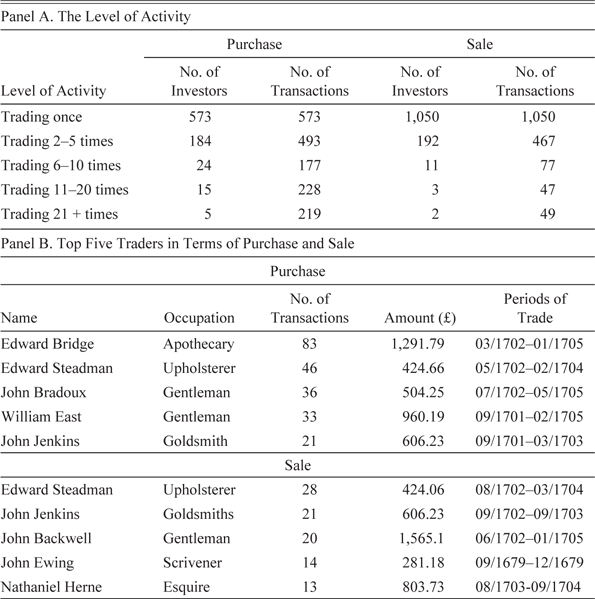
Among the annuities issued to the original creditors, nearly half were re-assigned. However, only 12 percent of the total re-assignments were traded more than twice. The activity of the market can be measured by the rate of turnover, dividing the annual trading volume by the outstanding volume of annuity. Compared with trade in corporate stocks, as shown in Table 5, the turnover of annuity was much lower, particularly in the period of non-payment as might be expected. This indicates that although people began to regard annuity as an ordinary financial investment, the secondary market for government debt still lacked depth and breadth at the turn of the eighteenth century.Footnote 21 Despite the relatively low level of market activity, brokers and dealers for government debt began to emerge, as shown in Table 6. In terms of purchase, more than a quarter of transactions were made by just 20 people, who individually bought at least ten annuities each. The most prominent buyer was Edward Bridge, a London apothecary, buying 83 annuities over three years. Sales were less concentrated; 83 percent of sellers only appeared in the market once and their trade accounted for 62 percent of transactions. Only five people were the recorded seller in more than ten different transactions.
THE TURNOVER OF ANNUITY AND CORPORATE STOCKS, 1677–1705

Note: The year 1705 only covers the months from January to June.
Source: The National Archives, London, E406/16 44. Carlos, Key and Dupree (Reference Carlos, Key and Dupree1998, tables 1 and 6).
TRADERS GROUPED BY THE LEVEL OF ACTIVITY AND THE TOP FIVE TRADERS

Source: The National Archives, London, E406/16 44.
Two of the top five buyers, Edward Steadman and John Jenkins, were also the two top sellers; they disposed of their entire purchases in almost the same period of time, as shown in Table 6. On the other hand, the other three big buyers: Edward Bridge, John Bradoux, and William East, only sold 29, 6, and 28 percent of their holdings, respectively. Nathaniel Herne, who was not among the original creditors of the goldsmiths, began buying heavily from the secondary market from September 1701 to August 1703, making 19 purchases amounting to £1,037 3s 6d in total annual interest payments. Immediately after the purchases, Nathaniel Herne sold more than three-quarters of his holdings in a year. Such a trading pattern indicates that these participants were likely stock-jobbers. A large proportion of traders were the original depositors of goldsmiths and thus acquired information as to the holders and prospective buyers of government debt.
The top five traders’ purchases and sales were carried out between 1701 and 1705, after the announced resumption of the interest payment, with one exception. On 26 September 1679, John Ewing, a London scrivener, bought one annuity with a yearly interest payment of £281 5s 2d from William Johnson and James Donaldson, London merchants, who were the original creditors of John Lindsay. Within the next three months, John Ewing subdivided the annuity and sold the resulting portions to 14 different people. As a scrivener, John Ewing had the opportunity to identify potential investors in government debt and consequently, he was able to transfer the annuities within a short period of time. Overall, the average time period between the purchase and the later sale was three years and three months; however, that fell to nine and a half months for the annuities traded by repeat investors who traded, purchase and sale together, more than ten times.
THE CONSTITUTIONAL CHANGES AND THE CREDIBILITY OF GOVERNMENT
As mentioned earlier, some scholars have argued that the constitutional changes after the Glorious Revolution led to increasing government credibility perceived by the investors, supported by the evidence that the public voluntarily lent a large sum of money to the government to fund military expenditure in the 1690s.Footnote 22 Nevertheless, the cost of public borrowing remained high until the mid-eighteenth century; hence the government did not immediately become more trustworthy just because of the changes in the political institution. The trade in government debt related to the Stop of Exchequer is an important historical case allowing a close and direct examination of whether the government’s credibility perceived by investors was enhanced by the Glorious Revolution.
In 1701, Parliament announced the resumption of interest payment from December 1705 onwards; afterwards the number of re-assignments and the proportion of trading for cash greatly increased, as shown in Figure 2, Panel B and Table 4. Considering that there had been years of no payment, the surge in trading activity suggests that the public, at least the buyers, had confidence in the parliamentary monarchy, otherwise they would not purchase the annuity. During the decade of non-payment, the investors had difficulties in selling annuities, since there were few buyers in the market, thus resulting in low turnover in the debt market. After 1701, when some investors who believed in the government became willing to purchase annuity, those regarding the government as having low credibility were able to dispose of their holdings.
Investors sold their annuities for several reasons. Perhaps they did not believe the government’s promise to resume the interest payment, or they reallocated their financial capital to other assets, following the halving of the interest rate, or they simply liquidized their assets to realize the profits, or for other reasons. The Assignment Books do not record what exactly motived the investors to sell, however, the date of the annuity being acquired and the ex-post rate of return could shed some light on this issue. Some sellers were the original creditors who might have been unable to dispose of their annuity until 1701, and who account for 56 percent of the total number of sales for cash in 1701–1705. If the creditors trusted the government to resume the interest payment, they would have held onto the annuity instead of selling it. At least half of the sellers therefore had a low opinion of government credibility.
In more than a third of sales in 1701–1705, the sellers were also buyers, accounting for 40 percent of the total number of buyers, and they traded 24 percent of the total value of annuities purchased in 1701–1705. Among them, the five sellers listed in Table 6 carried out a quarter of sales in number and 30 percent in value. The stock jobbers traded actively and through them investors with various opinions of the government’s credibility were brought together, and thus the debt market could gradually reach equilibrium. For the sales quoted with both purchasing and selling prices, they reveal that the majority of annuities (82 percent) were sold at a profit: the ex-post rates of return ranged from 0.22 to 258 percent, with an average of 37 percent. If this sample is representative of the whole body of observations between 1701 and 1705,Footnote 23 the investors, who meanwhile were the buyers, sold their holdings not because of a lack of confidence in the government, but because they expected to make a profit by trading in annuities.
Overall, there were diverse opinions about the government’s credibility among investors, whose opinions and valuations of annuity are reflected in the price agreed at each transaction. If investors had doubts over whether the government would begin or continue to pay the interest, the prices people willingly paid for the annuity would be driven down. The Assignment Books recorded 487 price quotations, as shown in Figure 2.b, which are unevenly distributed, with the majority being recorded in the years 1701–1705. According to Letters Patent, the interest payment is perpetual, and hence this government debt is a perpetuity. The current yield of a perpetuity can be calculated using the following formula.
 $${\rm{Current Yield}} = {{Annual Coupon} \over {Current Bond Price}}$$
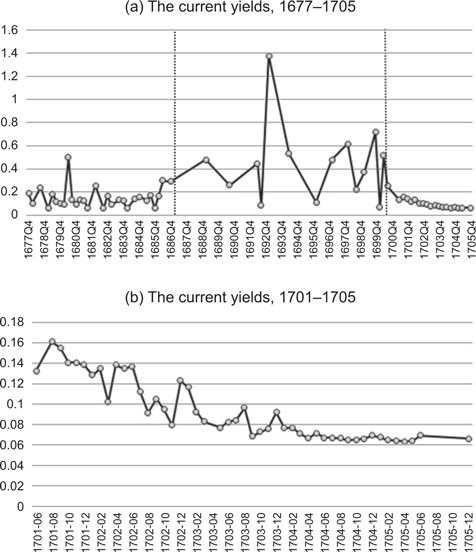
If the government became more trustworthy after the constitutional changes, the price of perpetuity should increase, resulting in a downward trend in the current yield. The movement of current yields of perpetuity in the years 1677–1705 is illustrated in Figure 3. It suggests that the government’s creditworthiness was improving, despite the fact that creditors’ rights were upheld by Charles II but violated during the early years of the Glorious Revolution.
THE CURRENT YIELDS OF PERPETUITY, 1677–1705

The non-payment and uncertainty about debt settlement caused the high and volatile current yields in the period 1688–1700; furthermore, the government’s fiscal difficulties at the time could have also contributed to the high level of current yields. After William III ascended the throne of England, he brought England into war with France (1688–1697). As a result, the demands for military expenditure greatly increased and every available financial resource was tapped by the government. One method was to borrow from the public. The achievement was remarkable. Considering the nascent political system and the remaining unpaid debt and arrears related to the Stop, the new constitutional monarchy managed to borrow a large sum of money from the public.
Despite this success, the government was forced to pay a high rate of interest to elicit the loans. The interest rates of life annuities issued in 1694 ranged from 10 to 14 percent.Footnote 24 After the announcement of the resumption of payment of interest on debt relating to the Stop of Exchequer, the investors valued the old debt almost as highly as the new annuities. Until mid-1702, the current yields of old debt (on average 14 percent) remained close to the rates of interest paid by new annuities. It indicates that the investors considered old and new debts as equivalent financial assets having similar risk, even though the old debt was inherited from the previous monarchy and did not receive interest payment for years. During the second half of 1702, the current yields fell quickly and converged to the rate of 6 percent, implying that public opinion of government credibility improved as the date of resumption approached.
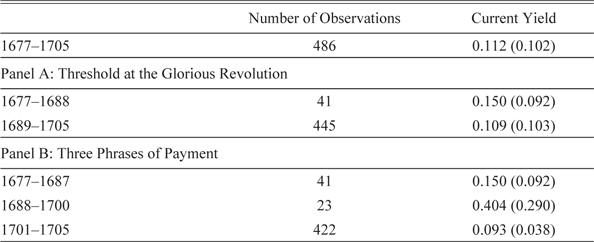
The average current yields are listed in Table 7, which shed light on the changes in government credibility perceived by investors with different debt arrangements. Over the whole period, the average current yield was 11.2 percent, which was nearly twice the legal rate of interest at the time. The upper part of Table 7 shows the average current yield before and after the Glorious Revolution of 1689, and the lower part the three phases of the way in which the payment of interest was made. A two-sample test for unpaired data is employed to determine whether the average current yields in different political institutions are equal. The absolute value of the test statistic, 2.538, is greater than the critical value of 2.02, therefore the null hypothesis, that average current yields before and after the Glorious Revolution are equal, is rejected at the 0.05 significance level. The average current yields of the three phases of debt settlement are also statistically different to each other. Furthermore, a Bai-Perron multiple breakpoint test is performed to determine whether the current yields have any structural break. The results show that there are two estimated break dates, 1687Q1 and 1700Q3, verifying that current yields changed corresponding to how the debt was settled.
THE CURRENT YIELDS OF PERPETUITY, 1677–1705

Note: The standard deviations are shown in brackets.
Source: The National Archives, London, E406/16 44.
Before the Glorious Revolution, the current yield was 0.15 which was almost three times the maximum legal rate of interest and the rate of return on alternative investment, for example, East India Company bonds.Footnote 25 The constitutional change had a negative effect on the current yield, which fell from 0.15 to 0.109, suggesting that parliamentary supremacy over fiscal policy boosted the government’s credibility. Investors perceived that the government was less likely to default after the constitutional change, and paid more for a given amount of annual interest payment. As a result, the current yield fell. However, there was no interest payment in the first 12 years of constitutional monarchy, and the public must have taken this into account.
The lower part of Table 7 divides observations according to whether the payment of interest was made. When there was non-payment and the government did not indicate its intention to resume interest payments, the average current yield increased from 0.149 to 0.404. The current yield in this period is much higher than that during the period of regular repayment, despite the government already being a constitutional monarchy. After the government announced that the interest payment (albeit at the rate of 3 percent) would be resumed, the average current yield dropped to 0.093.
The results reveal an interesting story. Since 1688, not a single penny of interest had been paid. When the government announced the resumption of payment in 1701, rather than doubting whether the payment would actually be made in four years’ time, the investors (at least the buyers) seemed quickly to believe that interest would be paid. The number of transactions rose and the current yields fell to levels that were lower than those observed during the reigns of Charles II and James II, when the payment was intermittently made. During both periods of 1689–1700 and 1701–1705, the government’s fiscal policy was controlled by Parliament and no interest payment had been made. However, the current yields were much lower in the later years than the earlier. The fall in current yields resulted from the government’s promise to repay the interest, and its credibility was established by this commitment. By an Act of Parliament, the investors’ opinions of government credibility had been greatly enhanced before any payment of interest was actually made. Moreover, as mentioned earlier, the debt from the Stop was soon priced as high as that issued in 1694. Although in comparison with the Netherlands, the cost of public borrowing remained high in the early eighteenth century (Sussman and Yafeh Reference Sussman and Yafeh2006), investors had established good faith in the new political settlement and trusted the parliamentary monarchy more than the previous regime. The former is demonstrated in the downward trend of current yields in 1701–1705, and the latter by the fact that the average current yield for 1701–1705 was two-thirds that of the years 1677–1687.
In May 1702 England became embroiled in another major European conflict, and several new long-term government debts were issued to finance military expenses. In 1704–1705, the current yields of the perpetuities associated with the Stop, on average 6.8 percent, conformed to the rate of return of alternative investments: new annuities were issued at a rate of 6.6 percent; the comparable rate on East India Company bonds was 6 percent. Moreover, the spread between government debt (both the new annuities and old perpetuity) and private company debt was now limited to a small range—0.6 to 1.4 percent during the first few years of the War of Spanish Succession.Footnote 26 There is no record available to determine whether the government actually honored its promise to repay the interest in December 1705.Footnote 27 However, the movement of current yields and the spread indicates that the government’s credibility was improved by the constitutional changes to the degree that the old government debt, which had not received payment for years, was priced as the same as the new issuance and private company bonds.
CONCLUSION
The Assignment Books provide information about the investors and price quotations of secondary transaction of government debt resulting from the Stop of Exchequer. Using this new dataset, this article quantitatively examines the depth and orbit of the debt market in late seventeenth-century England and calculates the current yields of government debt to directly assess whether the political institutional change of 1689 improved the government’s credibility.
The trade in government debt shared similar characteristics with other financial investments. Although the turnover was relatively low in relation to the trade in corporate stocks, brokers for government debt, mainly gentry and tradesmen, had already emerged to bridge the gap between sellers and buyers in the market. The availability and transmission of information was critically important to participation in financial markets. Consequently, the trade of government debt, like other financial investments, had a strong geographic concentration because information concerning the government’s financial situation, the parliamentary agenda, and potential sellers and buyers was easier to obtain in London. Despite being widely used in family finance, most government debt was traded for cash.
The increasing volume of trade and the falling current yields in the years 1701–1705 suggest that the Glorious Revolution indeed raised the level of government credibility. Although the current yields were high in the early years of constitutional monarchy, once the provision for discharging interest payment was made, the trade in government debt became active prior to the actual date of repayment. In spite of high and volatile current yields during 1688–1700, when no payment of interest was made, the government still managed to borrow a large sum from the public to finance the war. It is hard to tell whether the uncertainty of payment or the straitened fiscal situation caused the rising yields. Nevertheless, the average current yield was substantially lower in 1701–1705 than in the period 1678–1687, when the payment of interest was received by investors.
Once the government announced the resumption of interest payment, albeit in four years’ time, current yields fell quickly and converged to the prevalent rate of return of alternative investment. At first, the current yields fluctuated at a level similar to the rates of life annuities issued in 1694, fell quickly in late 1702, and finally converged to 6 percent in 1704. The public must have been sufficiently confident that the constitutional monarchy would honor the promise, showing their faith by resuming trade in perpetuity at rising prices. The movement of current yields accords with the argument that parliamentary supremacy over fiscal policy after the constitutional change of 1689 enhanced the government’s credibility. The government’s credibility was established by its commitments and actions rather than the regime per-se, supported by the lower current yields in the years 1701–1704 compared to 1689–1700. This also suggests that the financial market in London had achieved a high level of efficiency in order for the rates of return on several financial investments to converge within a small spread even in the middle of war.