Introduction
Cover crops have increased in popularity in recent years, most likely due to reports of increased soil organic matter, increased nutrient availability, reductions in soil erosion, and improved soil health with the use of cover crops (Pimentel et al. Reference Pimentel, Harvey, Resosudarmo, Sinclair, Kurz, McNair, Crist, Shpritz, Fitton and Saffouri1995; Reddy et al. Reference Reddy, Zablotowicz, Locke and Koger2003; Sainju and Singh Reference Sainju and Singh1997; Williams et al. Reference Williams, Mortensen and Doran1998). Certain cover crops can also provide increased control of winter annual weeds and small-seeded broadleaves, including Palmer amaranth (Amaranthus palmeri S. Watson) and common waterhemp [A. tuberculatus (Moq.) J. D. Sauer] in early spring (Bell et al. Reference Bell, Norsworthy and Scott2016; Cornelius and Bradley Reference Cornelius and Bradley2017b; DeVore et al. Reference DeVore, Norsworthy and Brye2013; Kruidhof et al. Reference Kruidhof, Gallandt, Haramoto and Bastiaans2011; Loux et al. Reference Loux, Dobbels, Bradley, Johnson, Young, Spaunhorst, Norsworthy, Palhano and Steckel2017; Webster et al. Reference Webster, Scully, Grey and Culpepper2013). Herbicide-resistant Palmer amaranth and waterhemp are two of the most difficult-to-control weeds in the United States (WSSA 2017). As cover crop use continues to increase, a primary concern is the ability to effectively terminate the cover crop before soybean [Glycine max (L.) Merr.] planting (Cornelius and Bradley Reference Cornelius and Bradley2017a). Effective cover crop termination is imperative so cover crops do not become weeds in the subsequent cash crop (Nascente et al. Reference Nascente, Crusciol, Cobucci and Velini2013; White and Worsham Reference White and Worsham1990). If not effectively terminated, cereal rye (Secale cereal L.), hairy vetch (Vicia villosa Roth), winter wheat (Triticum aestivum L.), crimson clover (Trifolium incarnatum L.), and annual ryegrass [Lolium perenne L. ssp. multiflorum (Lam.) Husnot] have all resulted in soybean yield decreases (Reddy Reference Reddy2001; Thelen et al. Reference Thelen, Mutch and Martin2004). Previous cover crop termination research has focused primarily on mechanical methods, including the roller crimper and mowing, which both have produced inconsistent results (Kornecki et al. Reference Kornecki, Price, Raper and Arriaga2009; Raper et al. Reference Raper, Simionescu, Kornecki, Price and Reeves2004). For example, Neu and Nair (Reference Neu and Nair2017) found that cereal rye could not be successfully terminated using the roller-crimper method. Raper et al. (Reference Raper, Simionescu, Kornecki, Price and Reeves2004) also found that cover crops are able to resume growth after mowing or crimping if not completely terminated. In addition, the most effective stage at which to terminate cereal rye and hairy vetch using the roller-crimper method is the reproductive stage, which may be later than recommended for planting agronomic cash crops (Creamer and Dabney Reference Creamer and Dabney2002; Kandel et al. Reference Kandel, Wise, Bradley, Tenuta and Mueller2016; Keene et al. Reference Keene, Curran, Wallace, Ryan, Mirsky, VanGessel and Barbercheck2017).
Grain farmers are relying on herbicides for terminating cover crops because of their relatively inexpensive application costs and the ability to cover more acreage in a shorter time (Raper et al. Reference Raper, Simionescu, Kornecki, Price and Reeves2004). The results from several studies have revealed that glyphosate-containing termination programs provide the best control of grass cover crop species such as cereal rye, annual ryegrass, and wheat (Cornelius and Bradley Reference Cornelius and Bradley2017a; Palhano et al. Reference Palhano, Norsworthy and Barber2018; Young et al. Reference Young, Whaley, Lawrence and Burke2016). However, glyphosate alone was not as effective as a mixture of glyphosate plus clethodim for annual ryegrass control (Cornelius and Bradley Reference Cornelius and Bradley2017a; Nandula et al. Reference Nandula, Poston, Eubank, Koger and Reddy2007). Furthermore, glyphosate alone does not provide effective termination of many broadleaf cover crop species (Cornelius and Bradley Reference Cornelius and Bradley2017a; Palhano et al. Reference Palhano, Norsworthy and Barber2018). Cornelius and Bradley (Reference Cornelius and Bradley2017a) and White and Worsham (Reference White and Worsham1990) found that legume cover crop species such as hairy vetch, Austrian winter pea (Pisum sativum L.), and crimson clover were most effectively terminated with herbicide treatments that contained either dicamba or 2,4-D. Palhano et al. (Reference Palhano, Norsworthy and Barber2018) also reported that paraquat plus metribuzin provided better control of Austrian winter pea, crimson clover, and hairy vetch than glyphosate alone.
A variety of cover crop species are currently being used prior to soybean planting in the United States. Some of the more popular species include cereal rye, hairy vetch, triticale (Triticosecale rimpaui C. Yen & J. L. Yang), Austrian winter pea, crimson clover, annual ryegrass, winter wheat, and turnips [Brassica septiceps (L. H. Bailey) L. H. Bailey] (Myers et al. Reference Myers, Ellis, Hoormann, Reinbott, Kitchen and Reisner2015; SARE 2017). Although some research has been conducted on herbicide termination of individual cover crop species, few studies have been conducted across a variety of common grass and broadleaf cover crop species or examined consistency across a range of environments. Therefore, the objective of this research was to determine the most effective herbicide treatments for successful termination of a diverse array of winter cover crop species across a wide geography in the United States.
Materials and Methods
Site Description
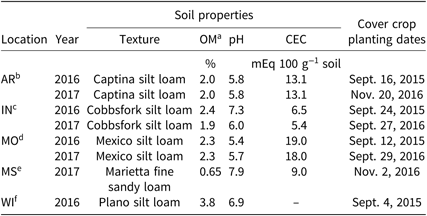
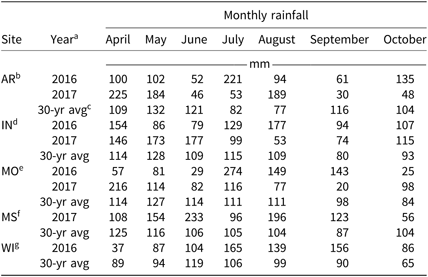
Field experiments were conducted in 2016 in Washington County, Arkansas; Jennings County, Indiana; Boone County, Missouri; and Columbia County, Wisconsin, and were repeated in 2017 in Washington County, Arkansas; Jennings County, Indiana; Boone County, Missouri; and Oktibbeha County, Mississippi, to determine the most effective herbicide treatments for the termination of cover crop species (Table 1). The seeding rates for the winter annual cover crops were 123 kg ha−1 for winter wheat, triticale, and cereal rye; 34 kg ha−1 for annual ryegrass and hairy vetch; 45 kg ha−1 for crimson clover; 56 kg ha−1 for Austrian winter pea; and 16 kg ha−1 for turnip. At all sites, annual ryegrass, cereal rye, hairy vetch, and two other cover crop species were planted that were suited to local conditions. Site-specific information regarding soil type, soil characteristics, and cover crop planting dates are listed in Table 1. Site-specific precipitation information is presented in Table 2.
Site characteristics for field trials conducted in 2016 and 2017.

a Abbreviations: OM, organic matter; CEC, cation exchange capacity.
b Fayetteville, Arkansas. Arkansas Agriculture Research and Extension Center, University of Arkansas (36.092996°N, 94.173423°W).
c Butlerville, Indiana. Southeast Purdue Agricultural Center, Purdue University (39.032428°N, 85.525611°W).
d Columbia, Missouri. Bradford Research and Extension Center, University of Missouri (38.898432°N, 92.216371°W).
e Starkville, Mississippi. R. R. Foil Plant Science Research Center, Mississippi State University (33.470807°N, 88.781666°W).
f Arlington, Wisconsin. Arlington Agricultural Research Station, University of Wisconsin (43.307943°N, 89.350072°W).
Monthly rainfall compared with the 30-yr averages at all trial locations from April through October in 2016 and 2017.

a Abbreviation: avg, average.
b Fayetteville, Arkansas. Arkansas Agriculture Research and Extension Center, University of Arkansas.
c The 30-yr averages (1981 to 2010) were obtained from the National Climatic Data Center (2011).
d Butlerville, Indiana. Southeast Purdue Agricultural Center, Purdue University.
e Columbia, Missouri. Bradford Research and Extension Center, University of Missouri.
f Starkville, Mississippi. R. R. Foil Plant Science Research Center, Mississippi State University.
g Arlington, Wisconsin. Arlington Agricultural Research Station. University of Wisconsin.
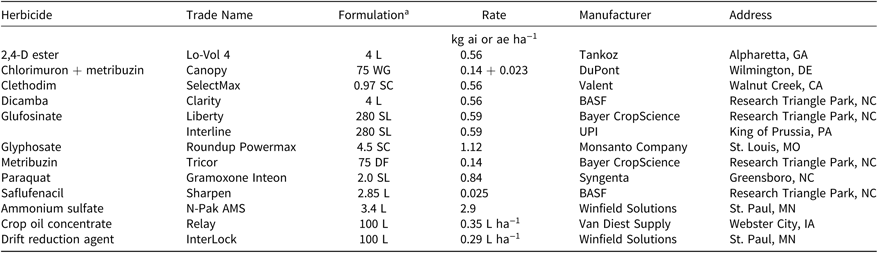
The experiment was conducted as a randomized complete block in a split-plot treatment arrangement. Cover crop species were whole plots and herbicide treatments were the subplots. Individual subplots measured 3 m by 3 m, and each treatment was replicated four times. Eighteen herbicide treatments commonly recommended for burndown applications were applied in early April (Table 3). This application timing is the most effective time to terminate cover crops in the Midwest (Cornelius and Bradley Reference Cornelius and Bradley2017a). Glyphosate-containing treatments included glyphosate at 1.12 kg ae ha−1 plus ammonium sulfate at 2.9 kg ha−1 alone and in combination with 2,4-D at 0.56 ae kg ha−1 plus ammonium sulfate at 2.9 kg ha−1; dicamba at 0.56 kg ae ha−1 plus ammonium sulfate at 2.9 kg ha−1; saflufenacil at 0.025 kg ai ha−1 plus ammonium sulfate at 2.9 kg ha−1; clethodim at 0.56 kg ai ha−1 plus ammonium sulfate at 2.9 kg ha−1; metribuzin at 0.023 kg ai ha−1 plus chlorimuron at 0.14 kg ai ha−1 plus 2,4-D at 0.56 kg ha−1 plus ammonium sulfate at 2.9 kg ha−1; and metribuzin at 0.023 kg ha−1 plus 2,4-D at 0.56 kg ha−1 plus ammonium sulfate at 2.9 kg ha−1. The paraquat-containing treatments included paraquat at 0.84 kg ai ha−1 plus crop oil concentrate at 0.35 L ha−1 alone and in combination with 2,4-D at 0.56 kg ha−1;plus crop oil concentrate at 0.35 L ha−1; dicamba at 0.56 kg ha−1 plus crop oil concentrate at 0.35 L ha−1; metribuzin at 0.023 kg ha−1 plus chlorimuron at 0.14 kg ha−1 plus 2,4-D at 0.56 kg ha−1 plus crop oil concentrate at 0.35 L ha−1; and metribuzin at 0.023 kg ha−1 plus 2,4-D at 0.56 kg ha−1 plus crop oil concentrate at 0.35 L ha−1. The glufosinate-containing treatments consisted of glufosinate at 0.59 kg ai ha−1 plus ammonium sulfate at 2.9 kg ha−1 applied alone and in combination with 2,4-D at 0.56 kg ha−1 plus ammonium sulfate at 2.9 kg ha−1; dicamba at 0.56 kg ha−1 plus ammonium sulfate at 2.9 kg ha−1; saflufenacil at 0.025 kg ha−1 plus ammonium sulfate at 2.9 kg ha−1; metribuzin at 0.023 kg ha−1 plus chlorimuron at 0.14 kg ha−1 plus 2,4-D at 0.56 kg ha−1 plus ammonium sulfate at 2.9 kg ha−1 plus crop oil concentrate at 0.35 L ha−1; and metribuzin at 0.023 kg ha−1plus 2,4-D at 0.56 kg ha−1 plus ammonium sulfate at 2.9 kg ha−1. All herbicide treatments were applied with Interlock (Winfield Solutions, St. Paul, MN) at 0.29 L ha−1. Each cover crop species had a nontreated control plot that did not receive any herbicide application.
Source of materials used in the experiments.

a Abbreviations: DF, dry flowable; L, liquid; SC, soluble concentrate; SL, soluble liquid concentrate; WG, water-dispersible granule.
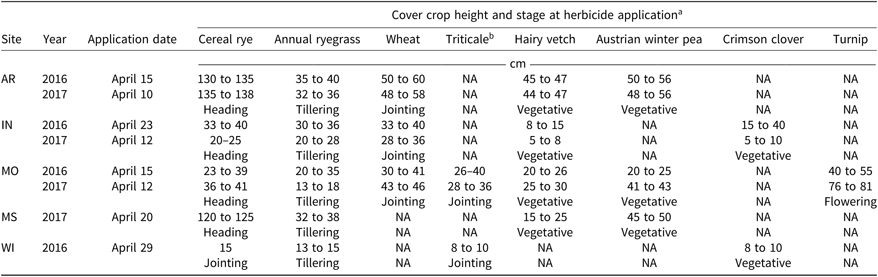
Application dates and cover crop heights at herbicide application are listed in Table 4. Applications were made using a 2-m boom-width, CO2-pressurized backpack sprayer equipped with XR 8002 flat-fan nozzle tips (TeeJet®, Spraying Systems Co., Wheaton, IL 60187) that delivered 140 L ha−1 at 117 kPa at a speed of 5 km h−1.
Height and stage of cover crops at herbicide application.

a Cover crops were not evaluated at every location.
b Abbreviation: NA, not applicable.
Treatment Evaluation and Data Collection
All cover crop species were evaluated 28 days after treatment for visible control on a scale of 0% to 100%, with 0% being equivalent to no control and 100% being equivalent to complete cover crop death. Cover crop biomass was determined by harvesting cover crop tissue from one 0.33-m2 quadrat plot−1 28 days after treatment. Biomass samples were weighed after being dried for 96 h at 49 C. Biomass reduction (BR) was calculated by dividing the differences between the treated and nontreated plots by the nontreated plot values.
Statistical Analysis
All data were analyzed using SAS, version 9.4 (SAS® Institute Inc. Cary, NC) using the PROC GLIMMIX procedure. Year-site combinations, states, and replications nested within states were random effects. Considering replication and site-year as random effects in the model allows inferences to be made over a wide range of environments (Blouin et al. Reference Blouin, Webster and Bond2011; Carmer et al. Reference Carmer, Nyquist and Walker1989). Herbicide treatments and cover crop species were considered fixed effects. Tukey’s honestly significant difference (HSD) test at P < 0.05 was used to separate individual treatment means.
Results and Discussion
Multispecies Experiment
There were differences in control and BR (P < 0.001) across all cover crop species and herbicide treatments. There was an interaction of cover crop species by herbicide treatment for control (P < 0.001); however, there was no interaction of cover crop species by herbicide treatment for BR (P = 0.876). Few differences existed in BR data, which is likely due to variability in cover crop growth across locations. We only present BR data in situations where treatment differences existed.
Grass Cover Crop Species
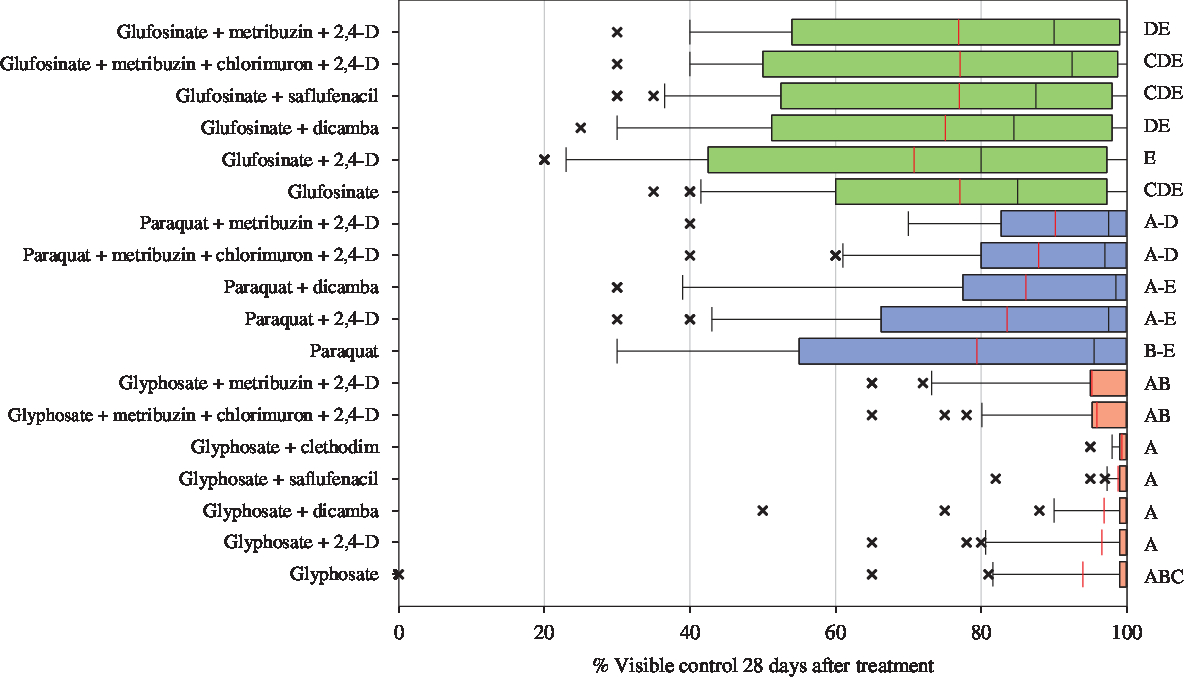
Cereal rye was terminated most effectively with treatments of paraquat applied in combination with metribuzin plus 2,4-D, metribuzin plus chlorimuron plus 2,4-D, dicamba, and 2,4-D; and glyphosate alone and in all combinations (Figure 1). Previous research has shown that glyphosate alone or in combination with 2,4-D, saflufenacil, or dicamba provided excellent cereal rye control (Cornelius and Bradley Reference Cornelius and Bradley2017a; Palhano et al. Reference Palhano, Norsworthy and Barber2018; Young et al. Reference Young, Whaley, Lawrence and Burke2016). Specifically, Palhano et al. (Reference Palhano, Norsworthy and Barber2018) reported at least 99% control with glyphosate alone or in combination with 2,4-D, saflufenacil, or dicamba. In our study, glyphosate-containing treatments provided 94% to 99% cereal rye control. whereas paraquat- and glufosinate-containing treatments provided 79% to 90% and 71% to 77% control, respectively (Figure 1). There were no differences in herbicide treatments for cereal rye BR (data not shown). This is likely due to variability in cereal rye growth and sampling across locations.
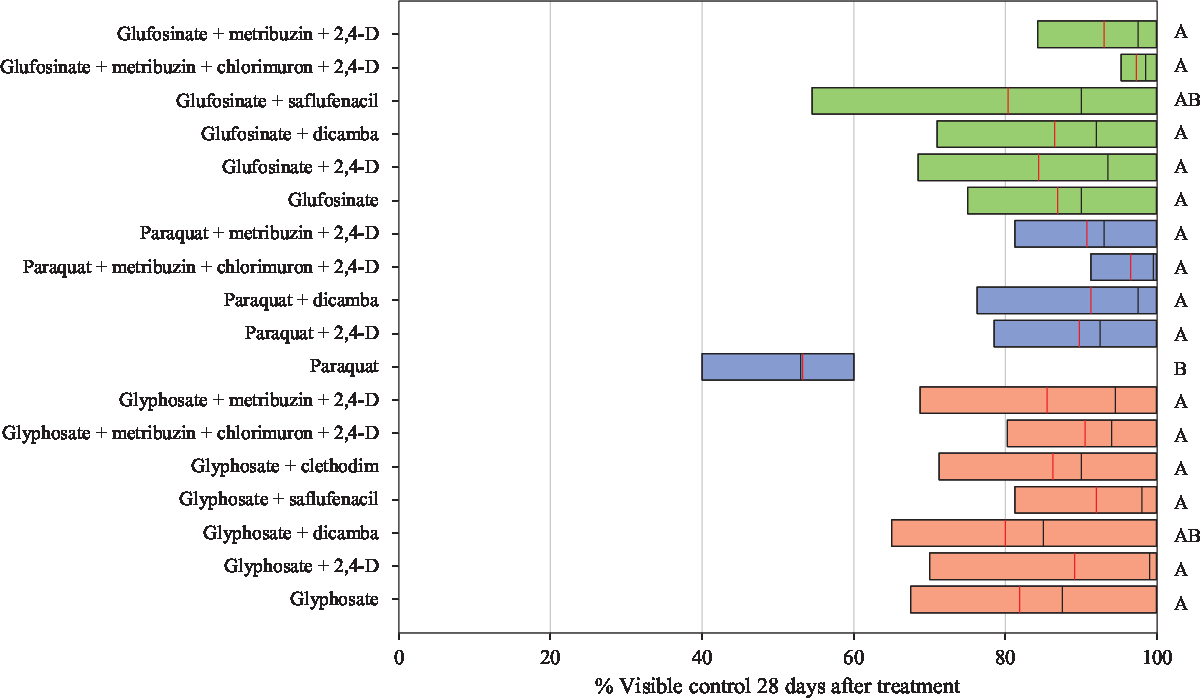
Average cereal rye control across 8 site-years. Mean control lines in red with the same letter are not significantly different, based on Tukey’s honestly significant difference test (P < 0.05). The box represents the middle 50% of the data set, whereas the left and right whiskers represent 25% and 75% of the data set, respectively. X denotes an outlier; black bar within box denotes the median.

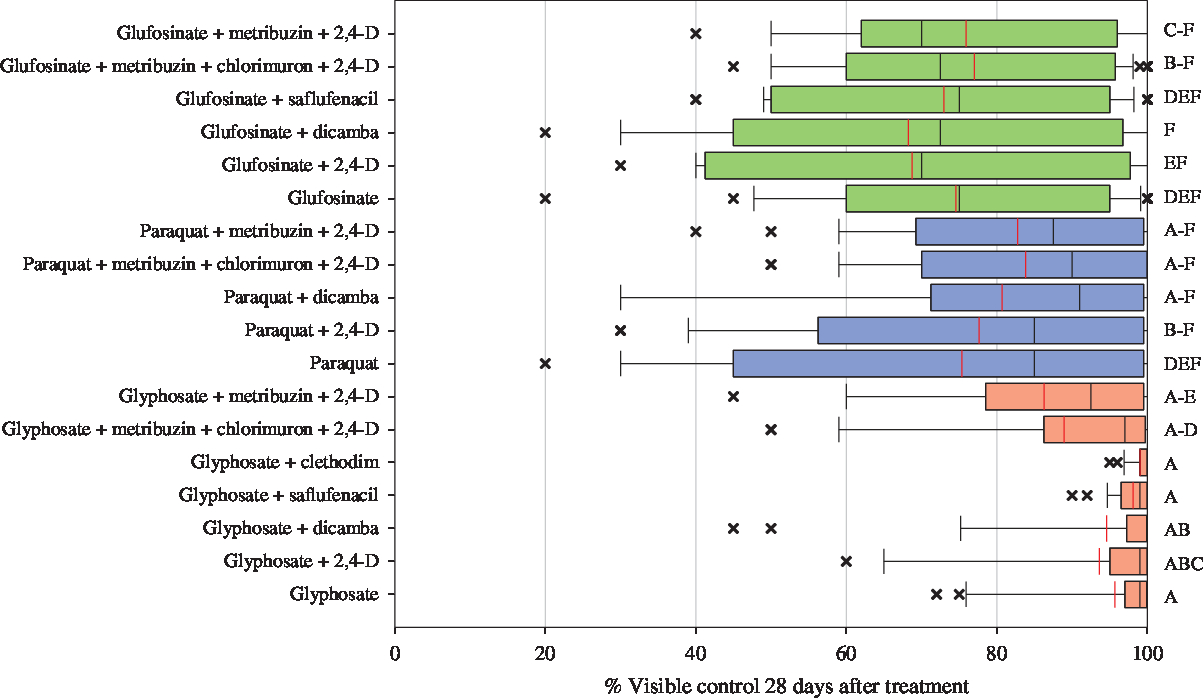
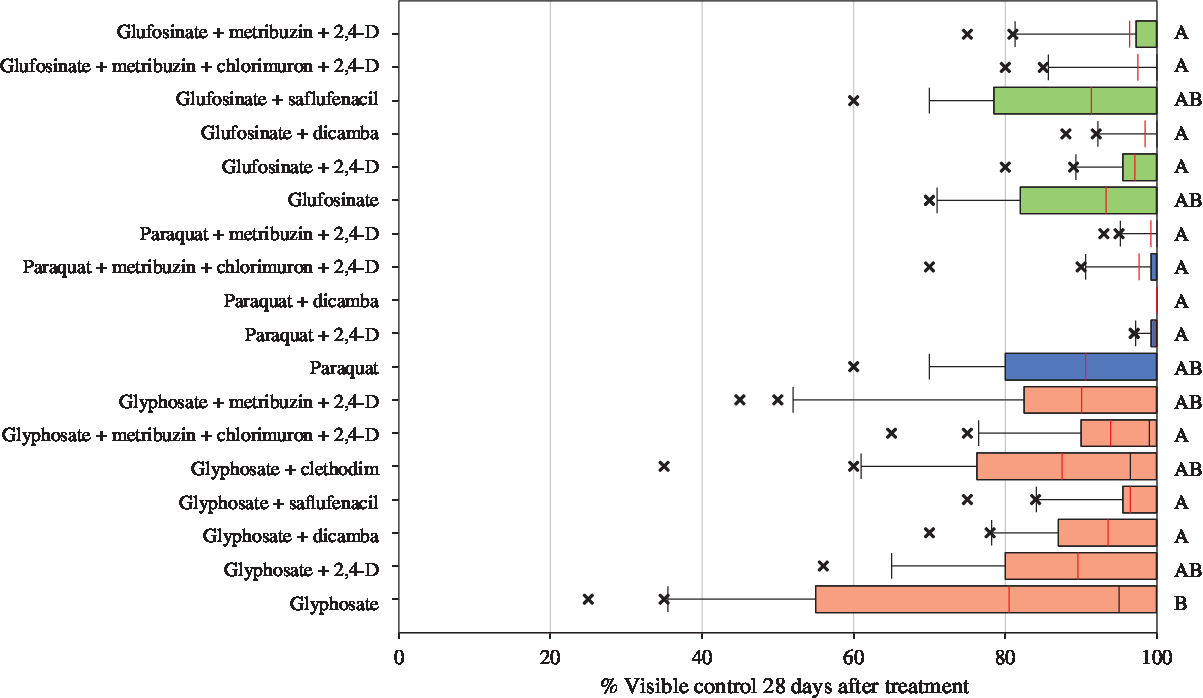
Annual ryegrass control was observed to be much more variable with almost all herbicide treatments, compared with cereal rye (Figure 2). This is consistent with results from Cornelius and Bradley (Reference Cornelius and Bradley2017a), who reported greater variability in annual ryegrass control between herbicide treatments and application timings compared with other grass cover crop species. Treatments of glyphosate applied alone and in combination with clethodim, saflufenacil, dicamba, and 2,4-D; paraquat applied alone and paraquat in all combinations; and glufosinate applied with metribuzin plus 2,4-D and metribuzin plus chlorimuron plus 2,4-D were most effective, providing 76% to 94% annual ryegrass control (Figure 2). Paraquat-containing treatments resulted in 77% to 85% annual ryegrass control, whereas glufosinate-containing treatments provided 57% to 80% control. Previous trials examining annual ryegrass control used higher glyphosate rates than we did in the present study and reported higher levels of control. Across three application timings, Cornelius and Bradley (Reference Cornelius and Bradley2017a) reported glyphosate at 1.4 kg ha−1 plus clethodim at 0.136 kg ha−1 and glyphosate at 2.8 kg ha−1 provided greater than 90% annual ryegrass control. There were no differences in annual ryegrass BR (data not shown). Annual ryegrass BR was variable probably because of differences in data from various locations when pooled together.
Average annual ryegrass control across 8 site-years. Mean control lines in red with the same letter are not significantly different, based on Tukey’s honestly significant difference test (P < 0.05). The box represents the middle 50% of the data set, whereas the left and right whiskers represent 25% and 75% of the data set, respectively. X denotes an outlier; black bar within box denotes the median.

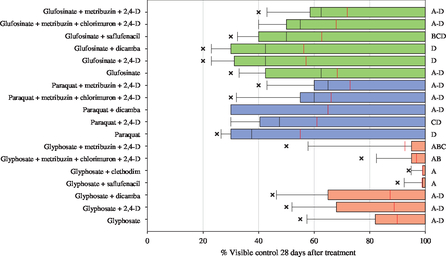
Across all herbicide treatments, winter wheat control ranged from 68% to 99%, with glyphosate-containing treatments providing greater control than paraquat- and glufosinate-containing treatments (Figure 3). Treatments consisting of glyphosate alone or with metribuzin plus 2,4-D, metribuzin plus chlorimuron plus 2,4-D, clethodim, saflufenacil, dicamba, or 2,4-D; and paraquat applied with metribuzin plus 2,4-D, metribuzin plus chlorimuron plus 2,4-D or dicamba provided the most effective control (81% to 99%) of winter wheat (Figure 3). Similar to results from Cornelius and Bradley (Reference Cornelius and Bradley2017a), we found adding metribuzin plus chlorimuron to glyphosate reduced winter wheat control compared with glyphosate alone, though the difference was not significant in this study. Glufosinate-containing treatments provided control of 68% to 77%, and control with paraquat-containing treatments was 75% to 84% (Figure 3). These results are similar to those of Palhano et al. (Reference Palhano, Norsworthy and Barber2018), who reported that wheat control was most effective with glyphosate-containing treatments, followed by paraquat- and then glufosinate-containing treatments. Cornelius and Bradley (Reference Cornelius and Bradley2017a) reported glyphosate alone or applied with 2,4-D, dicamba, saflufenacil, or atrazine resulted in greater than 91% winter wheat control. There was no treatment separation in wheat BR data (data not shown).
Average winter wheat control across 7 site-years. Mean control lines in red with the same letter are not significantly different, based on Tukey’s honestly significant difference test (P < 0.05). The box represents the middle 50% of the data set, whereas the left and right whiskers represent 25% and 75% of the data set, respectively. X denotes an outlier; black bar within box denotes the median.

Triticale control was most effective with glyphosate-containing treatments (87% to 99%) (Figure 4). There was more variability among paraquat- and glufosinate-containing treatments. Triticale control with glufosinate-containing treatments ranged from 56% to 72%, and paraquat-containing treatments provided 56% to 72% control. Similar to BR results with the other grass species, no differences among treatments were detected for triticale (data not shown). Variability in BR data from different locations likely caused no treatment separation when pooled together.
Average triticale control across 6 site-years. Mean control lines in red with the same letter are not significantly different, based on Tukey’s honestly significant difference test (P < 0.05). The box represents the middle 50% of the data set, whereas the left and right whiskers represent 25% and 75% of the data set, respectively. X denotes an outlier; black bar within box denotes the median.

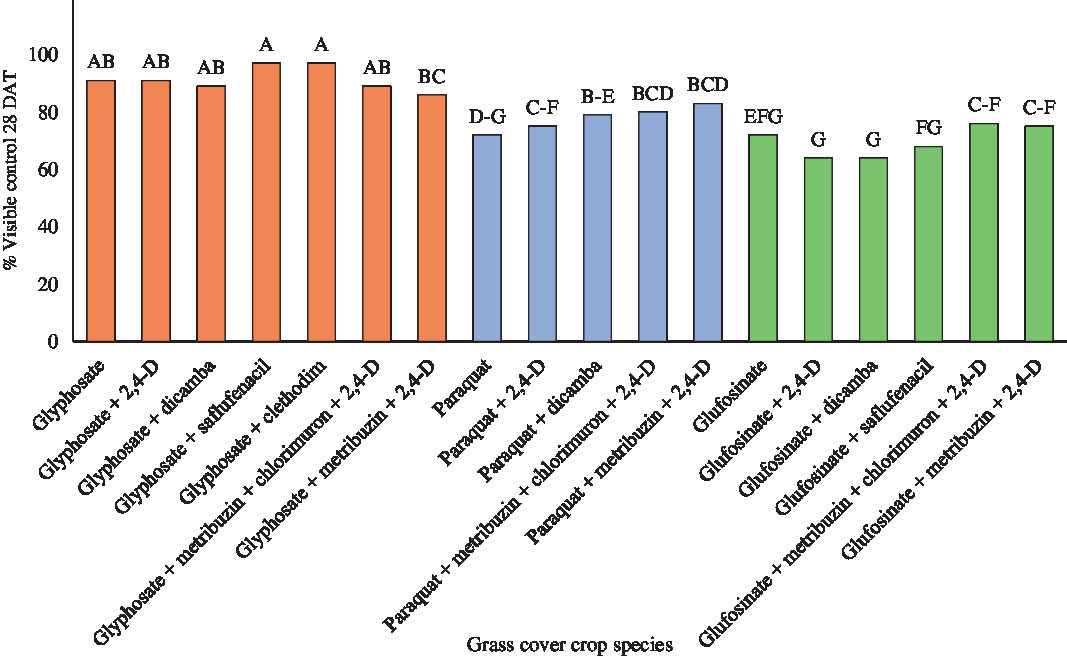
Termination across all grass species was highest with glyphosate-containing treatments (Figure 5). When averaged across all grass cover crop species, greater than 91% control was achieved with glyphosate plus clethodim, glyphosate plus saflufenacil, glyphosate plus 2,4-D, and glyphosate alone (Figure 5). These results are similar to those of Cornelius and Bradley (Reference Cornelius and Bradley2017a) and Palhano et al. (Reference Palhano, Norsworthy and Barber2018), who found that winter wheat, cereal rye, and annual ryegrass were most consistently controlled with glyphosate-containing treatments. All glyphosate-containing treatments, except for glyphosate plus metribuzin plus 2,4-D, provided greater levels of control than glufosinate- or paraquat-containing treatments (Figure 5). Glufosinate-containing treatments, specifically glufosinate plus 2,4-D, glufosinate plus dicamba and glufosinate plus saflufenacil, provided the lowest levels of control (64% to 68%), along with paraquat along (75%) (Figure 5). Several authors have reported that glyphosate consistently provides more effective control of annual grass species compared with glufosinate (Culpepper et al. Reference Culpepper, York, Batts and Jennings2000; Riar et al. Reference Riar, Norsworthy and Griffith2011; Whitaker et al. Reference Whitaker, York, Jordan and Culpepper2011). Across grass species, paraquat-containing treatments provided 72% to 83% control (Figure 5).
Average control of grass cover crop species across 8 site-years in Arkansas, Indiana, Mississippi, Missouri, and Wisconsin. Bars with the same letter are not different, based on Tukey’s honestly significant difference test (P < 0.05). Abbreviation: DAT, days after treatment.

Broadleaf Cover Crop Species
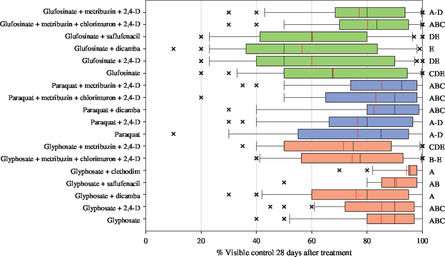
Herbicide treatments for hairy vetch control ranged from 80% to 100% (Figure 6). All treatments that included dicamba or 2,4-D provided greater than 98% control (Figure 6). In addition, all glufosinate-containing treatments provided at least 93% control. Paraquat alone was not as effective as tank mixtures. Likewise, glyphosate alone or tank mixed with clethodim was not as effective as other glyphosate-containing treatments. These results are consistent with those of Cornelius and Bradley (Reference Cornelius and Bradley2017a), who reported that glyphosate and paraquat applied in early April provided only 73% and 54% control, respectively. Palhano et al. (Reference Palhano, Norsworthy and Barber2018) used lower glyphosate rates (0.87 kg ha−1) and reported only 56% hairy vetch control. Our results with 2,4-D and dicamba are similar to those of other authors who reported good to excellent hairy vetch control with 2,4-D- or dicamba-containing treatments (Curran et al. Reference Curran, Wallace, Mirsky and Crockett2015; White and Worsham Reference White and Worsham1990). No differences between treatments were observed for BR.
Average hairy vetch control across 8 site-years. Mean control lines in red with the same letter are not significantly different, based on Tukey’s honestly significant difference test (P < 0.05). The box represents the middle 50% of the data set, whereas the left and right whiskers represent 25% and 75% of the data set, respectively. X denotes an outlier; black bar within box denotes the median.

Austrian winter pea visible control ranged from 81% to 100% (Figure 7). Glyphosate applied alone provided less Austrian winter pea control than most treatments containing 2,4-D or dicamba. Cornelius and Bradley (Reference Cornelius and Bradley2017a) also reported effective Austrian winter pea control with treatments containing either dicamba or 2,4-D. Palhano et al. (Reference Palhano, Norsworthy and Barber2018) also reported glyphosate only was not as effective for Austrian winter pea control as most treatments containing dicamba or 2,4-D.
Average Austrian winter pea control across 5 site-years. Mean control lines in red with the same letter are not significantly different, based on Tukey’s honestly significant difference test (P < 0.05). The box represents the middle 50% of the data set, whereas the left and right whiskers represent 25% and 75% of the data set, respectively. X denotes an outlier; black bar within box denotes the median.

Crimson clover was included at only 3 site-years. There were no treatment differences for Crimson clover control (data not shown). Crimson clover biomass was reduced most effectively with all treatments containing glufosinate or paraquat and glyphosate applied in combination with metribuzin plus 2,4-D, metribuzin plus chlorimuron plus 2,4-D, saflufenacil, or dicamba (Figure 8). These results are similar to those of Cornelius and Bradley (Reference Cornelius and Bradley2017a), who reported glyphosate applied with 2,4-D, dicamba, or saflufenacil provided 90% to 92% crimson clover control. However, these results differ from research reporting glyphosate plus 2,4-D, dicamba, or saflufenacil provided less than 80% crimson clover control (Palhano et al. Reference Palhano, Norsworthy and Barber2018; White and Worsham Reference White and Worsham1990). White and Worsham (Reference White and Worsham1990) reported crimson clover control was greatest with treatments containing paraquat.
Average biomass reduction of crimson clover across 3 site-years. Mean control lines in red with the same letter are not significantly different, based on Tukey’s honestly significant difference test (P < 0.05). The box represents the middle 50% of the data set, whereas the left and right whiskers represent 25% and 75% of the data set, respectively. X denotes an outlier; black bar within box denotes the median. Biomass reduction was calculated by dividing the differences between the treated and nontreated plots by the nontreated plot values.

Turnip control was generally more effective with treatments that included 2,4-D or dicamba, compared with those without (Figure 9). Paraquat alone was the least effective treatment for terminating turnip, providing only 53% control. No previous reports of turnip control were located in the literature, so no comparisons can be made.
Average turnip control across 2 site-years. Mean control lines in red with the same letter are not significantly different, based on Tukey’s honestly significant difference test (P < 0.05). The box represents the middle 50% of the data set, whereas the left and right whiskers represent 25% and 75% of the data set, respectively. X denotes an outlier; black bar within box denotes the median.

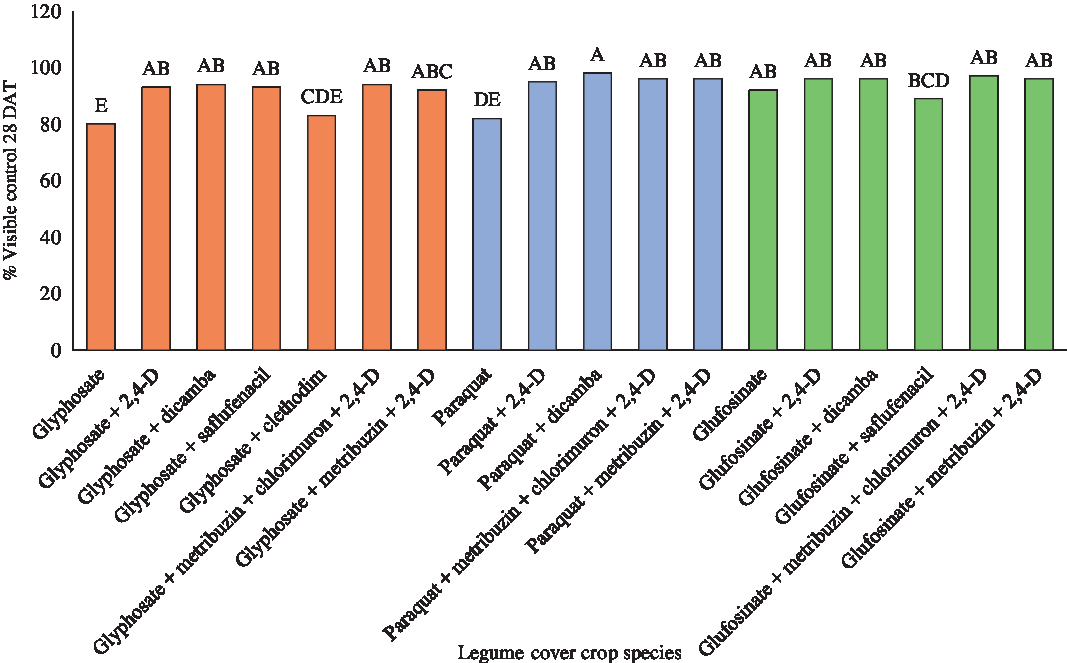
Across all legume cover crop species, paraquat alone; glyphosate applied alone or in combination with clethodim; and glufosinate plus saflufenacil provided less than 89% control (Figure 10). All other herbicide treatments provided at least 91% control. Treatments that included dicamba or 2,4-D were generally most effective on broadleaf cover crop species. This trend was also reported by Cornelius and Bradley (Reference Cornelius and Bradley2017a), who found that broadleaf cover crop termination was generally improved by adding 2,4-D or dicamba. Palhano et al. (Reference Palhano, Norsworthy and Barber2018) reported that Austrian winter pea, crimson clover, and hairy vetch were best controlled by paraquat at 0.56 kg ha−1 plus metribuzin at 0.56 kg ha−1. Glyphosate applied alone was the least effective treatment across all broadleaf cover crop species, with average control of only 80% (Figure 10).
Average control of broadleaf cover crop species across 8 site-years in Arkansas, Indiana, Mississippi, Missouri, and Wisconsin. Bars with the same letter are not different, based on Tukey’s honestly significant difference test (P < 0.05). Abbreviation: DAT, days after treatment.

Practical Implications
Effective cover crop termination prior to soybean planting is essential to avoid competition for crucial resources for crop growth. Herbicides are effective and feasible for cover crop termination when cover crop species are in their vegetative stages. Just as weeds are best controlled when they are small and actively growing, so too are cover crop species. The results from these experiments indicate that grass cover crop species are most effectively terminated with glyphosate-containing herbicide treatments, specifically glyphosate plus saflufenacil and glyphosate plus clethodim, which provided consistent control across grass species. Treatments containing dicamba or 2,4-D in combination with glyphosate, glufosinate, or paraquat are generally more effective on broadleaf cover crop species. However, broadleaf species results were not as consistent as grass species. Growers should take into account the ease of termination when selecting cover crop species, because the control of certain species like annual ryegrass can be much more difficult and inconsistent across a broad geography (Figure 2).
Acknowledgements
The authors thank the United Soybean Board for funding. For their hard work and assistance to this project, the authors also thank all individuals who took part in data collection. No conflicts of interest have been declared.