Implications
The confirmation that QTL affecting nematode resistance are segregating in several breeds widens their potential applicability to British sheep industry. In the past, difficulties in collecting faecal egg count's phenotypes in the field have made it a challenge to routinely implement nematode resistance in selection programmes. Our results may assist with the implementation of marker-assisted selection when selecting for nematode resistance. This also paves the way for further study to identify single nucleotide polymorphisms (SNPs) in population wide linkage disequilibrium with the causative mutations, or SNPs, which themselves are the causative mutations.
Introduction
Gastrointestinal parasites remain a major health challenge for pasture-based sheep production systems, and the annual costs of gastrointestinal parasite (nematode) infections to the British sheep industry have been estimated at ca. £84 million (Nieuwhof and Bishop, Reference Nieuwhof and Bishop2005). Breeding for nematode resistance in sheep has been proposed as a sustainable method for assisting in the control of nematode infections in grazing sheep, for example, Bishop and Stear (Reference Bishop and Stear2001), particularly with increasing anthelmintic resistance problems. Most of the current breeding programmes for nematode resistance are based on indicator traits, especially faecal egg counts (FEC), which are costly and laborious to collect. Hence, genetic markers for resistance would be advantageous. Although some quantitative trait loci (QTL) have been identified, these QTL are often not consistent across breeds and few breeding strategies for nematode resistance in sheep are currently using molecular information.
Previous studies conducted at Roslin Institute (Davies et al., Reference Davies, Stear, Benothman, Abuagob, Kerr, Mitchell and Bishop2006), using Blackface sheep, identified regions of particular interest in ovine chromosomes (OAR) 3, 14 and 20. The regions on OAR3 and OAR20 are two of the few QTL for nematode resistance that are common across several studies (Buitkamp et al., Reference Buitkamp, Feichtlbauer-Huber and Stear1999; Coltman et al., Reference Coltman, Wilson, Pilkington, Stear and Pemberton2001; Charon et al., Reference Charon, Moskwa, Rutkowski, Gruszczynska and Swiderek2002; Crawford et al., Reference Crawford, Paterson, Dodds, Tascon, Williamson, Thomson, Bisset, Beattie, Greer, Green, Wheeler, Shaw, Knowler and McEwan2006; Beraldi et al., Reference Beraldi, McRae, Gratten, Pilkington, Slate, Visscher and Pemberton2007). Furthermore, these regions contain plausible candidate genes, namely, interferon-γ (IFNG) and possibly genes located in the major histocompatibility complex, respectively. The region on OAR14 has only been observed in Blackface sheep (Davies et al., Reference Davies, Stear, Benothman, Abuagob, Kerr, Mitchell and Bishop2006), although another OAR14 FEC QTL was reported in Spanish milk sheep (Gutierrez-Gil et al., Reference Gutierrez-Gil, Perez, Alvarez, Martinez-Valladares, de la Fuente, Bayon, Meana, San Primitivo, Rojo-Vazquez and Arranz2009). The region described by Davies et al. (Reference Davies, Stear, Benothman, Abuagob, Kerr, Mitchell and Bishop2006) contains interferon regulatory factor (IRF3), a toll-like receptor (TLR)-related gene. As reported by Jann et al. (Reference Jann, King, Corrales, Anderson, Jensen, Ait-ali, Tang, Wu, Cockett, Archibald and Glass2009), IRF3 is located in QTL regions affecting health traits in five species (human, mouse, pig, cattle and sheep) and, as such, is a plausible candidate gene for our QTL on OAR14.
In this study, we wish to explore the two QTL of those described above that we consider more likely to contribute to nematode resistance breeding programmes, namely those on OAR3 and OAR14. The aim is to determine whether QTL in these regions are also segregating in the two most important terminal sire breeds in the United Kingdom, namely the Texel and Suffolk breeds. The rationale for this study is that consistency of QTL across breeds would markedly improve the prospects of ultimately using genetic markers for nematode resistance.
Material and methods
Animals sampled
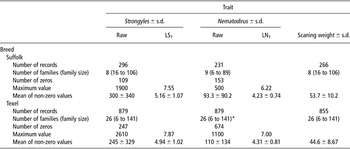
Commercial Suffolk and Texel sheep with performance and pedigree records were sampled from 2005 and 2006 from terminal sire breeder flocks in the United Kingdom. Animals targeted for FEC sampling were part of a larger study exploring the use of markers in commercial sheep flocks (Matika et al., Reference Matika, Sechi, Pong-Wong, Houston, Clop, Woolliams and Bishop2010). Initially, 335 Suffolk records in 13 half-sib families and 927 Texel in 26 half-sib families were available after correcting for Mendelian genotyping errors (Table 1). After further editing based on family size, the Suffolk and Texel data sets were reduced to 296 records from nine half-sib families and 879 records in 26 half-sib families, respectively. A summary of the data used is given in Table 1. DNA was extracted from a blood sample collected from each animal. In addition, all animals had measurements for live weight at 8 weeks, and muscle and fat depth measured ultrasonically over the 3rd lumbar and weight at scanning (ca. 20 weeks of age). These performance trait data were all normally distributed.
Summary statistics of FEC and scanning weight and their s.d. in the Suffolk and Texel sheep data

FEC = faecal egg counts; LS1 = ln(Strongyles FEC + 1); LN1 = ln(Nematodirus FEC + 1).
*Twenty half-sib families (12 to 141 progeny) were used in the regression analysis with six families being excluded due to small family size.
Parasitological phenotypes
Faecal samples were collected from the rectum of the lambs at approximately 20 weeks of age. Sheep breeders sent the samples directly to a commercial laboratory for FEC assays using well-established identification criteria based on egg size and morphology. On these samples, FEC were measured using the modified McMaster technique (Whitlock, Reference Whitlock1948) with a lower detection limit of 50 eggs per gram (epg) of faeces for the 2005 samples, and the FECPAK assay method (http://www.fecpak.com; see McCoy et al., Reference McCoy, Edgar, Kenny, Gordon, Dawson and Carson2005; Coles et al., Reference Coles, Jackson, Pomroy, Prichard, von Samson-Himmelstjerna, Silvestre, Taylor and Vercruysse2006) with a lower detection limit of 30 epg was used for the 2006 samples.
Parasite eggs were classified according to whether they were Nematodirus spp. or other nematodes collectively termed Strongyles. The Strongyles potentially include the following nematode genera: Oesophagostomum, Chabertia, Bunostomum, Trichostrongylus, Cooperia, Ostertagia, Teladorsagia and Haemonchus. The egg counts for Nematodirus spp. were recorded separately, as the biology of this parasite differs from other Strongyles.
The Nematodirus and Strongyles FEC data were right skewed and normalised using logarithmic transformation (LFEC = ln(FEC + x), where x is a constant used to avoid zero values. We explored values of x of 1 or 15, that is, ca. half the measurement increment for the trait, to give LFEC1 and LFEC15. Log-transformed Nematodirus and Strongyles FEC values will thereafter be referred to as LN1, LN15, LS1 and LS15, respectively. Furthermore, because of the large proportion of zero FEC values, FEC was also analysed as a binary trait (0 or 1) to give traits Sbin and Nbin.
Some flocks showed no evidence for nematode infestation at the time of sampling, that is, all animals had a zero count for either Nematodirus or Strongyles FEC. When this happened all animals from the flock were eliminated from the analysis of the FEC category with zero values.
Genotyping
Genotyping was done using multiplex microsatellite panels developed around the regions identified in the previous studies on OAR3 and OAR14 in Blackface sheep (Davies et al., Reference Davies, Stear, Benothman, Abuagob, Kerr, Mitchell and Bishop2006). This comprised a panel of seven microsatellite markers (KD103, BL4, IFNG, MAF23, CSRD111, BM6433 and BM8230) around the distal end of OAR3 and five microsatellite markers on OAR14 (INRA63, CSAP27, CSRD63, LSCV30 and BM6507). All microsatellite information is available at the ‘Australian Sheep Gene Mapping website’ (http://rubens.its.unimelb.edu.au/~jillm/jill.htm).
Statistical analyses for QTL verification
The relative marker order and position were verified using CRI-MAP (Green et al., Reference Green, Falls and Crooks1990). QTL analyses were initially performed by half-sib regression interval mapping techniques (Knott et al., Reference Knott, Elsen and Haley1996) using GridQTL software (Seaton et al., Reference Seaton, Hernandez, Grunchec, White, Allen, De Koning, Wei, Berry, Haley and Knott2006). At each position of the chromosome region in question, a QTL effect within family is included into the model by regressing the offspring phenotypes on to their inheritance probabilities. To test if a QTL is segregating at a given position, an F-ratio of the full model including the QTL effect is calculated across all families and the location of the putative QTL is assigned to the position with the largest F-value. The 5% chromosome region-wide significance was calculated by permutations testing using at least 5000 permutations (Churchill and Doerge, Reference Churchill and Doerge1994). Breeds were analysed separately, but within each breed all families were analysed simultaneously. Other effects fitted in each analysis included flock, year, sex, litter size born and/or reared and age of ewe. In cases where significant QTL were detected, further models were fitted to test the hypothesis of multiple QTL. The proportion of phenotypic variance due to QTL was estimated as 4(1 − MSfull/MSreduced) (Knott et al., Reference Knott, Elsen and Haley1996) where MS is the residual mean square. In cases where a significant QTL was identified, QTL segregation in individual families was declared significant when, for that family, the test statistic (Student's t-value ) for the allelic substitution effect was >2.0. With random mating and Hardy Weinberg equilibrium, the allelic substitution effect would be equivalent to a + d(1 − 2p) where a and d are additive and dominance effects and p is the frequency of the favourable allele (Falconer and Mackay, Reference Falconer and Mackay1997).
Interval mapping QTL analysis using the OAR3 and OAR14 markers was also used to test for evidence for QTL for growth and carcass traits, as these phenotypes were also available for all the animals. The same statistical models were used as for the FEC data.
Variance component analysis (VCA) using ASREML software (Gilmour et al., Reference Gilmour, Gogel, Cullis and Thompson2009) was carried out in the Texel data, this data set being sufficiently large for this analytical approach. This basic mixed linear model comprised the fixed effects described above and a random effect describing additive polygenic variation. To test for the presence of a QTL, a random term for an additive QTL was included in the basic model as follows:

where y is the vector of phenotypes with β, u, vq and e being vectors of fixed effects, additive polygenic, additive QTL effects and residuals, respectively, with incidence matrices X and Z. The terms u, vq and e were assumed to be multivariate, normally distributed: N(0,Aσ2a), N(0,Gσ2vq) and N(0,Iσ2e), respectively. Here A is the numerator relationship matrix and G is the identity-by-descent matrix estimated by a Markov chain Monte Carlo using the Loki program (Heath, Reference Heath1997) calculated for a putative QTL position.
QTL detection in the VCA method was carried out by calculating G at 1 cM intervals and the best estimate of the QTL position was assumed to be at the peak likelihood within the tested region. The significance of the QTL was tested using a log likelihood ratio test (LRT), comparing the QTL model with an equivalent model without a QTL. The test statistic was −2[lnL(QTL) − lnL(no QTL)] where L() is the likelihood of each model. Critical values for the LRT were taken from  χ 2(1) (Self and Liang, Reference Self and Liang1987) since the null hypothesis represents a boundary value for the variance component.
Results
Marker map order
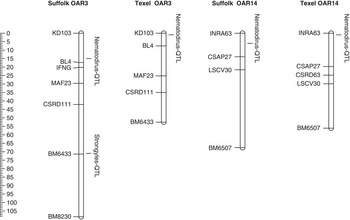
Two microsatellite markers (IFNG and BM8230) on OAR3 were observed to be monomorphic during panel development and were subsequently dropped from the panel used for further genotyping. The map order calculated for OAR3 using CRI-MAP software (Green et al., 1990) was the same as that published on the Australian website for both the Suffolk and Texel sheep. However, the calculated map order for OAR14 was not the same for markers LSCV30 and CSRD63 in the Suffolk sheep. A map with four markers only was subsequently used after omitting marker CSRD63 since its inclusion gave an abnormal QTL profile for the Suffolk animals. The calculated linkage maps (Green et al., Reference Green, Falls and Crooks1990) were graphically represented using the software developed by Voorrips (Reference Voorrips2002), and their genetic distances (cM) are presented in Figure 1. In addition, shown are the locations of the QTL detected using regression analyses.
Best estimated positions of the genotyped markers on the Suffolk and Texel sheep linkage map.

QTL for Nematodirus FEC from regression analyses
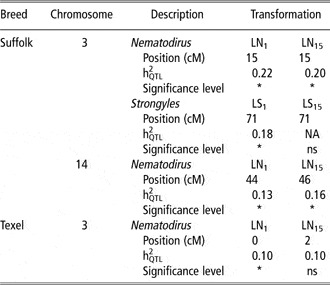
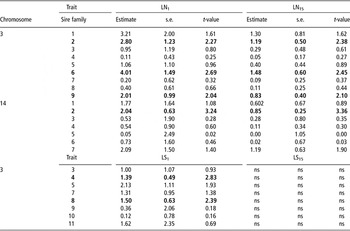
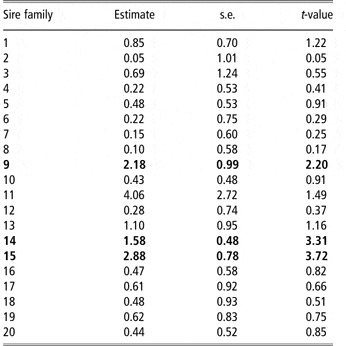
QTL for Nematodirus FEC were found to be segregating on OAR3 at 5% chromosome region-wide significance threshold in both Suffolk and Texel sheep (Table 2). Three out of nine Suffolk half-sib families were segregating for the Nematodirus OAR3 FEC QTL with estimated allelic substitution effects (Falconer and Mackay, Reference Falconer and Mackay1997) ranging from 2.01 to 4.01 (log-transformed FEC units) for LN1 and LN15 (Table 3) in these families. In the Texel breed, the Nematodirus OAR3 QTL was also segregating in three families, and the estimates of allelic substitution varied from 1.58 to 2.88 for LN1 in segregating families (Table 5).
Summary statistics from QTL regression analyses for FEC on OAR3 and OAR14 in the Suffolk and Texel sheep populations

QTL = quantitative trait loci; FEC = faecal egg counts; OAR = ovine chromosome; LN1 = ln(Nematodirus FEC + 1); LN15 = ln(Nematodirus FEC + 1); LS1 = ln(Strongyles FEC + 1); LS15 = ln(Strongyles FEC + 1); NA = not applicable; MS = residual mean square.
h2QTL was calculated as 4(1 − MSfull/MSreduced; Knott et al., Reference Knott, Elsen and Haley1996).
*Denotes the 5% region-wide significance level.
Estimated OAR3 and OAR14 QTL allelic substitution effects for log-transformed Nematodirus FEC (LN1 and LN15) and Strongyles FEC (LS1 and LS15) in Suffolk sheep

OAR = ovine chromosome; QTL = quantitative trait loci; FEC = faecal egg counts; LN1 = ln(Nematodirus FEC + 1); LN15 = ln(Nematodirus FEC + 1); LS1 = ln(Strongyles FEC + 1); LS15 = ln(Strongyles FEC + 1).
ns indicates that there is no evidence of a QTL segregating. Values shown in bold are nominally significant (t > 2.0). All allelic substitution effects are in log-transformed FEC units.
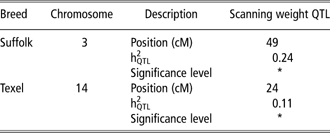
Summary statistics from QTL regression analyses for scanning weight on OAR3 and OAR14 in the Suffolk and Texel sheep populations

QTL = quantitative trait loci; OAR = ovine chromosome; MS = residual mean square.
h2QTL was calculated as 4(1 − MSfull/MSreduced; Knott et al., Reference Knott, Elsen and Haley1996).
*Denotes the 5% region-wide significance level.
Estimated OAR3 QTL allelic substitution effects for log-transformed Nematodirus FEC (LN1) in Texel sheep

OAR = ovine chromosome; QTL = quantitative trait loci; FEC = faecal egg counts; LN1 = ln(Nematodirus FEC + 1).
Values shown in bold are nominally significant (t > 2.0). All allelic substitution effects are in log-transformed FEC units.
On OAR14, we found a Nematodirus QTL segregating in the Suffolk breed at the 5% chromosome region-wide significance (Table 2). This QTL was attributable to a single half-sib family, with an estimated allelic substitution effect of 2.04 for LN1 and 0.85 for LN15 (Table 3) and it explained 0.13 to 0.16 of the phenotypic variation depending on the transformation.
QTL for Strongyles FEC from regression analyses
Of the eight Suffolk half-sib families analysed for Strongyles FEC, two were identified as segregating for a Strongyles OAR3 QTL, with estimates of allelic substitution effects being 1.39 and 1.50 for LS1 (Table 3). Further analysis, in one large Suffolk half-sib family with 106 progeny, identified two putative Strongyles OAR3 FEC QTL segregating at 5% chromosome region-wide when a two QTL model was fitted (data not shown). These QTL mapped to two different positions (0 v. 88 cM) with allele substitution of 0.87 ± 0.38 and 1.92 ± 0.74, with both QTL significantly (P < 0.05) different from zero.
QTL for other traits from regression analyses
In the Texel breed, we also identified a scanning weight QTL segregating at 5% chromosome region-wide on OAR14 (Table 4). The QTL was significant in four families and the estimated allelic substitution effects ranged from 2.32 to 7.50 kg. In the Suffolk sheep, a QTL for scanning weight was found segregating at 5% chromosome region-wide on OAR3.
VCA analyses
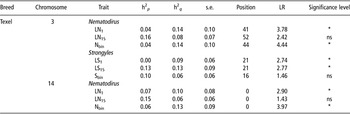
The results of VCA for FEC traits in the Texel sheep are presented in Table 6, including results for the binary traits. In agreement with the regression analyses, there was evidence for a Nematodirus FEC QTL segregating at 5% chromosome region-wide level, depending on trait definition, on both OAR3 and OAR14. The Strongyles FEC QTL segregated at 5% chromosome region-wide level on OAR3 in contrast to the regression analyses where no significant QTL was seen for this trait. The proportion of phenotypic variance explained by the QTL varied from 0.08 to 0.14 and 0.06 to 0.13 for the Nematodirus FEC QTL and Strongyles FEC QTL, respectively, depending on the transformation.
VCA for Nematodirus and Strongyles FEC in Texel sheep

VCA = variance component analysis; FEC = faecal egg counts; h2p = estimate of polygenic heritability; h2q = estimate of the QTL heritability; LR = log likelihood ratio; LN1 = ln(Nematodirus FEC + 1); LN15 = ln(Nematodirus FEC + 1); LS1 = ln(Strongyles FEC + 1); LS15 = ln(Strongyles FEC + 1).
Position is the QTL position on the chromosome segment (cM), LR is −2[lnL(QTL) − lnL(no QTL)] and significance level is given by the critical values taken from  χ 2(1) (Self and Liang, Reference Self and Liang1987). Nbin and Sbin are Nematodirus and Strongyles FEC expressed as binary traits, that is, presence or absence of eggs.
Discussion
Although mixed parasite infections can cause challenges for statistical analyses and interpretation, such data from grazing conditions are also a strength as this is the natural challenge faced by sheep, and hence represent the conditions under which genetic improvement of parasite resistance will take place. Natural mixed species nematode infections in the United Kingdom are complex. Generally, these infections may comprise the following genera: Trichostrongylus, Cooperia, Bunostomum, Ostertagia, Teladorsagia, Haemonchus and Nematodirus spp. (Stear et al., Reference Stear, Bairden, Bishop, Gettinby, McKellar, Park, Strain and Wallace1998), although their composition are likely to vary with regional climate and pasture management practices. However, some notable features are apparent, for example, larval stages of Nematodirus have been reported to be more pathogenic than the adult worms, unlike Strongyles infections where the adult worm is considered important (McKenna, Reference McKenna1981). This aspect of their biology, combined with the fact that Nematodirus and Strongyles eggs are visually separable, led us to treat Nematodirus and Strongyles FEC as separate traits.
Lower FEC for Nematodirus than for Strongyles in our study (Table 1) are consistent with those reported elsewhere (Bishop et al., Reference Bishop, Jackson, Coop and Stear2004; Davies et al., Reference Davies, Stear, Benothman, Abuagob, Kerr, Mitchell and Bishop2006; Salle G. and Bishop SC, 2007 unpublished results), although both types of FEC are heritable. Reported genetic correlations between Nematodirus and Strongyles FEC are invariably positive and moderate to strong, ranging from 0.49 to 0.93, across a range of environments and breeds (Bishop et al., Reference Bishop, Jackson, Coop and Stear2004; Morris et al., Reference Morris, Bisset, Vlassoff, West and Wheeler2004; Wolf et al., Reference Wolf, Howells, Nakielny, Haresign, Lewis, Davies and Davies2008). These estimated genetic correlations imply some common genetic mechanisms responsible for resistance to Strongyles and Nematodirus; hence, it may be hypothesised that some of the QTL underlying genetic variation in Nematodirus and Strongyles FEC may be in common. However, in this study, no families had segregating QTL for both Nematodirus and Strongyles FEC. In addition, the Nematodirus FEC QTL and Strongyles FEC QTL on OAR3 in the Suffolk breed mapped to positions 15 and 71 cM, respectively, and the QTL segregated in different families for these two traits. This suggests that these are probably two separate QTL.
Our results confirm that QTL for both Nematodirus and Strongyles FEC on OAR3, observed in Blackface sheep (Davies et al., Reference Davies, Stear, Benothman, Abuagob, Kerr, Mitchell and Bishop2006), are also segregating in the Suffolk and Texel breeds. These QTL were observed despite the fact that our data were from natural infections collected on several commercial flocks across the United Kingdom, with the nature of the mixed species parasite challenge expected to differ across flocks. We also confirmed the Nematodirus FEC QTL on OAR14, using the regression methods, in the Suffolk sheep but not in the Texel sheep. However, using all the pedigree relationships with VCA methodology, a similar QTL was also found to be segregating in the Texel breed. The use of all available pedigree relationship information in the VCA approach may have resulted in more power to detect Strongyles FEC QTL on OAR3 and Nematodirus FEC QTL on OAR14. However, it should be noted that the estimated QTL heritabilities are often larger than the polygenic heritabilities, suggesting that the QTL effects are somewhat overestimated.
The published studies for OAR3 QTL affecting FEC include naturally infected, experimental Blackface sheep (Davies et al., Reference Davies, Stear, Benothman, Abuagob, Kerr, Mitchell and Bishop2006), unmanaged Soay sheep predominantly parasitised by Teladorsagia circumcincta (Coltman et al., Reference Coltman, Wilson, Pilkington, Stear and Pemberton2001) and by coccidia (Beraldi et al., Reference Beraldi, McRae, Gratten, Pilkington, Slate, Visscher and Pemberton2007), Trichostrongylus colubriformis in divergent lines of nematode resistant selected sheep (Beh et al., Reference Beh, Callaghan, Hulme, Leish, Diienno and Lenane1998 and Reference Beh, Hulme, Callaghan, Leish, Lenane, Windon and Maddox2002), Haemonchus contortus on OAR3 and OAR14 (among others; Beh et al., Reference Beh, Callaghan, Hulme, Leish, Diienno and Lenane1998) and natural challenge in Romney selection lines (Paterson et al., Reference Paterson, McEwan, Dodds, Morris and Crawford2001). Although a QTL on OAR3 appears to be a common finding across studies, not all have been in the same segment and some large-scale studies (e.g. Crawford et al., Reference Crawford, Paterson, Dodds, Tascon, Williamson, Thomson, Bisset, Beattie, Greer, Green, Wheeler, Shaw, Knowler and McEwan2006) have failed to find any evidence on chromosome 3. Although no causative mutation has been identified for the FEC OAR3 QTL, the effect is often presumed to be mediated through INFG in sheep (Stear et al., Reference Stear, Boag, Cattadori and Murphy2009).
Two QTL studies have reported an OAR14 FEC QTL, one in Blackface sheep (Davies et al., Reference Davies, Stear, Benothman, Abuagob, Kerr, Mitchell and Bishop2006) and the other in lactating Spanish milk sheep (Gutierrez-Gil et al., Reference Gutierrez-Gil, Perez, Alvarez, Martinez-Valladares, de la Fuente, Bayon, Meana, San Primitivo, Rojo-Vazquez and Arranz2009), but the QTL positions were different in these two studies and neither study suggested any possible candidate genes underlying the QTL. Recently, however, in a comparative genomics study of TLR signalling in five species, Jann et al. (Reference Jann, King, Corrales, Anderson, Jensen, Ait-ali, Tang, Wu, Cockett, Archibald and Glass2009) assigned IRF3 using both in silico and radiation hybrid mapping to OAR14, within the region covered by our markers. The study of Jann et al. (Reference Jann, King, Corrales, Anderson, Jensen, Ait-ali, Tang, Wu, Cockett, Archibald and Glass2009) mapped IRF3 to a region affecting health traits in five species with host QTL controlling a wide range of pathogens, making it a strong candidate gene for our OAR14 QTL.
An important question from this study is whether QTL detected for nematode resistance and performance are pleiotropic. In general, a QTL affecting two traits may represent a single pleiotropic locus or two single-trait loci in close linkage (Gardner and Latta, Reference Gardner and Latta2007), and QTL studies cannot distinguish linkage from pleiotropy in cases when there is low resolution of QTL position (⩾10 cM). In this study, the FEC QTL also mapped to the same regions as QTL affecting growth traits on OAR3 in the Suffolk and OAR14 in the Texel. One Suffolk half-sib family had QTL segregating at 5% chromosome region-wide level for scanning weight and fat depth, with this same family plus another family segregating at 1% chromosome region-wide level in the same location for average daily gain (results not shown). Thus, these three QTL may well be the same QTL. However, although we observed both growth and FEC QTL on OAR3, these QTL were segregating in different families. Thus, there is little evidence that these growth and FEC QTL map to a single pleiotropic locus. We also found evidence for both OAR14 muscle depth QTL and Nematodirus OAR14 FEC segregating at 5% chromosome region-wide level in one Suffolk half-sib family. The favourable allele in this family was linked to a decrease in both FEC and muscle depth, that is, desirable for low FEC and unfavourable for muscle depth. A priori, we would expect pleiotropic QTL for FEC and performance if there were strong genetic correlations between these traits. However, the published evidence is very variable with correlations seeming to differ between studies as the severity of challenge and parasite species differ (Bishop and Stear, Reference Bishop and Stear2003; Bishop et al., Reference Bishop, Jackson, Coop and Stear2004; Morris et al., Reference Morris, Bisset, Vlassoff, West and Wheeler2004), and often being close to zero. Thus, it is unclear whether QTL that map to the same region in this study are pleiotropic or merely linked.
In summary, we have shown that previously reported FEC QTL on OAR3 and OAR14 in Blackface sheep and other breeds are also segregating in commercial Suffolk and Texel sheep. In addition, QTL for growth traits are also seen at these positions, and possibly some of these are pleiotropic QTL. As FEC measurement in the field poses an onerous task and one, which is difficult to implement routinely under commercial conditions, an immediate challenge is to identify a route to implementation for these QTL. In order for these QTL to be exploited in breeding programmes, there is a need to identify single nucleotide polymorphisms that are in population wide linkage disequilibrium with the causative mutations, or perhaps even attempt to identify the causative mutations, themselves. The confirmation that FEC QTL segregate in the same position in three widely used breeds widens their potential applicability to purebred Blackface, Suffolk, Texel sheep, with benefits likely to be observed in their commercial crossbred progeny.
Acknowledgements
The project is funded through the LINK SLP programme, with inputs from Defra, SEERAD, EBLEX, HCC, MLC and, Suffolk and Texel breeders.