INTRODUCTION
Bivalves are often the dominant suspension-feeders in coastal marine environments and many investigations have focused on the feeding and nutrition of this important group of consumers (Dame, Reference Dame1996). Mussels are reared in highly productive ecosystems where usually they adapt themselves to temporal changes in the seston composition and abundance and filter what is available in the environment. Both the quantity and quality of seston are important determinants of food resources of bivalves and these factors are both highly variable in shallow marine environments. Seston contains a temporally and spatially complex mixture, and many studies indicated that mussels may derive nutrients from dissolved organic matter (Roditi et al., Reference Roditi, Fisher and Sando-Wilhelmy2000), bacteria (Kreeger & Newell, Reference Kreeger and Newell2001), phytoplankton (Ogilvie et al., Reference Ogilvie, Ross, James and Schiel2003; Safi & Gibbs, Reference Safi and Gibbs2003) and a range of zooplankton of different sizes (Davenport et al., Reference Davenport, Smith and Packer2000; Wong et al., Reference Wong, Levinton, Twining and Fisher2003a; Zeldis et al., Reference Zeldis, Robinson, Ross and Hayden2004). Suspension feeding bivalves have phytoplankton as the main component of their diet, in the shallow coastal environment (Shumway et al., Reference Shumway, Selvin and Schick1987; Bricelj & Shumway, Reference Bricelj, Shumway and Shumway1991; Mac Donald & Ward, Reference Mac Donald and Ward1994), and this component includes a variety of species differing in cell size, shape and other structural features. This important food source can be associated to changes in both the quantity and quality that may result from different seasonal change (Bayne, Reference Bayne and Dame1993). In response to this dynamic food environment, many filter feeding organisms have developed a highly selective feeding strategy (Shumway et al., Reference Shumway, Cucci, Newell and Yentsch1985; Prins et al., Reference Prins, Smaal and Pouwer1991; Urrutia et al., Reference Urrutia, Iglesias, Navarro and Prou1996).
There is still a limited understanding of how the relative nutritive contribution of these different dietary items may shift during the year associated with variations in both seston composition and the mussel's physiological condition (Kreeger & Newell, Reference Kreeger and Newell2001). On the other hand, in the coastal and estuarine ecosystems, suspension feeding bivalve populations exert crucial effects on the plankton community by filtering large volumes of water. In this way, mussels severely deplete the phytoplankton by selectively feeding, thus altering the phytoplankton species composition (Officer et al., Reference Officer, Smayda and Mann1982; Dame, Reference Dame1996).
Mytilus galloprovincialis Lamarck, is the dominant commercial species in several Italian mussel farms (FAO, 1989). Studies on the biology and ecology of this mollusc species have been carried out in the Mar Grande of Taranto (Pastore et al., Reference Pastore, Panetta, Andreoli and Dell'Angelo1976; Matarrese et al., Reference Matarrese, Tursi, Costantino and Pollicoro1993), but only a small amount of information is available on its feeding behaviour. The existence of a trophic link between Mytilus galloprovincialis and phytoplankton communities has been evidenced, but not directly quantified. The phytoplankton community represents a key link between primary production and the higher trophic levels.
Previous studies have demonstrated that the specific fatty acid markers available for different groups of primary producers and consumers (Perry et al., Reference Perry, Volkman and Johns1979; Volkman et al., Reference Volkman, Jeffrey, Nichols, Rogers and Garland1989) have been successfully used to identify food sources (Kharlamenko et al., Reference Kharlamenko, Zhukova, Khotimchenko, Svetaschev and Kamenev1995, Reference Kharlamenko, Kiyashko, Imbs and Vyshkvartzev2001). Lipid production by phytoplankton is an important process in aquatic ecosystems because they have a high nutritional value. Their synthesis and accumulation by phytoplankton is a principal source of energy for invertebrates because they supply essential polyunsaturated fatty acids (e.g. Lee et al., Reference Lee, Yoon and Oh1998). Particularly, the fatty acid composition of adult bivalves is affected by the availability and composition of the natural diet (Fernandez-Reiriz et al., Reference Fernanadez-Reiriz, Labarta and Babarro1996; Caers et al., Reference Caers, Coutteau and Sorgeloos2000).
No background data exist about fatty composition and the trophic relationship of Mytilus gallaoprovincialis in Mar Grande of Taranto (Ionian Sea). The main purpose of this study was to investigate: (1) fatty acids composition of M. galloprovincialis; (2) abundance and biomass of phyto- and picophytoplankton considered as the main food source of mussels; and (3) the phytoplankton contribution to the mussel's diet by using the fatty acid trophic markers.
MATERIALS AND METHODS
Study area
The Mar Grande of Taranto extends into the Gulf of Taranto and the Ionian Sea with an average depth of 14.5 m and a total surface area of 36.495 km2. Mar Grande is surrounded by the Cheradi Islands (San Pietro and San Paolo) and connected to the Gulf of Taranto throughout a channel 1.1 km long and 34 m deep. In this area many mussel farm plants are localized.
Sampling strategy
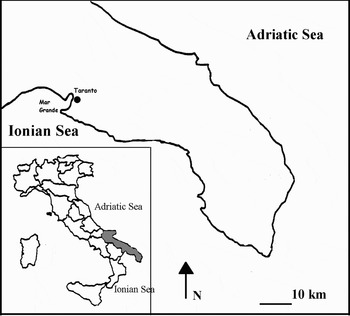
Seawater samples and adult stock of Mytilus galloprovincialis were collected in November 2005 (autumn), February 2006 (winter), May 2006 (spring) and August 2006 (summer) from a mussel culture plan in Mar Grande of Taranto (Figure 1). Seawater was sampled at 0.5 m below the water surface and at 0.5 m above the seabed (around 10 m of depth) by using a 5 l Niskin bottle. All the samples for phytoplankton analysis were stored in 4% buffered formaldehyde.
Map of the study area with the sampling station in Mar Grande of Taranto.

Phytoplankton and picophytoplankton cell counts
For the estimation of the phytoplankton abundance, water samples were preserved with formaldehyde at a final concentration of 2%. Samples for picophytoplankton (PPP) counts were kept at 4°C until analysis. Micro- and nanophytoplankton samples were observed with an inverted microscope (Labovert FS Leitz) equipped with phase contrast. Depending on the phytoplankton concentrations, sub-samples varying from 50 to 100 ml, were allowed to settle for 24–48 hours and examined according to the Utermöhl (Reference Utermöhl1958) method. PPP cell counts were carried out with a Zeiss Axioplan microscope equipped with a halogen (Hg 100) light. A BP 450/490 exciter filter, an FT 510 chromatic beam splitter and an LP 520 barrier filter were used. Under blue light excitation, phycoerithrin-rich Synechococcus is easily distinguishable by the intense orange fluorescence, whereas eukaryotic picoalgae had deep red fluorescence. Duplicate slides were prepared from each sample by filtering 10 ml of seawater on 0.2 µm Millipore black (Maugeri et al., Reference Maugeri, Acosta Pomar and Bruni1990). At least, for each preparation, 40 microscopic fields were counted at × 1000.
Phytoplankton biomass
Phytoplankton carbon content was estimated by assuming 45 g carbon g chlorophyll a –1 (Welschmeyer & Lorenzen, Reference Welschmeyer and Lorenzen1984). Chlorophyll-a was determined by the Parsons et al. (Reference Parsons, Maita and Lalli1984) spectrophotometric method. Phytoplankton chlorophyll-a to carbon estimates were assumed to vary by ±50% considering the wide range of values reported by Welschmeyer & Lorenzen (Reference Welschmeyer and Lorenzen1984), Hunter & Laws (Reference Hunter and Laws1981) and Caron et al. (Reference Caron, Dam, Kremer, Lessard, Madin, Malone, Napp, Peele, Roman and Youngbluth1995).
Picophytoplankton biomass
For picophytoplankton biovolume evaluation, two morphological types were considered: spheroid and ellipsoid. According to Sieracki et al. (Reference Sieracki, Viles and Webb1989), the formula V = π/6W2 L, where L and W are cell length and width, was applied. PPP was successively turned into biomass on the basis of the abundance, geometric cell volume and carbon content of 220 fg C μm−3 (Søndergaard et al., Reference Søndergaard, Jensen and Ærtebjerg1991).
Sample preparation for fatty acid analysis
Animal specimens (40.57±7.11 mm in shell length and 8.36 g ±1.8 wet weight), after collection, were immediately carried to the laboratory and placed in running filtered seawater (~20 hours) for gut content clearance, then stored by freezing at −20°C until analyses. Three sub-sets of mussels, each comprising ten animals, were taken at random. The soft tissues of the individuals of each sub-sample were cleaned thoroughly in filtered seawater, chopped in small pieces and homogenized. The homogenized samples were used for the lipid extraction by following a slightly modified version of the Folch et al. (Reference Folch, Lees and Sloane-Stanley1957) method. Briefly, 0.5–1 g of each sample was homogenized with 1.1% NaCl, total lipids were extracted by using a solvent mixture of chloroform–methanol (2:1, v/v). The chloroform layer, containing dissolved lipids, after its washing with 0.88% potassium chloride, was collected and transferred to small glass vials.
Fatty acids analysis
A fraction of the total lipid extract was transferred to a 10 ml glass vial and the solvent was evaporated under a steam of nitrogen gas. Methyl esters of fatty acids (FAMEs) were prepared by transesterification with boron trifluoride catalysed methanol and benzene solution (1:2 v/v) at 90°C for 20 minutes. When the methylation had finished, 2 ml of distilled water was added to the mixture (Allinger et al., Reference Allinger, Cava, De Jough, Johnson, Lebel and Stevens1986). The upper phase containing the fatty acids was transferred to gas chromatograph (GC) vials. Analysis of fatty acid methyl esters was carried out on a HP 6890 series gas chromatograph equipped with an Omegawax 250 fused silica capillary column (Supelco, Bellefonte, USA) and a flame ionization detector. Splitless injection of 1 µl was performed. The column temperature programme was as follows: from 150 to 250°C at 4°C/minute and maintained at 250°C. The helium was used as the carrier gas at a flow of 1 ml/minute. Fatty acid methyl esters were identified by comparison with retention time of fatty acids standards (FAME mix, Supelco, USA) and the results were expressed as percentages of the total lipid (%).
Trophic markers
Based on the fatty acid composition, a variety of trophic markers and ratios were determined to obtain information on the phytoplankton contribution and feeding behaviour of mussels. PUFAs indicate organic matter derived from fresh phytoplankton (Volkman et al., Reference Volkman, Jeffrey, Nichols, Rogers and Garland1989) while detritus is rich in saturated fatty acids (SAFAs) (Fahl & Kattner, Reference Fahl and Kattner1993). The PUFA/MUFA and PUFA/SAFA ratios have been considered to be a measure of phytoplankton level in the mussel diet. 16:1n7 and 20:5n3 FAs are considered to be indicators of a diatom-based diet (Volkman et al., Reference Volkman, Jeffrey, Nichols, Rogers and Garland1989; Dunstan et al., Reference Dunstan, Volkman, Barrett, Leroi and Jeffrey1994; Kharlamenko et al., Reference Kharlamenko, Zhukova, Khotimchenko, Svetaschev and Kamenev1995), also the ratio of 16:1n7 to 16:0 has been used to discriminate between diatom feeding versus phytoflagellate feeding (Claustre et al., Reference Claustre, Marty, Cassiani and Dagaud1989; Cripps et al., Reference Cripps, Watkins, Hill and Atkinson1999; Nelson et al., Reference Nelson, Mooney, Nichols and Phleger2001; Auel et al., Reference Auel, Harjes, da Rocha, Stübing and Hagen2002). This is due to the fact that diatoms are rich in 16:1n7 (Nichols et al., Reference Nichols, Nichols and Sullivan1993; Dunstan et al., Reference Dunstan, Volkman, Barrett, Leroi and Jeffrey1994), while phytoflagellates contain higher levels of 16:0 (Sargent & Whittle, Reference Sargent, Whittle and Longhurst1981; Virtue et al., Reference Virtue, Nichols, Nicol, McMinn and Sikes1993). The fatty acid 18:4n3 is usually used as a dinoflagellate marker (Mansour et al., Reference Mansour, Volkman, Jackson and Blackburn1999) and 18:1n7 as a bacteria marker (Perry et al., Reference Perry, Volkman and Johns1979; Gillan & Johns, Reference Gillan, Johns and Johns1986; Kharlamenko et al., Reference Kharlamenko, Zhukova, Khotimchenko, Svetaschev and Kamenev1995). Finally, the ratio of the n3 and n6 polyunsaturated-fatty-acid fractions, was utilized as an indicator of the nutritive value of microalgae (Molina et al., Reference Molina, Martínez, Sánchez, García and Contreras1991).
Statistical analysis
Analysis of variance (ANOVA) was performed on phytoplankton data in order to establish if depth had a significant effect on abundance, biomass and community composition (diatoms, dinoflagellates, coccolithophorids and phytoflagellates). Furthermore, the percentage of the biomarkers and fatty acid ratios in all seasons were also compared. Correlation analysis was performed to test the relationship between each phytoplankton group (diatoms, dinoflagellates and phytoflagellates) and their relative biomarkers. All the statistical analyses were performed by using SPSS software at 95% confidence intervals.
RESULTS
Phytoplankton abundance, biomass and composition
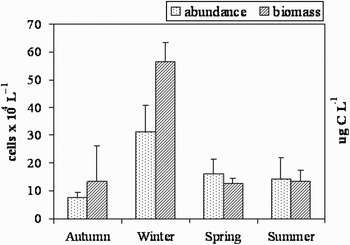
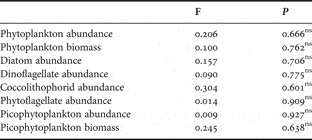
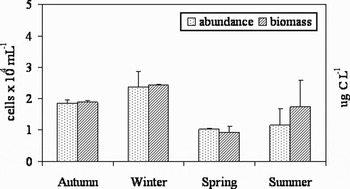
Analysis of variance showed that phytoplankton abundances, biomass and community composition (diatoms, dinoflagellates, coccolithophorids and phytoflagellates) were not statistically different between the surface and bottom layers (Table 1). The seasonal trend of the phytoplankton abundances and biomass in Mar Grande was characterized by significantly higher values in winter and by minimum values in autumn (Figure 2).
Seasonal trends of the phytoplankton abundances (cells × 104 l−1) and biomass (µg C l−1) in Mar Grande of Taranto. Data are reported as average + standard deviations (bars) of the surface and bottom layers.

Statistical summary from one-way ANOVA comparing the surface and bottom phytoplankton data (ns, not significant).

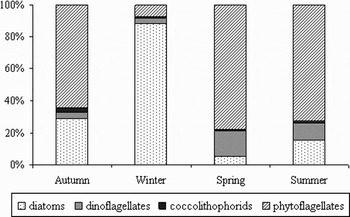
The phytoplankton communities consisted mainly of nano-sized phytoflagellates and diatoms whereas dinoflagellates and coccolithophorids never dominated the community, accounting for only negligible abundances and percentage values (Figure 3). Particularly, phytoflagellates (77.9±2.1%) and dinoflagellates (15.6±2.9%), reached their higher abundance percentages in spring, diatoms in winter (88.0±3.4%), and coccolithophorids in autumn (2.5±3.5%).
Seasonal trends in percentage abundances of phytoplankton groups in Mar Grande of Taranto. Data are reported as average of the surface and bottom layers.

Picophytoplankton abundance, biomass and composition
Analysis of variance showed that picophytoplankton (PPP) abundances and biomass were not statistically different between the surface and bottom layers (Table 1). The seasonal abundance trend of PPP showed the annual highest values in winter (Figure 4). The biomass distribution (Figure 4) was similar to the abundance one: standing crop distribution was stable throughout the year, except for a slight increase of the values during winter.
Seasonal trends of the picophytoplankton abundances (cells × 104 ml−1) and biomass (µg C l−1) in Mar Grande of Taranto. Data are reported as average + standard deviations (bars) of the surface and bottom layers.

From a qualitative point of view, intense orange fluorescent round to rod-shaped cells of Synechococcus type accounted for 98% of the total PPP abundances. Red fluorescent cells, to be presumably referred to eukaryotic picophytoplankton, were recorded during the winter period, but their presence was negligible.
Fatty acids composition
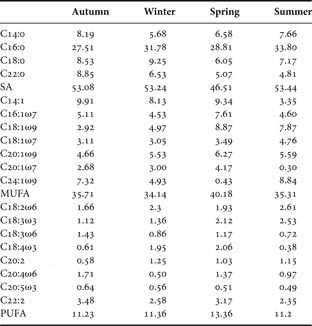
A total of 19 fatty acids (FAs) have been identified and their seasonal variation is shown in Table 2. The saturated fatty acids (SAFAs) were predominant in all seasons with a minimum percentage of 46.51% in spring and a maximum of 53.44% in summer. The major SAFAs identified include the 16:0 (with a range 27.51–33.80%) followed by 18:0 (6.05–9.25% of total FAs) and 14:0 (5.68–8.19% of total FAs). Monounsaturated fatty acids (MUFAs) varied between 34.14% in winter and 40.18% in spring and showed higher levels of 14:1 (3.35–9.91% of total FAs), 18:1n9 (2.92–8.87%), 20:1n9 (4.66–6.27%), 16:1 n7 (4.53–7.61%) and 24:1n9 (0.43–8.84%). Finally, the polyunsaturated fatty acids (PUFAs) were characterized by percentages between 11.20% in summer and 13.36% in spring. The most important PUFAs were 22:2 (2.35–3.48% of total FAs) and also 18:2n-6 (1.66–2.61%). PUFAs showed low percentages of n3 and n6.
Percentages of fatty acids profiles.

Trophic markers
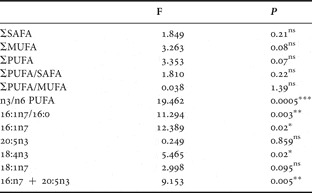
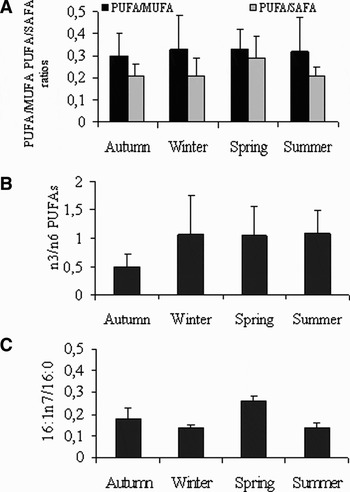
Table 3 shows the summary statistics from ANOVAs comparing the content of selected fatty acids, which are used as trophic markers, among seasons. The seasonal variations in the SAFAs, MUFAs and PUFAs were not significantly different during the whole study period (ANOVA, P > 0.05). ANOVA showed the existence of significant differences among seasons for n3/n6 ratio (ANOVA, P < 0.001) and 16:1n7/16:0 ratio (ANOVA, P < 0.01). The percentage of the sum of 16:1n7 + 20:5n3 was significantly different among seasons (ANOVA, P < 0.05).
Statistical summary from one-way ANOVA comparing the percentages of FAs and FAs ratios among all seasons (ns, not significant; *P < 0.05; **P < 0.01; ***P < 0.001).

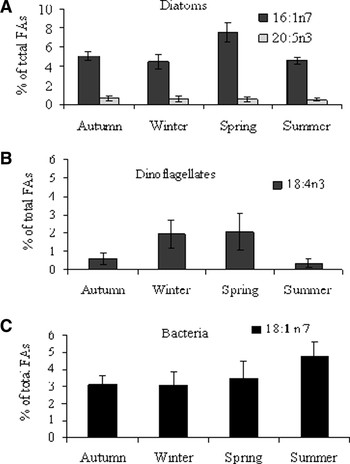
Relative contributions (% of total FAs) of diatoms, dinoflagellates and bacteria fatty acid markers, during the whole period of study are shown in Figure 5. There were significant differences among seasons in diatoms and dinoflagellate markers, but no significant differences were observed for bacteria markers. The mean percentage of 16:1n7 and 18:4n3 were significantly higher in spring. The ratios of PUFA/MUFA, PUFA/SAFA, n3/n6 PUFAs, 16:1n7/16:0 are shown in Figure 6.
Fatty acids markers (% of total FAs): a–b, diatoms; c, dinoflagellates. Values are mean ±SD (N = 3).

PUFA/MUFA, PUFA/SAFA, n3/n6 PUFAs, 18:1 n7 in the tissues of Mytilus galloprovincialis. Values are mean ±SD (N = 3).

Correlation analysis between each phytoplankton group (diatoms, dinoflagellates and phytoflagellates) and their relative biomarkers, revealed that the only significant correlation has been found between phytoflagellates and 16:0 (r = 0.84, P < 0.05).
DISCUSSION
The structural diversity of fatty acids synthesized by marine microalgae and their relative stability allow their use as trophic markers. Specific fatty acids (or combinations) can be associated with particular phytoplankton classes (Claustre et al., Reference Claustre, Marty, Cassiani and Dagaud1989). Previous studies have been focused on their importance as trophic biomarkers for transfer through marine food chains and especially in bivalve molluscs (Joseph, Reference Joseph1982; Voogt, Reference Voogt and Hochachka1983; Sargent et al., Reference Sargent, Bell, Henderson and Tocher1990; Bradshaw et al., Reference Bradshaw, O'Hara, Corner and Eglinton1991). In marine invertebrates and in molluscs in particular, the fatty acids composition is characterized by high levels of two polyunsaturated acids: 20:5n-3 and 22:6n-3 (Sargent, Reference Sargent, Malins and Sargent1976; Joseph, Reference Joseph1982). This pattern reflects the nature of the ingested food represented by phytoplankton that constitutes the first step of the marine food chain. In the Mar Grande of Taranto, Mytilus galloprovincialis showed a low amount (or were not detected) of these polyunsaturated fatty acids during the whole period of study. This could be explained by the features of the Mar Grande, considered as an oligotrophic ecosystem of the entire northern Ionian Sea (Caroppo et al., Reference Caroppo, Stabili, Aresta, Corinaldesi and Danovaro2006a) where phytoplankton did not reach high values both in terms of abundance and biomass, except for the winter period. Futhermore, the communities collected during our study could be considered as the result of the presence of a rich commercial mussel fishery. It is well known that molluscs may exert a significant control on the phytoplankton population. The filter feeding activity of the bivalve population effectively prevents the occurrence of phytoplankton bloom and may be considered as a natural control on eutrophication (Cloern, Reference Cloern1982; Officer et al., Reference Officer, Smayda and Mann1982). The impact of commercial quantities of filter feeding molluscs as a force regulating the phytoplankton densities cannot be ignored, as in other Apulian sites devoted to the mussel culture (Caroppo, Reference Caroppo2000).
The abundance and biomass phytoplankton values found in these waters seemed to confirm the oligotrophic feature of this area. Furthermore, the phytoplankton data observed in the Mar Grande were comparable to those observed in other Mediterranean sites (Fonda Umani et al., Reference Fonda Umani, Franco, Ghirardelli, Malej, Colombo, Ferrari, Ceccherelli and Rossi1992; Caroppo et al., Reference Caroppo, Fiocca, Sammarco and Magazzù1999; Socal et al., Reference Socal, Boldrin, Bianchi, Civitarese, De Lazzari, Rabitti, Totti and Turchetto1999). As regards picophytoplankton, they were of the same order of magnitude as those reported in other coastal environments (Vanucci et al., Reference Vanucci, Acosta Pomar and Maugeri1994; Acosta Pomar & Giuffrè, Reference Acosta Pomar and Giuffrè1996; Caroppo et al., Reference Caroppo, Turicchia and Margheri2006b).
The PUFA 20:5n3 and the MUFA 16:1n7 predominate in diatoms (Volkman et al., Reference Volkman, Jeffrey, Nichols, Rogers and Garland1989; Dunstan et al., Reference Dunstan, Volkman, Barrett, Leroi and Jeffrey1994) for which they are often used as a marker (Kharlamenko et al., Reference Kharlamenko, Zhukova, Khotimchenko, Svetaschev and Kamenev1995).
In this study the higher percentage of 16:1n7 during the spring period suggested that diatoms, dominant during the previous winter period, contributed to the bivalve diet. Comparison of the relative contribution of diatom markers (20:5n3+16:1n7) among seasons indicates that they were significantly highest in the spring period. Diatoms reached in the column water their higher abundance and biomass in the previous winter period. Particularly, diatoms were represented by the micro-sized species, which were the most important contributors of the total phytoplankton biomass. The most represented diatoms genera were Chaetoceros, Coscinodiscus, Cylindrotheca, Leptocylindrus, Nitzschia, Pseudo-nitzschia and Skeletonema. Previous studies indicate that diatoms are a major dietary component of bivalves (Shumway et al., Reference Shumway, Selvin and Schick1987; Beninger & Decottignies, Reference Beninger and Decottignies2005) and are often used in mussel culture for their nutritional value (Brown et al., Reference Brown, Jeffrey, Volkman and Dunstan1997; Renaud et al., Reference Renaud, Thinh and Parry1999).
The fatty acid profile of M. galloprovincialis showed a considerable contribution of SAFA in their tissues during all seasons, PUFA was the less abundant category. This contrasts with previously published data in other species of bivalves, such as Chlamys islandica (Bell & Sargent, Reference Bell and Sargent1985) and Pecten maximus (Besnard, Reference Besnard1988), in which PUFA were the major fatty acids measured, therefore indicating that phytoplankton is the main feeding source in these species. Rodhouse et al. (Reference Rodhouse, Roden, Burnell, Hensey, McMahon, Ottway and Ryan1984) evidenced also the importance of organic detritus as an energy source for mussels during periods of scarce primary productivity. In this study the major FAs proportion, during all year, was due primarily to the high percentage of SAFA and MUFA. Previous studies reported that detrital material is rich in SAFA and MUFA fatty acids between 14 and 18 carbon atoms (Freites et al., Reference Freites, Fernández-Reiriz and Labarta2002) but also SAFA of 14 and 16 carbons indicate bacterial flora associated to detritus (Perry et al., Reference Perry, Volkman and Johns1979). On the other hand Graeve et al. (Reference Graeve, Hagen and Kattner1994) state that elevated amounts of short-chain, such as 14:0 and 16:0 fatty acids, indicate omnivorous feeding.
The ratio of 16:1n7 to 16:0 has been utilized as flagellate markers; in marine invertebrates, the introduction of flagellates to food, determine a significant decrease in this ratio as also observed by Claustre et al. (Reference Claustre, Marty, Cassiani and Dagaud1989). This could be explained taking into account the role of phytoflagellates to the phytoplankton physiognomy in Mar Grande, where they represented the most conspicuous group, such as in other oligotrophic ecosystems. Nano-sized phytoflagellates, in fact are considered as a ‘bioindicator’ of the oligotrophic ecosystems (Vilicic et al., Reference Vilicic, Leder, Grzetic and Jasprica1995). Also among phytoflagellates there are many species with elevated content of fatty acids (Albentosa et al., Reference Albentosa, Pérez-Camacho, Labarta and Fernández-Reiriz1996; Brown et al., Reference Brown, Jeffrey, Volkman and Dunstan1997; Renaud et al., Reference Renaud, Thinh and Parry1999).
Conway & McDowell Capuzzo (Reference Conway and McDowell Capuzzo1991) reported, for a littoral bivalve Solemya velum containing endosymbiontic chemoautotrophic bacteria, the absence of 20:5 and 22:6 from their fatty acids. On the other hand, they found high contents of n-7 series MUFA indicating bacterial origin and high levels of 20:4n6 which is supposed to have the same function as 20:5 and 22:6.
In our case, 20:4n6 together with 22:2 could be supposed to play the essential role in bivalve metabolism, supporting the hypothesis that bacteria are also important contributors to the mussel diet in the Mar Grande of Taranto. The autotrophic bacterial component, represented mainly by cyanobacteria, contributed only 1.0% of the phytoplankton total biomass. On other the hand, it is known that the food quality of cyanobacteria, in terms of fatty acid composition, is low (Von Elert & Wolffrom, Reference Von Elert and Wolffrom2001). It could be argued that the heterotrophic bacteria represented the main source for the mussels' diet, and particularly for the 20:4n6 together with 22:2 components.
Recent studies have evidenced that also species of micro- and mesozooplankton have been shown to be ingested by suspension marine bivalves (Le Gall et al., Reference Le Gall, Hassen and Le Gall1997; Dupuy et al., Reference Dupuy, Vaquer, Lam-Hoai, Rougier, Mazouni, Lautier, Collos and Le Gall2000; Davenport et al., Reference Davenport, Smith and Packer2000; Lehane & Davenport Reference Lehane and Davenport2002; Wong et al., Reference Wong, Levinton, Twining, Fisher, Kelaher and Alt2003b). An animal dietary input could be evidenced by the relatively high concentration of the fatty acid markers: 18:1 ω 9 and 20:1 ω 9 indicative of zooplankton diet (Knox, Reference Knox1986;. Falk-Petersen et al., Reference Falk-Petersen, Dahl, Scott, Sargent, Gulliksen, Kwasniewski, Hop and Millar2002). These trophic markers during the whole study period, showed their highest level during the summer period, when zooplankton reached their higher abundance values in Mar Grande (Belmonte et al., Reference Belmonte, Fanelli, Gravili and Rubino2001).
Among PUFAs, non-methylene interrupted dienoic (NMID) fatty acids constituted the dominant part. This fatty acid can be related to biosynthetic pathways based on chain elongation and desaturation of n-7 MUFA. Several studies have suggested that in absence of HUFA such as 20:5n-3 and 22:6n-3 or their precursors, NMID act as a substitute (Zhukova, Reference Zhukova1991; Pond et al., Reference Pond, Bell, Dixon, Fallick, Segonzac and Sargent1998). Whyte (Reference Whyte1988) reported for Crassostrea gigas that the increase of 22:2 coincided with low levels of 20:5n-3 and Klingensmith (Reference Klingensmith1982) reported an inverse relationship between the n-3 PUFAs and NMID fatty acids levels.
In this preliminary step forward about knowledge of food sources of M. galloprovincialis, in Mar Grande of Taranto, we have evaluated the phytoplankton available to mussels, in terms of both quantity and quality and its dynamic as well as the contribution of phytoplankton to diet of mussels. The results evidence that the phytoplankton was not the main food source of M. galloprovincialis but it seems to adopt an omnivorous feeding regime. In the future it would be useful to better quantify the dietary contribution of the complex mixture of natural microparticulate organic material, including phytoplankton, vascular plant detritus, bacteria, heterotrophic nanoflagellates and benthic diatoms. This information could be used to estimate the amount of the nutritional need of mussels. With this information we could construct an overall budget to determine what proportion of each part of seston is utilized by M. galloprovincialis.