1 Introduction
With the growth of the Semantic Web, the demand for ontologies written in the OWL Web Ontology Language (OWL)Footnote 1 (and related languages like the Resource Description Framework Schema, RDFSFootnote 2 ) is also rapidly growing. Even though user-friendly syntaxes of OWL, such as TurtleFootnote 3 or the Manchester syntaxFootnote 4 , make the textual inspection and editing of ontologies easier, graphical visualization remains an important enabler in many practical tasks related to ontologies. Numerous visualization methods for ontologies thus have been proposed and many software tools implementing them have been developed, ranging from newly designed approaches to approaches reusing the Unified Modeling Language (UML)Footnote 5 by leveraging on the similarities between Knowledge Engineering and Software Engineering. However, no ontology visualization method has been accepted by the majority of the Semantic Web community as de facto standard so far.
One reason clearly is that there is no one-size-fits-all solution but different tasks and use cases require different ontology visualization methods. Another reason might be that there has been little improvement on the state of the art in the field. New ontology visualization methods and tools are often developed from scratch, omitting opportunities to learn from previous mistakes or to reuse advanced techniques provided by other researchers and developers.
As the only comprehensive survey of ontology visualization methods and tools known to us is the one by Katifori et al. (Reference Katifori, Halatsis, Lepouras, Vassilakis and Giannopoulou2007), which is about a decade old now, we believe that the field of ontology visualization could benefit from an up-to-date survey, taking into account the developments of the last decade both in the field of ontologies (version 2 of OWL, advanced APIs, etc.) and visualization (new visualization methods and libraries, powerful graphical processors, high resolution displays, etc.).
The goal of this paper therefore is to survey state-of-the-art ontology visualization methods and tools. It aims to offer both a starting point for ontology visualization researchers and tool developers as well as an overview of existing approaches to choose from for users looking for ontology visualizations. The paper is based on the structure proposed by Katifori et al. (Reference Katifori, Halatsis, Lepouras, Vassilakis and Giannopoulou2007), with a couple of changes and updates: while Katifori et al. generalize the findings to visualization methods and tasks, we focus on tools and the visualization techniques they implement. Further, we limit our survey to those tools visualizing OWL ontologies, excluding tools that are only distantly related to ontology visualization.
Complementary to this survey is the evaluation of selected tools with respect to various use cases we conducted in our previous work (Dudáš et al., Reference Dudáš, Zamazal and Svátek2014). The evaluation eventually powered a recommendation system for ontology visualization tools, which is constantly being updated and extendedFootnote 6 .
The structure of this paper is as follows: in the following subsection (Section 1.1), we introduce the most basic concepts of the field under study. In Section 2, we address benefits of ontology visualization and discuss what research problems are to be solved to achieve them. Section 3 describes our classification of ontology visualization methods, which is based on previous classifications but updated to comply with the current state of the art. Section 4 lists relevant features and techniques we observed in ontology visualization tools and discusses literature recommendations on functionalities that an ontology visualization should provide. Section 5 gives short descriptions of all ontology visualization tools we surveyed. Section 6 summarizes existing evaluations of the tools, before the paper is concluded in Section 7.
1.1 Basic concepts
1.1.1 Ontology
An ontology is briefly defined as ‘a formal explicit specification of a shared conceptualization’ (Borst, Reference Borst1997). This paper focuses on ontologies written in OWL, which has become the lingua franca for ontologies. OWL ontologies are intended to be used for annotation of data represented in RDF. The basic unit of RDF is a triple consisting of a subject, predicate and object. The main language constructs are classes and properties. Instances identified by an IRI used as subjects or objects can belong to a class. Classes can form a hierarchy through subclass relations. Properties serve as predicates in triples and can have domain and range axioms specifying the class of instances used as subject and object in the triple with the property. Domain and range axioms are treated in a simplified manner by most visualization tools, such that the properties are displayed along with the domain classes as if they belonged to them. Most of the visualizations focus on classes, their hierarchical relations and properties. However, OWL contains many more constructs, such as restrictions defining what instances can belong to a class or relationships between classes expressing disjointness or other constraints.
1.1.2 Ontology visualization
Although ontologies are supposed to represent knowledge, ontology visualization as discussed here is not necessarily closely related to knowledge visualization. The purpose of ontology visualization is usually to display the concepts and structures of ontologies at the level of OWL language constructs rather than displaying the knowledge covered by the ontology. Target users are ontology developers or engineers and other user groups who want to analyze and understand an ontology in order to use it for data annotation and other tasks.
1.1.3 Ontology visualization use cases
In our previous work (Dudáš et al., Reference Dudáš, Zamazal and Svátek2014), we identified four high-level use cases related to the application of ontology visualization methods: editing, learning, inspecting and sharing. Editing a visualized ontology, for instance, by drawing lines between classes to add new triples linking the classes, can be less demanding for users who are little familiar with the textual OWL syntax; however, only few of the surveyed tools support visual editing. Users wanting to learn an ontology in order to use it, or inspect it to find errors and missing links, can benefit from the ability of visualizations to give an overview of the ontology and from corresponding filtering capabilities allowing to focus on specific parts. Sharing refers to the creation of figures (e.g. screenshots or exported images) showing an overview or illustrating a specific part of an ontology. Such figures can, for instance, be included in text books, scientific papers, block posts, or other forms of documentation and dissemination of ontologies.
2 Benefits and challenges of ontology visualization
According to Card (Reference Card2002), visualizations can have a number of benefits: to name a few, they can increase cognitive memory and processing resources, reduce the search for information, enhance the detection of patterns, enable perceptual inference operations as well as attention mechanisms for monitoring, encode information in a manipulable medium, allow to examine a large amount of information, keep an overview of the whole while pursuing details, keep track of things, and produce an abstract representation of a situation through the omission and recoding of information. However, we see several challenges that need to be tackled before a larger subset of the aforementioned benefits can actually be achieved in ontology visualization.
2.1 Getting an overview of large ontologies
One of the main potential benefits of ontology visualizations is to provide an overview of the whole while also showing details. A good overview alone can be very useful for users to quickly obtain a general understanding of the concepts and structure of an ontology and the domain it covers. Offering a visual overview of an ontology is, at the same time, one of the main challenges. Small ontologies containing up to several tens of classes can still be displayed with most visualization methods. However, larger ontologiesFootnote 7 often simply do not fit on one screen, and sophisticated visualization and filtering techniques must be applied to avoid or at least alleviate clutter. The problem definition is simple, but a satisfying solution has not yet been found, as far as we know and as it is shown by the results of our survey.
A first prerequisite to address this challenge is to provide a user-friendly interface implementing a number of interaction techniques, such as zooming and panning, filtering based on user requests and incremental exploration (these and other interaction techniques are detailed in Section 4). The second prerequisite is a technical one: The performance of the tool must be good enough to load a large ontology and enable interaction with its visualization without long delays. As our survey shows, most of the available tools fail to load large ontologies (mainly due to out-of-memory problems). Finally, the tool has to deal with clutter when displaying a large number of elements at once. Among the possible techniques, there are three advanced ones that can effectively alleviate the problem of clutter: ‘smart’ filtering of displayed elements, clustering of edges, and semantic zooming. These are discussed in more detail in Section 4.2.
Few of the tools we surveyed offer a readable overview of large ontologies. KC-Viz is an exception by providing a method to visualize selected key concepts of ontologies. A related approach was proposed by Jiao et al. (Reference Jiao, Liu, Li, Marriott and Wybrow2013); however, it does not seem to be available for use. In general, it is hard to say what a good overview visualization of an ontology should look like, that is, what information it must contain and what it can omit. This is a challenge that needs to be tackled by future research, even though it depends largely on the individual use cases and user goals.
2.2 From overview to details
A related challenge is linked to the famous visualization mantra of ‘overview first, zoom and filter, then details-on-demand’ (Shneiderman, Reference Shneiderman1996). Despite this mantra being often cited, our survey showed there is still much to be researched before it can actually be achieved in ontology visualization. We already mentioned that displaying a useful overview of larger ontologies is an open problem on its own. Getting to the details from the overview, while keeping the context of other parts of the ontology, is another challenge not easy to solve.
There are common techniques for showing details about single entities, such as pop-up ‘tooltip-style’ windows or separate sub-windows showing the details in textual form. The hard task is depicting the details visually. None of the tools we were able to try out really attempted to offer such functionality.
One solution attempt is the use of a minimap, as proposed by Jiao et al. (Reference Jiao, Liu, Li, Marriott and Wybrow2013) with their ‘landmark’ visualization: the tool they implemented (that is not publicly available) offers multiple views, where one shows an overview of the ontology while the other shows a detailed view of a selected ontology part. The two views are synchronized via linking and brushing, that is, navigation in any of the views also changes the other one.
2.3 Different visualizations for different use cases
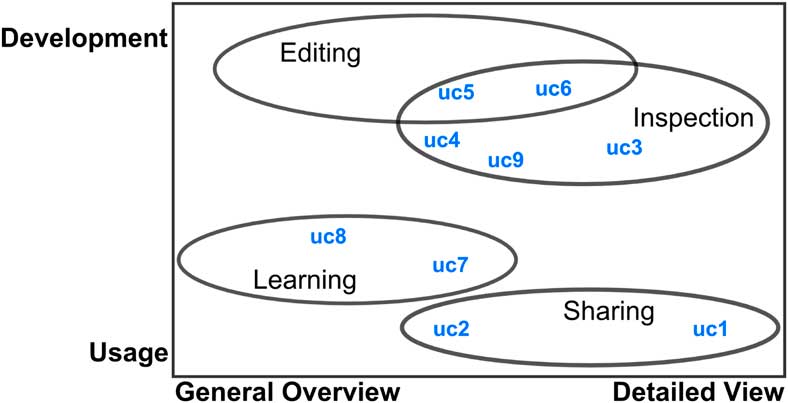
The third challenge results from the fact that different use cases demand different visualization and interaction techniques. Among others, this was raised by Dmitrieva and Verbeek (Reference Dmitrieva and Verbeek2009) and in our previous research on a recommender system for ontology visualizations (Dudáš et al., Reference Dudáš, Zamazal and Svátek2014). There, we collected—based on a literature analysis and own experiences—nine common use cases of ontology visualization: creating illustrations of selected parts of an ontology (uc1) or of its overall content and structure (uc2); detecting structural errors (uc3); checking for model adequacy (how well the ontology covers its domain) (uc4); building a new ontology (uc5); adapting an existing ontology, for example, by adding entities or customizing it, to fit a specific purpose (uc6); analyzing an ontology in order to create or annotate data with it (uc7); deciding about the suitability of an ontology for a specific purpose (uc8); analyzing an ontology in order to map it to another ontology (uc9). We aggregated these nine use cases to the four high-level use case categories introduced in Section 1.1, namely editing, learning, inspecting and sharing. The categories and use cases can be arranged in a two-dimensional (2D) space as shown in Figure 1. The first dimension distinguishes whether the user actively develops the ontology or only uses it. The second dimension encodes the required level of detail, that is, whether an overview (e.g. class hierarchy) is enough or a detailed view (e.g. axioms related to a class) is needed.
Use case categories of ontology visualization

Although it might seem obvious, little research has been conducted in this area. A part of the solution could be implementing different visualization methods in one tool and letting the users choose the most suitable one depending on their use case. However, the choice might be difficult for inexperienced users. Automated, or at least semi-automated, recommendation approaches might help by suggesting appropriate visualizations according to the ontology to be displayed and the goal to be achieved by the visualization.
2.4 Retinal properties
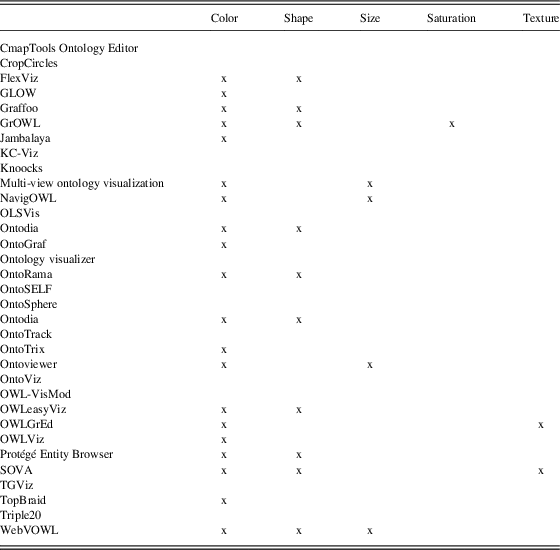
Finally, another key challenge we observed with regard to ontology visualization is the utilization of cognitive and perceptive features that are capable of adding extra dimensions of expressiveness to the presentation. The opportunities offered by cognitive technologies are not yet fully explored and utilized in practical tools. To give an example: humans associate important concepts with larger size and less important ones with smaller size. This perception peculiarity can be used to display classes with many subclasses or many instances in a larger size in order to convey the importance of these classes. Another example in the context of node-link visualizations is to draw the most important relations as thicker lines. Both techniques are recommended by Ware (Reference Ware2012), together with using shape and color to represent further information. Bertin (Reference Bertin1983) calls these techniques retinal properties and adds saturation and texture to the list. We analyzed the usage of such retinal properties for the tools contained in the survey; the results are listed in Table 4. We found that shapes and colors are only little varied in many of the ontology visualization tools we surveyed, whereas size, texture and saturation are even less frequently used as visual indicators.
In addition, meaning can be communicated via grouping and layout. For instance, it is known that humans tend to interpret entities that are close to each other to be more similar than those being further apart (Casasanto, Reference Casasanto2008). It can therefore be reasonable to spatially group similar concepts in ontology visualizations. Typically, it is recommended to use such a spatial encoding for the most important variable (Card, Reference Card2002).
3 Ontology visualization methods
Even though each ontology visualization tool is different and unique, and there is no general formalization of the way they display ontologies, some commonalities among them can be identified, forming what we call ontology visualization methods. In this section, we provide a classification of existing ontology visualization methods, taking into account all those that have at least been experimentally used. The classification is inspired by the one proposed by Katifori et al. (Reference Katifori, Halatsis, Lepouras, Vassilakis and Giannopoulou2007), with some changes and extensions that reflect recent developments. We excluded categories that are not present in the available tools as well as categories that would cover most of the tools, such as ‘zoomable’ (almost all of the reviewed tools offer some kind of zoom functionality). Since most of the tools fall into the ‘node-link’ category, we divided it into subcategories. We use this classification throughout the paper to describe and discuss the ontology visualization tools we surveyed.
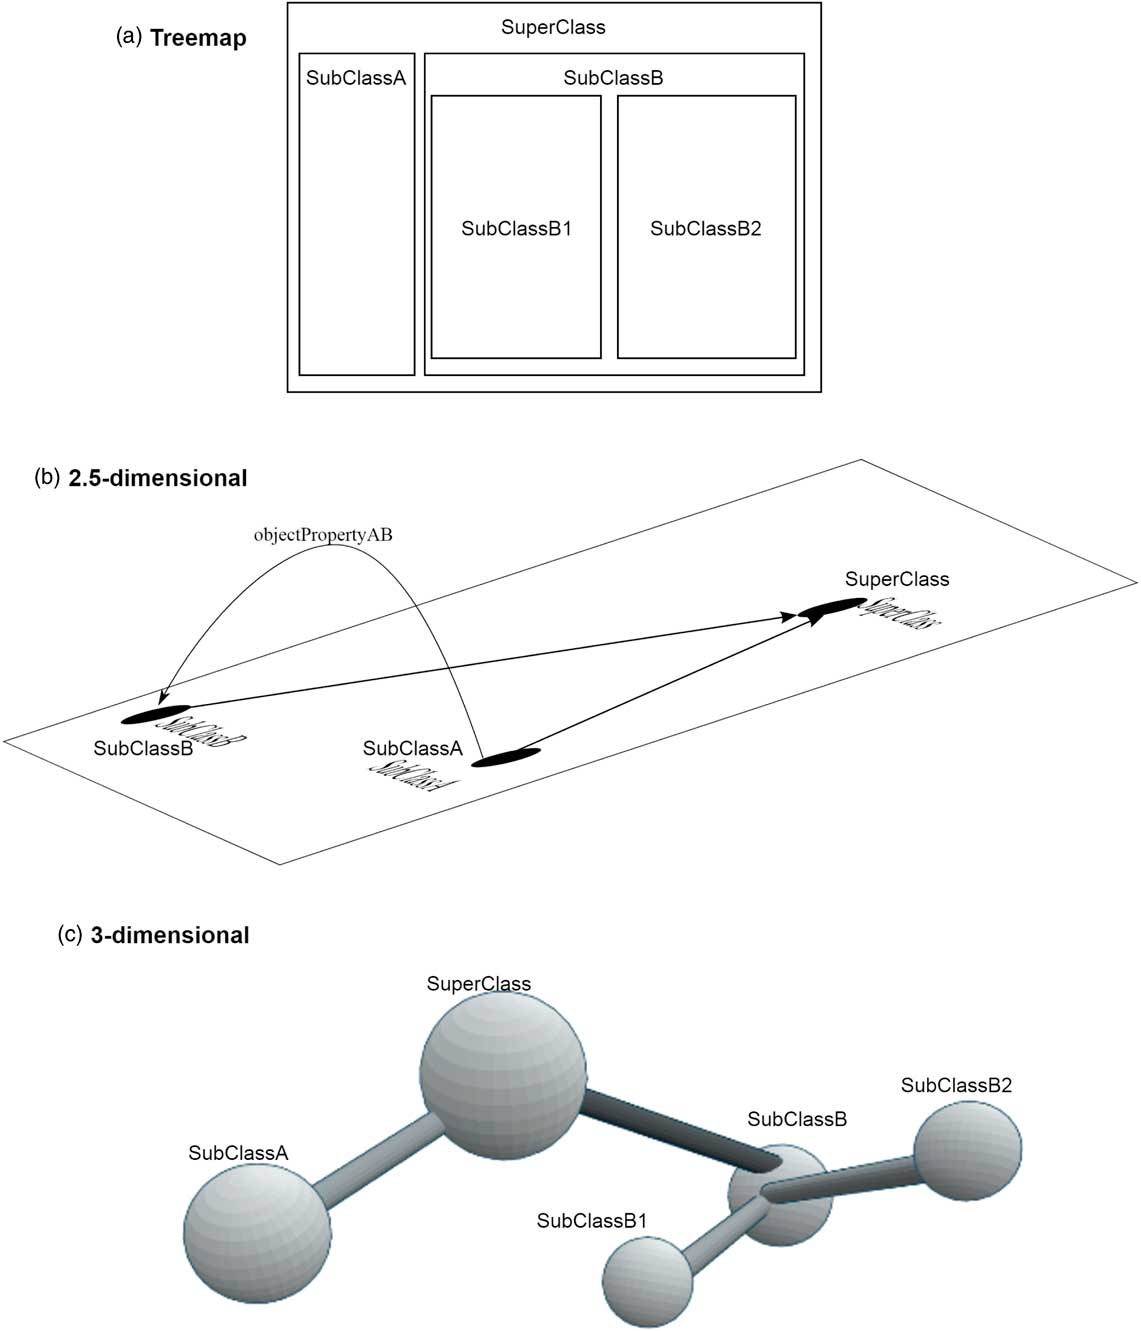
Our classification is based on three main criteria: the most general is the number of dimensions used by the visualization method. 2D visualizations are dominating, with the exception of a few tools that experiment with 2.5D and 3D visualizations of ontologies. We classify indented lists as ‘one-and-a-half-dimensional’ visualizations, since they make use of mainly one dimension (the horizontal position of the displayed elements) to indicate hierarchical relationships by indentation, although the resulting visualization has apparently two dimensions. In the same spirit, there could be 4D visualizations, such as animated visualizations where time is used as the fourth dimension. Although there are currently no ontology tools using animations to encode particular information, it might be an area worth to explore, for instance, in order to depict the evolution of ontologies. For both the 2.5D and 3D categories, there are currently only very few tool examples, so there is no need to define subcategories for them at the moment. Indented lists are used a lot, but with little variation, and as there are no other examples of 1.5D visualizations, we do not define subcategories for this category neither.
The second criterion are the graphical elements (or glyphs) used in the visualization. These could, for example, be nodes forming a graph (as in node-link visualizations) or circles representing information with their relative position (as in Euler diagrams). The third and last criterion of our classification is the method used to lay out (i.e. spatially arrange) the elements on the screen. It is particularly relevant in case of node-link visualizations, where various layouts, such as force-directed, tree or radial layouts, are used, but it can also be important for other visualization methods, such as treemaps (Johnson & Shneiderman, Reference Johnson and Shneiderman1991).
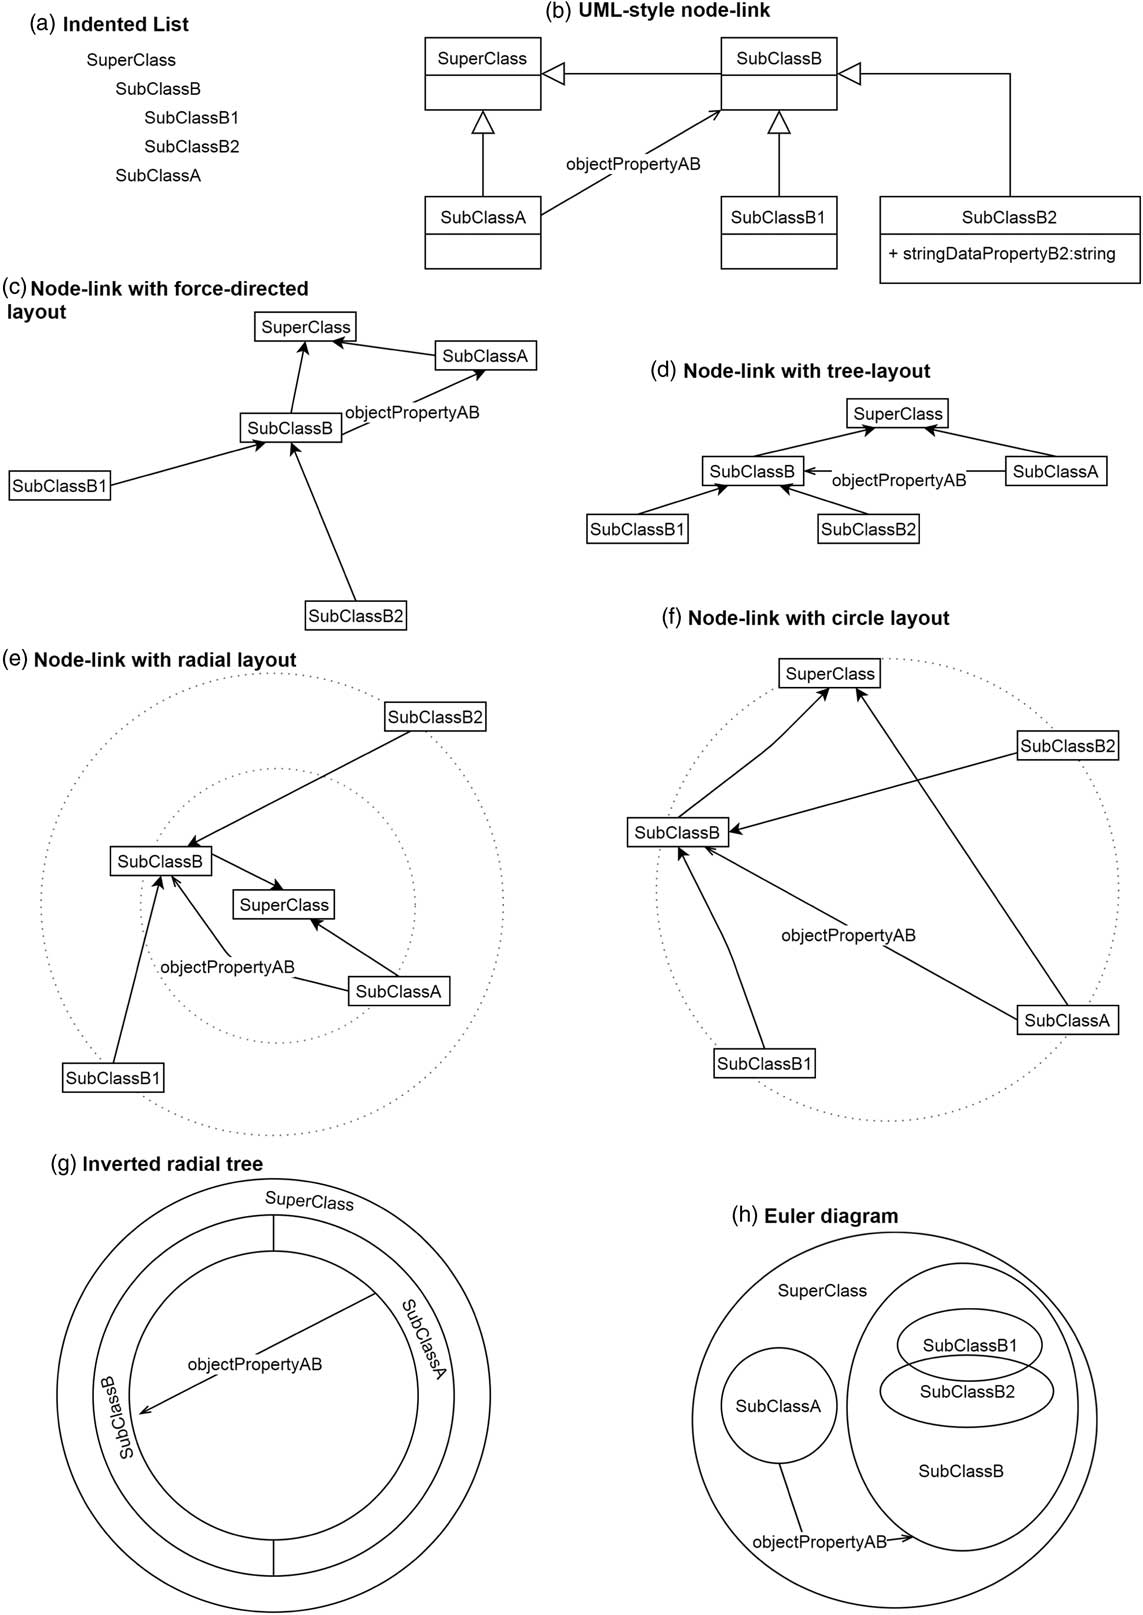
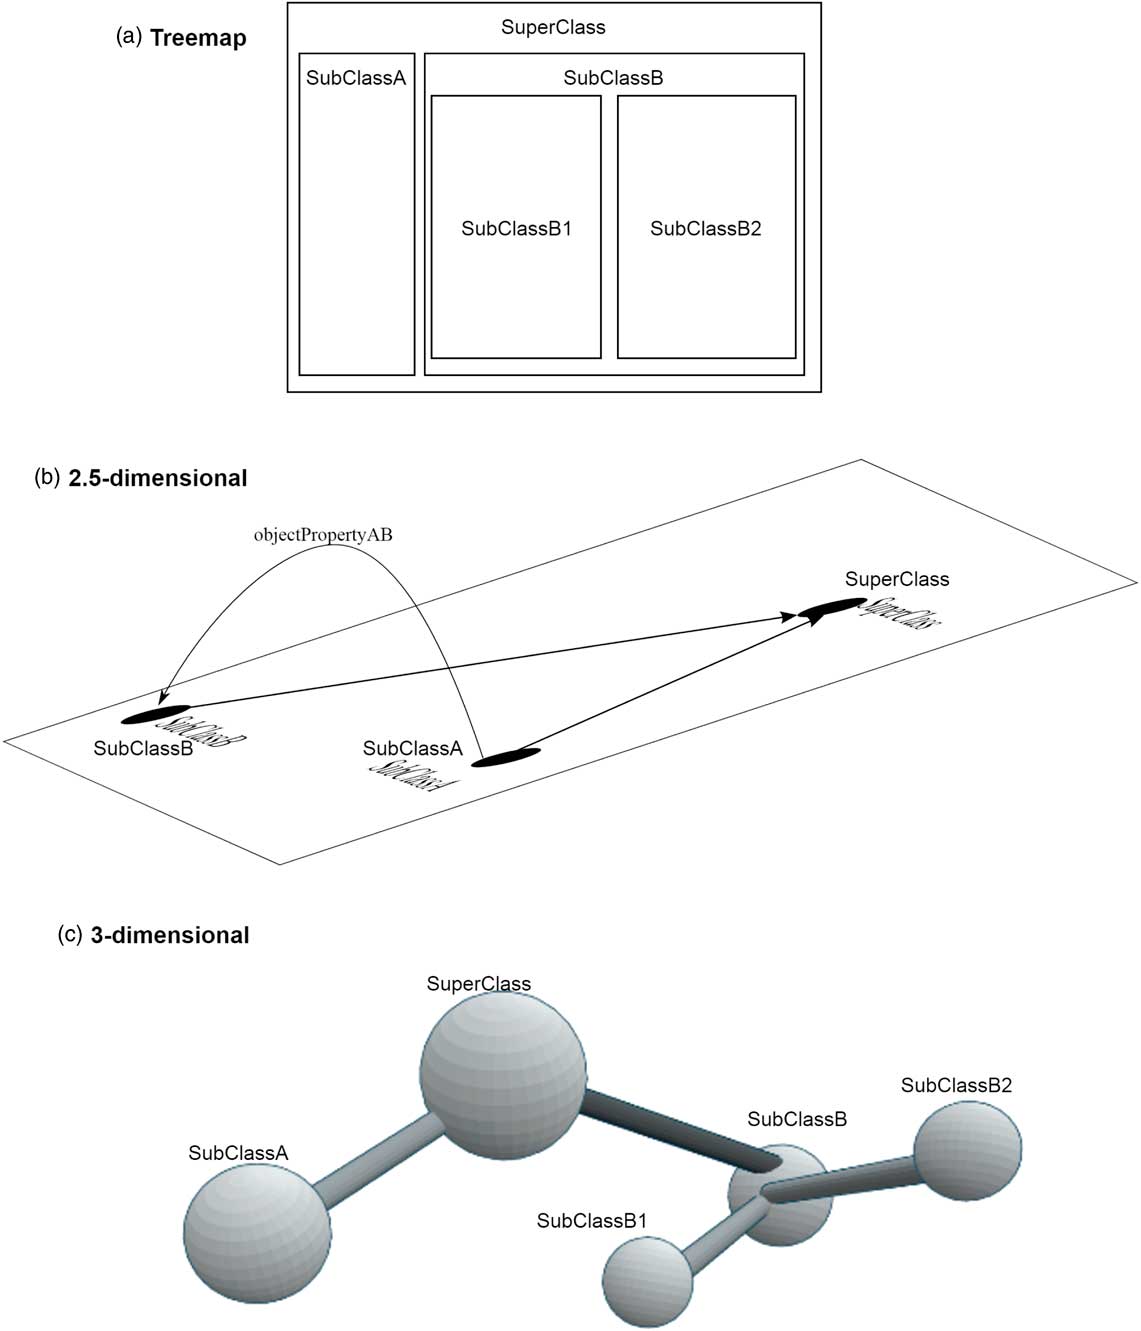
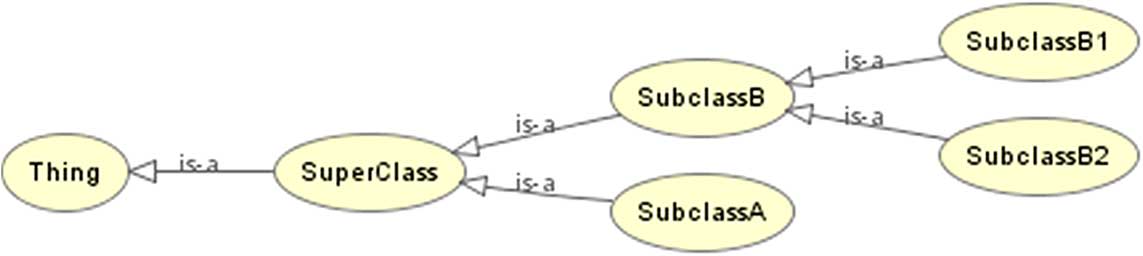
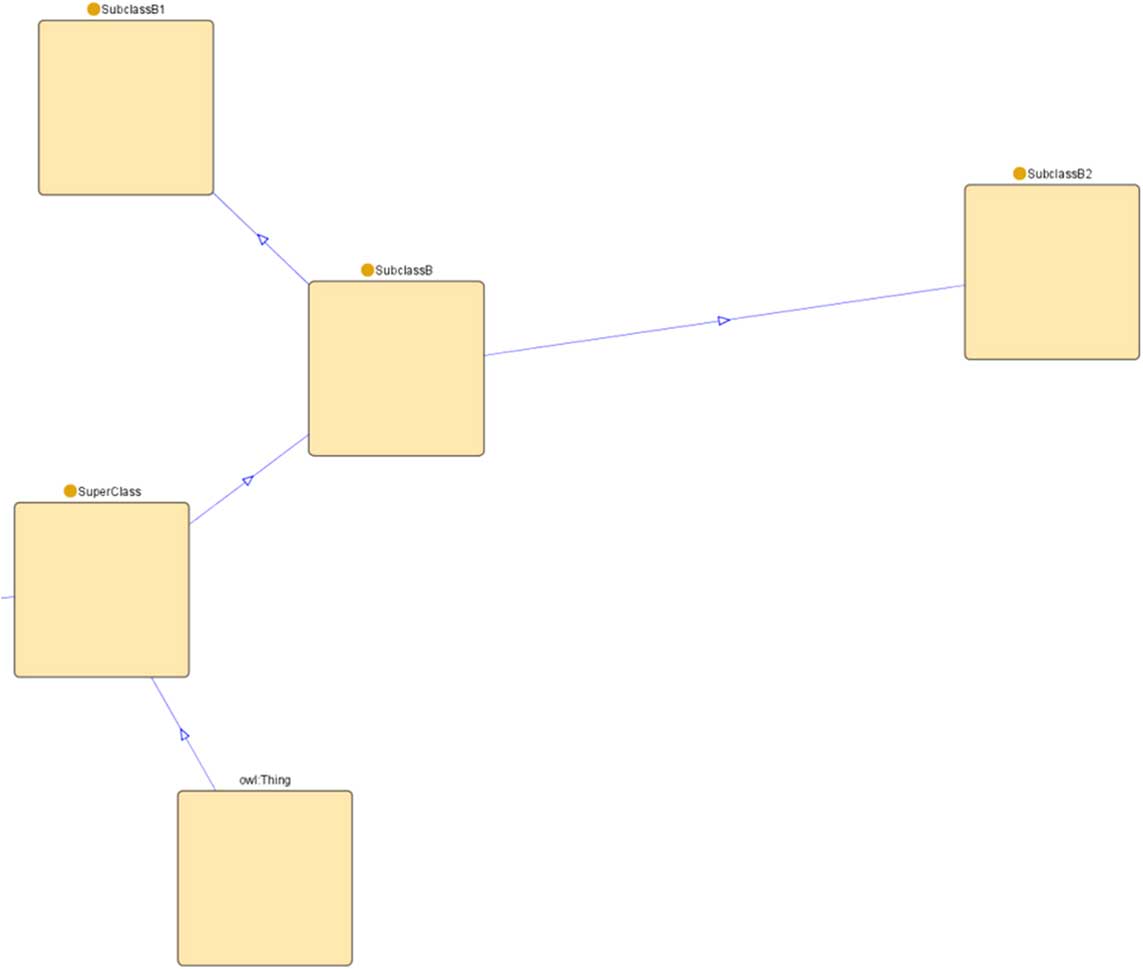
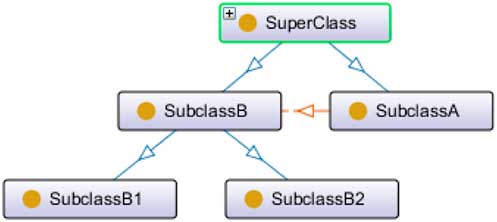
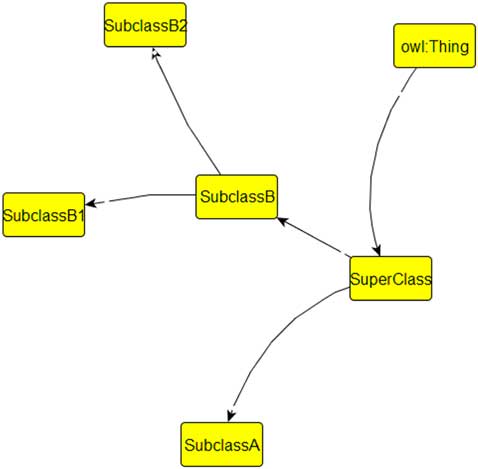
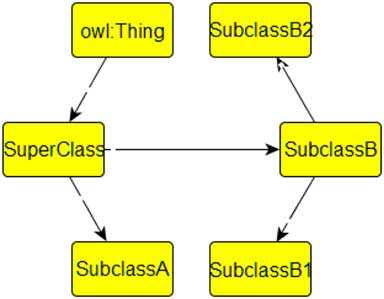
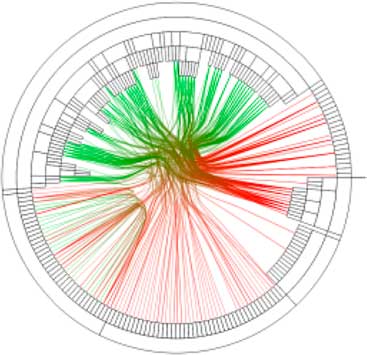
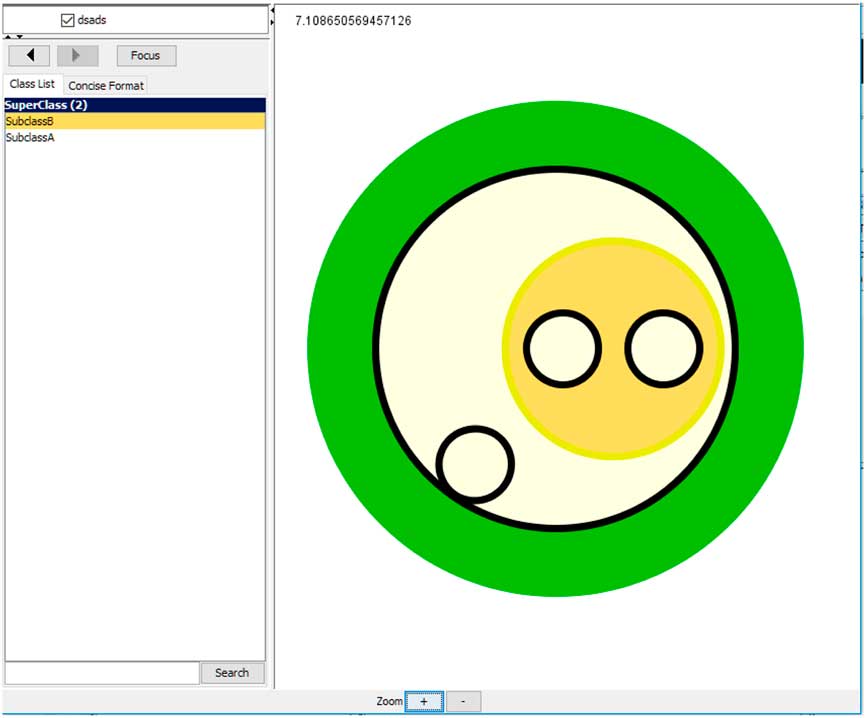
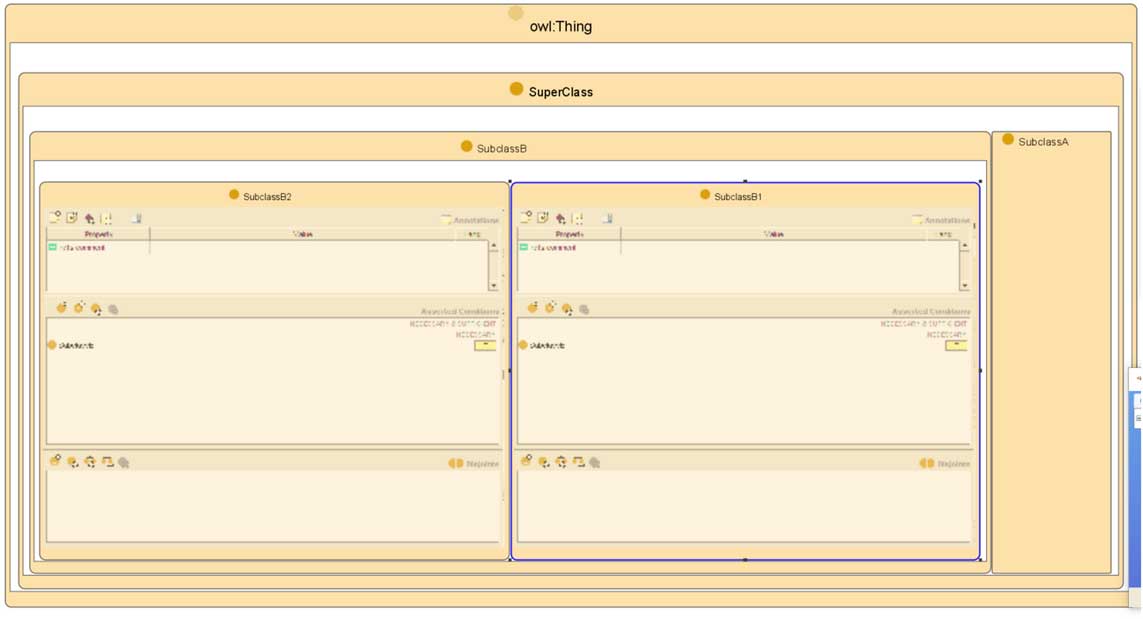
Figures 2 and 3 show schematic illustrations of the different visualization methods. All sketches depict the same ontology fragment consisting of five classes with hierarchical relationships between them, an object property and a datatype property. Selected entities are omitted in some of the sketches in order to keep them well-readable.
Schematic examples of visualization methods (part I)

Schematic examples of visualization methods (part II)
3.1 1.5-dimensional visualizations
3.1.1 Indented list
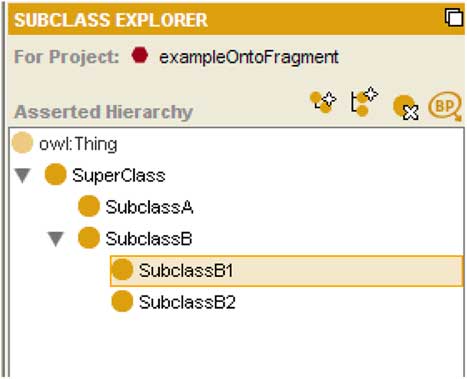
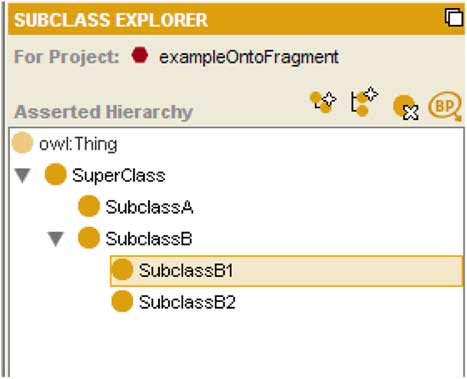
Indented list is a common and simple visualization method for ontologies displaying a list of entities where entities lower in the hierarchy are shown indented under their parent entity. It allows to visualize only one type of entities at a time and only hierarchical relationships between them. Indented lists use the relative position of the list items to indicate the hierarchy. The only graphical elements used by indented list are labels, often in combination with symbols or line fragments. A typical example of an indented list visualization is the Entity Browser in Protégé (see Figure 4 for a screenshot).
Example of an indented list visualization (screenshot from Protégé)
3.2 2D visualizations
In this category, we can basically distinguish between node-link visualizations, Euler diagrams, and treemaps as well as other space-filling layouts where nested or overlapping rectangles or circles are used to indicate the ontology hierarchy.
3.2.1 Node-link visualizations
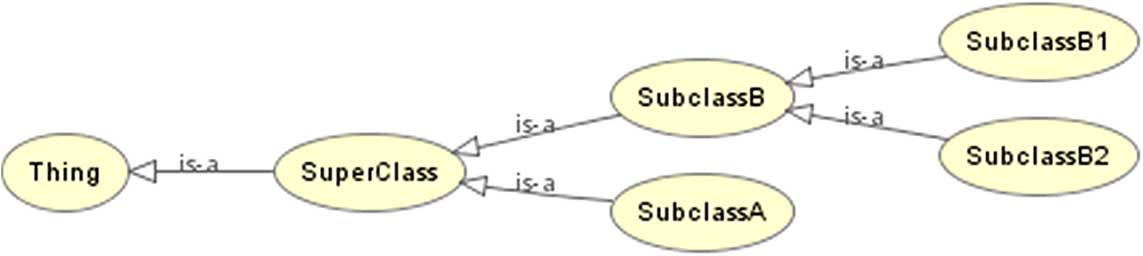
The node-link (or graph) visualization method, which is most frequently used in the surveyed ontology visualization tools, uses labeled nodes that are connected by (optionally labeled) links. Usually, the nodes represent entities, such as classes, and the links represent relations between them. Figure 5 illustrates a common example of a node-link visualization used by OWLViz to depict the ontology hierarchy.
Example of a node-link visualization (screenshot from OWLViz)
We can further distinguish subcategories of this method based on 1) the amount of textual information shown in the nodes and 2) the layout of the nodes:
Label-based categorization Based on the amount of textual information shown in the nodes, we can split node-link visualizations into two groups: 1) UML-inspired ones, where the node label consists not only of the name of the entity it represents but also includes other information, such as the list of data properties that are related to a class represented by the node, and 2) name-label-only visualizations, where each node is labeled only by its name, and no (or only very little) other textual information is shown in it.
Layout-based categorization There are five commonly used layouts in node-link visualizations, applicable to both UML-inspired and name-label-only methods. These layouts, which provide another dimension for the classification of ontology visualization approaches, are described below.
3.2.1.1 Force-directed layout
The force-directed (also called spring embedded) layout is one of the most common layouts for node-link visualizations. It is based on some algorithm that simulates a physical system where edges act as springs, while nodes repel each other and drag forces ensure that nodes settle. With a proper setting of the magnitudes of the forces, the visualization reaches an equilibrium where the nodes with most connections to other nodes are arranged in the center of the visualization and the least connected nodes are at the outer edge of the resulting graph (see Figure 6). Pleasant side effects of this method are that it tends to avoid edge crossings and overlapping nodes. A drawback is the inherent randomness of most force-directed algorithms, resulting in different node arrangements each time they are executed.
Example of a force-directed layout (screenshot from Jambalaya)
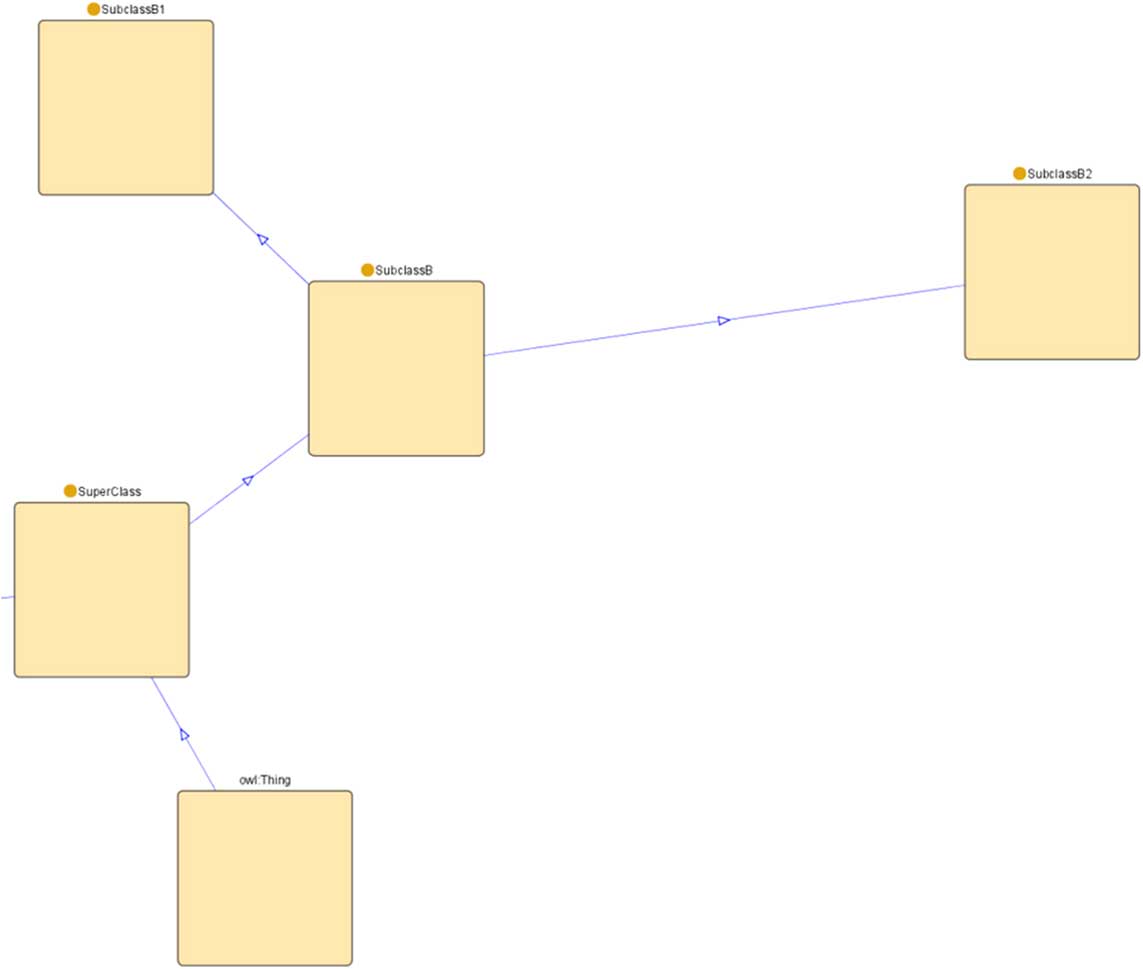
3.2.1.2 Tree layout
The tree layout is particularly suitable to represent hierarchical relationships in ontologies. The entity at the top of the ontology hierarchy is visualized at the top of the display area. Its children (according to the hierarchy) are placed one level (some constant distance on the vertical axis) below the root node, next to each other (also horizontally separated by a constant distance). Their children are placed on the second level below them, and so on (see Figure 7). This layout is typically of little use for the visualization of other than hierarchical structures. Even though the nodes can be laid out according to some artificially generated hierarchy, the non-hierarchical relationship links would usually cross other links and nodes due to the level-based node arrangement. However, in contrast to the force-directed layout, the tree layout remains constant in each execution of the algorithm, as long as the inheritance structure in the ontology does not change.
Example of a vertical tree layout (screenshot from the OntoGraf plugin for Protégé)
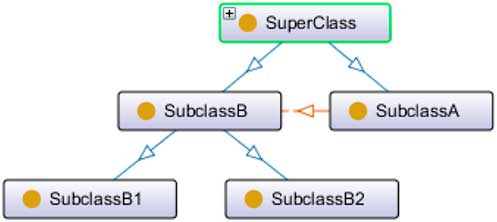
3.2.1.3 Radial layout
The radial layout is also common for the representation of hierarchical relationships. The root entity is positioned in the center of the display area, and its children are placed on an orbit around it. Their children are placed on the next orbit, one step further from the center, and so on (see Figure 8). The radial layout can be more space-efficient than the classical tree layout, as the number of nodes is usually growing on each hierarchy level. The space efficiency can be further increased by adding a hyperbolic distortion to the radial layout (Lamping et al., Reference Lamping, Rao and Pirolli1995).
Example of a radial layout (screenshot from the Graffoo plugin for the yEd Graph Editor)

3.2.1.4 Circle layout
In the circle layout, all entities are arranged in a way that they form one big circle (see Figure 9). This layout is sometimes used in combination with edge bundling techniques (Holten, Reference Holten2006) in order to visualize large numbers of relationships between the entities, in particular when the individual labels of the relationships do not need to be displayed.
Example of a circle layout (screenshot from the Graffoo plugin for the yEd Graph Editor)

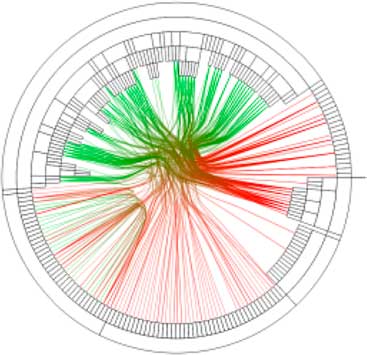
3.2.1.5 Inverted radial tree layout
The inverted radial tree layout is a combination of a space-filling and node-link visualization (see Figure 10). Nodes are laid out into a circle which may consist of several concentric rings if there are hierarchical relationships between the entities represented as nodes. Parts of the rings represent nodes. Nodes at the top of the hierarchy are displayed as parts of the outer ring. Their children are in the ring one-level closer to the center, and so on. Links start and end in the nodes in the inner ring to indicate other non-hierarchical relationships.
Example of an inverted radial tree layout (screenshot from the GLOW plugin for Protégé)
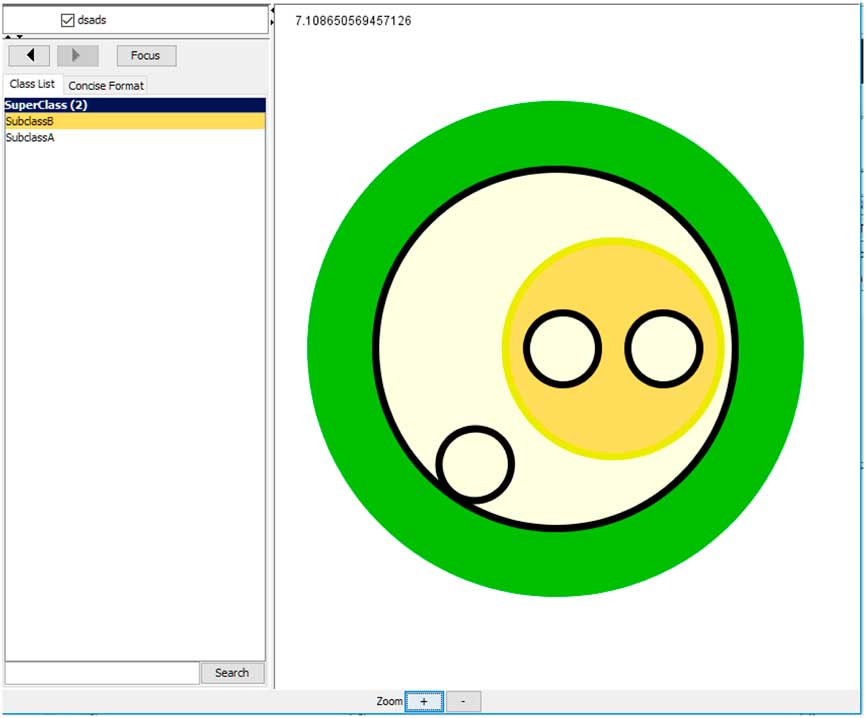
3.2.2 Euler diagrams
Euler diagrams depict entities based on hierarchical relationships as circles where a child (e.g. subclass) circle is inside the parent circle (see Figure 11). In contrast to other hierarchy-based techniques, the relative position of circles can represent other types of relationships, such as disjointness (when circles do not overlap)—as proposed by Howse et al. (Reference Howse, Stapleton, Taylor and Chapman2011). Euler diagrams can be combined with node-link visualizations where circles become nodes and links between them are added, as in OWLEasyViz (Catenazzi et al., Reference Catenazzi, Sommaruga and Mazza2009).
Example of a visualization using Euler diagrams (screenshot from SWOOP)
3.2.3 Treemaps
The treemap visualization method displays hierarchical relationships represented by relative position of entity rectangles. Child rectangles are shown inside their parent rectangle, whereas siblings are shown next to each other, that is, on the same nesting level (see Figure 12). Treemaps are related to Euler diagrams, except that they focus primarily on subsumption relations.
Example of a treemap visualization (screenshot from the Jambalaya plugin for Protégé)

3.3 2.5D visualizations
There is currently only one experimental ontology visualization method falling into this category. Ontoviewer (da Silva et al., Reference da Silva, Freitas and Santucci2012) uses a node-link visualization enriched with a third dimension for additional links (see Figure 13). Nodes are laid out on a 2D plane and some links are displayed as curves in the space above them.
Example of a 2.5D visualization (screenshot from Ontoviewer)

3.4 3D visualizations
The only available tool known to us showing ontologies in a 3D space is OntoSphere (Bosca et al., Reference Bosca, Bonino and Pellegrino2005). It offers several different views, which will be discussed in Section 5. Basically, it is a node-link visualization in 3D (see Figure 14). The main problem of 3D is that common computer screens are 2D and the view has therefore to be transformed from 3D to 2D, losing the advantages of depth perception. An advantage might be that the user can navigate in the 3D space and look at the visualized graph from different angles. In addition to OntoSphere, an experimental tool called OntoSELF rendering ontologies in 3D was developed by Somasundaram (Reference Somasundaram2007) as part of his PhD thesis, which is, however, not publicly available.
Example of a 3D visualization (screenshot from OntoSphere)

3.5 Temporal dimension
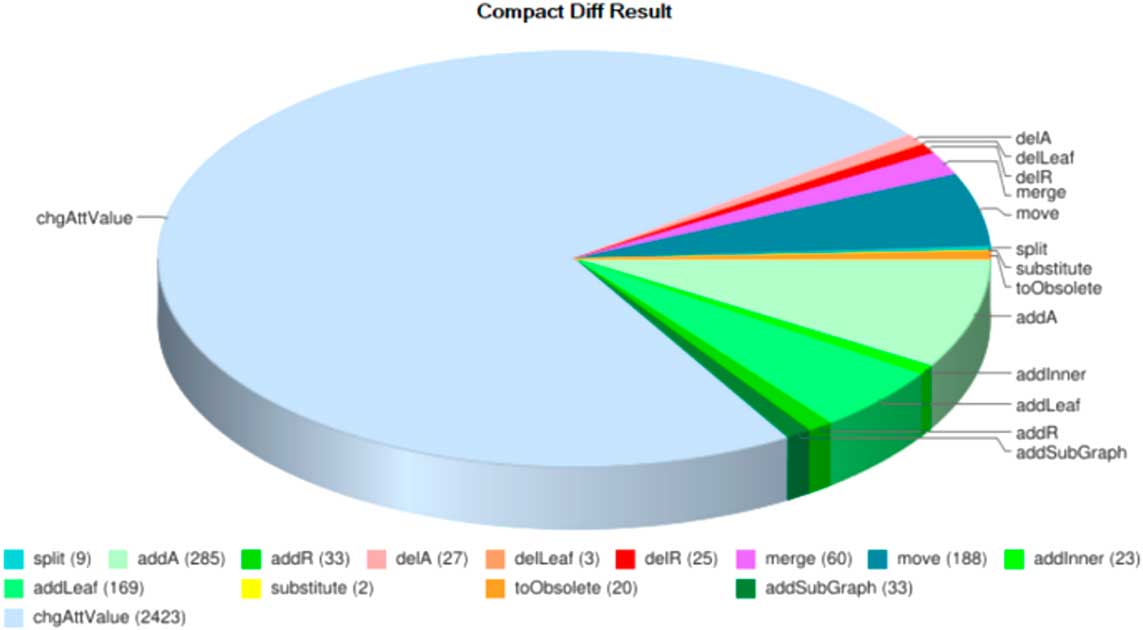
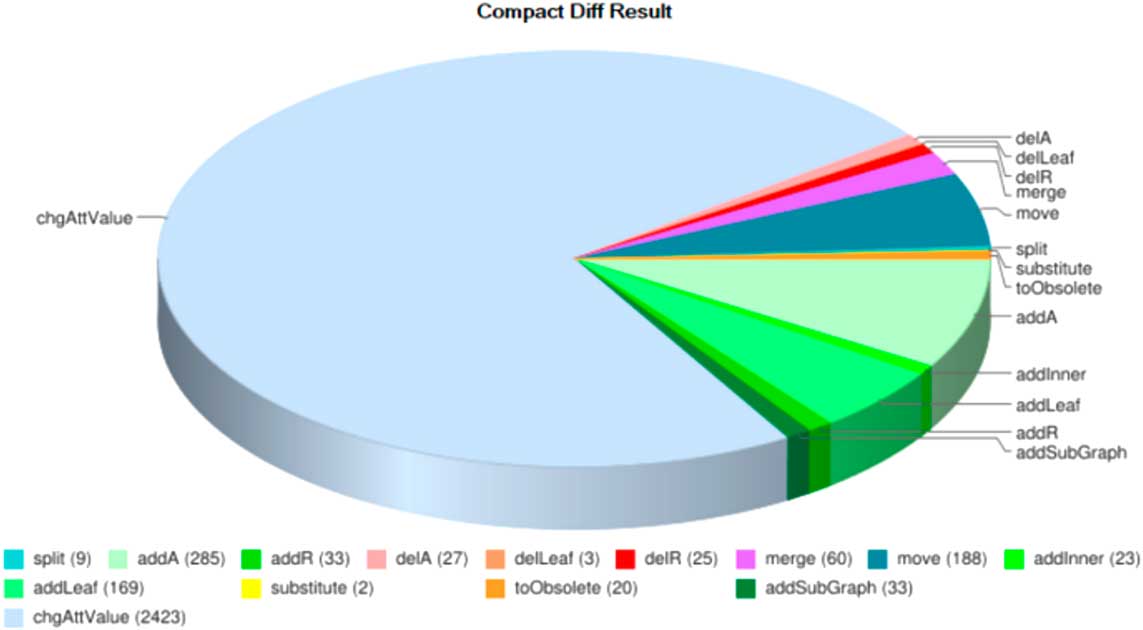
As already mentioned, there are some ontology visualization approaches that focus on other dimensions, in particular the temporal dimension to visualize changes made to an ontology over time. Lambrix et al. (Reference Lambrix, Dragisic, Ivanova and Anslow2016) presented a literature review of current ontology evolution systems, including a discussion on how they support ontology visualization. Although basic support is provided in some of the tools, Lambrix et al. clearly identified a lack of research on ontology evolution visualization. Burch and Lohmann (Reference Burch and Lohmann2015) basically distinguish between time-to-time and time-to-space mappings when visualizing the temporal dimension of ontologies. An example for the first are animations, while an example for the latter are multiple small diagrams depicting the ontology at different points in time, also known as a small multiples visualization (Tufte, Reference Tufte1986). Other tools use common visualization methods, such as pie charts, word clouds or trees, to depict changes in ontologies, such as the tool CODEX (see Figure 15) that tracks semantic diffs between different versions of an ontology (Hartung et al., Reference Hartung, Groß and Rahm2012). Another recent proposal to visualize ontology changes in Protégé has been made by Ochs et al. (Reference Ochs, Geller, Musen and Perl2017).
Example of a pie chart showing the number of changes by category (screenshot from CODEX)
4 Visualization and interaction techniques
The core component of each visualization tool is the implementation of some visualization method—in the previous section, we classified the ones implemented by existing ontology visualization tools. The second aspect of a visualization tool is the set of user interface (UI) and visual features that enrich the implemented visualization method. These are surveyed in this section. We differ between commonly used basic techniques (Section 4.1) and more advanced techniques, which are rarely implemented and still in a rather experimental stage of development (Section 4.2).
4.1 Basic techniques
In this section, we present a list of features that are often used to enrich the UI or visualization method of ontology visualization tools. These are also the features that we focus on in our survey of existing tools in the next section.
Radar view: showing a small ‘minimap’ of the visualized ontology; sometimes also called bird’s-eye view.
Graphical zoom: enlarging or decreasing the size of the displayed graphical elements.
Entity focus: centering the view on a selected entity and its surroundings, and hiding other parts of the ontology.
History (undo/redo): keeping the history of navigation steps performed by the user, and allowing for undo/redo actions.
Pop-up window: displaying details on a selected entity in a separate window or a tooltip.
Incremental exploration: starting with a small part of the ontology and adding other parts of the ontology to the visualization by gradually expanding the entities selected by the user (as detailed by Hermanet al., Reference Herman, Melancon and Marshall2000).
Search and highlight: performing a text-based search and highlight matching entities.
Filter parts: hiding parts of the ontology the user is currently not interested in to avoid a cluttered visualization.
Filter entity types: hiding all entities of a type (e.g. all object properties) in the visualization.
Fisheye distortion: applying a graphical transformation which resembles zooming in for a part of the graph and zooming out for the rest; focuses on a detail but keeps the context, see, for example, Sarkar and Brown (Reference Sarkar and Brown1992). A related concept are hyperbolic trees—we treat fisheye distortion and hyperbolic tree as synonyms here.
Edge bundling: grouping edges with similar paths, thus alleviating clutter; implemented, for example, in GLOW (Hop et al., Reference Hop, de Ridder, Frasincar and Hogenboom2012). Edge labels are usually not shown or only shown on demand in edge bundles.
Panning: moving the complete visualization around by dragging it or the background (in contrast to the use of scrollbars or alike).
Drag&drop: allowing the user to move individual graphical elements (e.g. nodes in a graph) around.
Textual editing: allowing the user to select elements of the visualization and edit them or their properties, for example, in a pop-up window.
Visual editing: allowing the user to create new elements, for example, by drawing edges between displayed nodes in a graph visualization to add property relationships.
4.2 Advanced techniques for large ontologies
The visualization of large ontologies can be considered as a problem related to large graph visualization. There is a number of techniques alleviating issues of large graph visualization, as surveyed by Herman et al. (Reference Herman, Melancon and Marshall2000) and more recently by Von Landesberger et al. (Reference Von Landesberger, Kuijper, Schreck, Kohlhammer, van Wijk, Fekete and Fellner2011). In the following, we discuss those that have been considered for large ontology visualization so far.
4.2.1 Concept clustering
In concept clustering, algorithms are employed that select and/or aggregate the most relevant and/or important concepts of an ontology and limit the visualization to these. Users can then further adjust and navigate the visualization as they wish. A crucial element is that the initial filtering is done for the users by the tool. Such a ‘smart’ filtering can be useful to get an overview of large ontologies, especially if they are not hierarchically organized. To the best of our knowledge, only a few attempts to implement such an advanced smart filtering approach have been made so far, namely in the tool KC-Viz (Motta et al., Reference Motta, Mulholland, Peroni, dAquin, Gomez-Perez, Mendez and Zablith2011), by Jiao et al. (Reference Jiao, Liu, Li, Marriott and Wybrow2013) and recently by Wiens et al. (Reference Wiens, Lohmann and Auer2017) for the tool WebVOWL.
4.2.2 Semantic zooming
Semantic zoom, in contrast to conventional graphical zoom that adjusts purely the size of the displayed elements, changes the level of detail of the visualization by showing or hiding information when the user zooms in or out. This can be combined with ‘smart’ filtering: by ordering the entities according to their computed relevance, less relevant entities can be displayed when zooming in and hidden when zooming out. Semantic zooming is a promising technique which has not yet been explored much in ontology visualization. One implementation has been proposed by Dmitrieva and Verbeek (Reference Dmitrieva and Verbeek2009), which is, however, very basic: the semantic zoom simply hides or shows a changing number of subclasses. A basic implementation of semantic zooming has also been realized in Jambalaya (Storey et al., Reference Storey, Musen, Silva, Best, Ernst, Fergerson and Noy2001), while a more advanced approach for node-link visualizations has recently been presented by Wiens et al. (Reference Wiens, Lohmann and Auer2017).
5 Ontology visualization tools
Prior to presenting the individual tools, we briefly describe the informal protocol we followed for literature analysis and tool testing, and summarize the testing results in tables.
5.1 Literature review and tool testing protocol
Our literature search followed two independent paths, yielding a joint set of relevant papers:
1. Keyword search. As the field under study is well-defined, we used the bigram ‘ontology visualization’ (and ‘ontology visualisation’, respectively), with the assumption that papers about relevant tools mention it at least once (be it possibly in the related research section only). We posed this query to three prominent Web resources: generic Google search, Google Scholar, and the ACM Digital Library. The number of hits we processed ranged between the first 170 and 250. We analyzed the retrieved papers for any references to ontology visualization methods and tools, also considering the related work sections of the papers. Adequate coverage was indicated by the fact that all nine OWL ontology visualization tools included in the older survey by Katifori et al. (Reference Katifori, Halatsis, Lepouras, Vassilakis and Giannopoulou2007)Footnote 8 were mentioned by the retrieved papers.
2. Event-centric exploration. In order to increase the likelihood to cover the most recent, living tools, we also went through the proceedings of all editions of the ‘visualization’ workshops collocated with Semantic Web conferences in the last 4 years, namely VISUAL 2014Footnote 9 (at EKAW 2014), VOILA 2015Footnote 10 , VOILA 2016Footnote 11 , and VOILA 2017Footnote 12 (at ISWC 2015-2017).
From the union of tools that were referenced in the retrieved papers, we considered all tools for the visualization of OWL ontologies. Overall, this resulted in 37 ontology visualization tools that were included in this survey. For each tool, we tried to find its most up-to-date version and run it. We used a PC with Windows 10 and another one with Ubuntu 14.04 for testing. If our attempt to run a tool was unsuccessful (following the available documentation), we did not try other configurations, assuming that other users would likely run into similar problems. Tools that we were able to run are described based on our test results in Subsection 5.4, whereas the other tools are described in Subsection 5.5 based on the information we found in the literature.
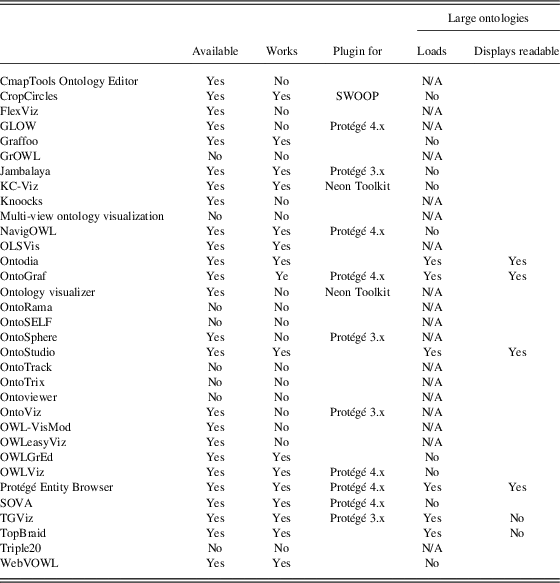
5.2 Overview tables
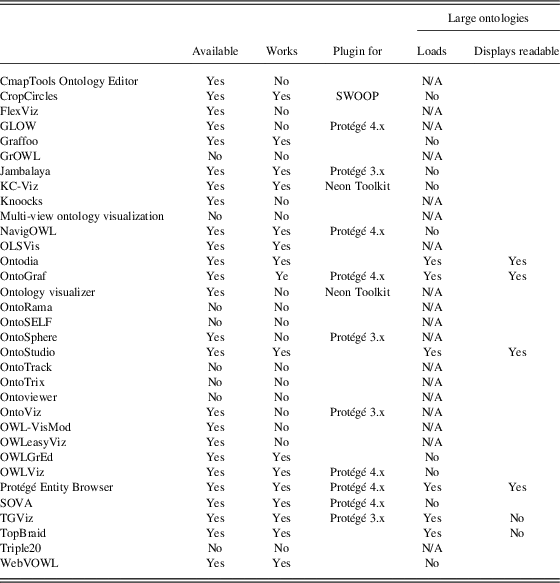
An overview of the availability of the tools is given in Table 1. The column ‘works’ tells whether we were able to run the tool. If the tool is a plugin for some ontology IDE, this IDE is referred to in the column ‘plugin for’. The last two columns, ‘loads’ and ‘displays readable’, indicate the support for large ontologies, that is, whether the tool was able to load a large ontology without crashing, and if so, whether the result was a readable visualization. As a ‘large ontology’ for testing the loading and visualization capabilities, we used the SUMO ontologyFootnote 13 with several thousands of classes. We considered the ontology successfully loaded when the tool finished the loading process without encountering any error and displayed at least some result. ‘N/A’ in the ‘loads’ column means that we were not able to test the loading capability of the tool due to technical issues. The result was considered readable when at least some information could be recognized from the visualization.
Reviewed tools: availability, functionality, and capability to load and display large ontologies
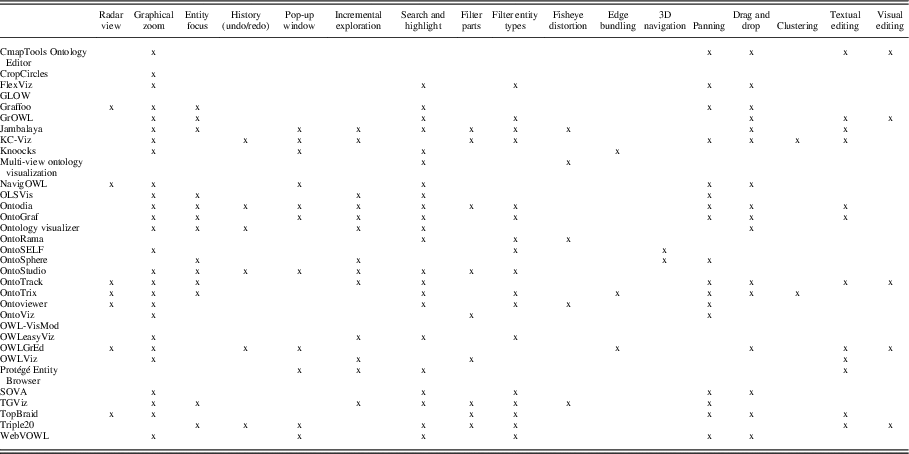
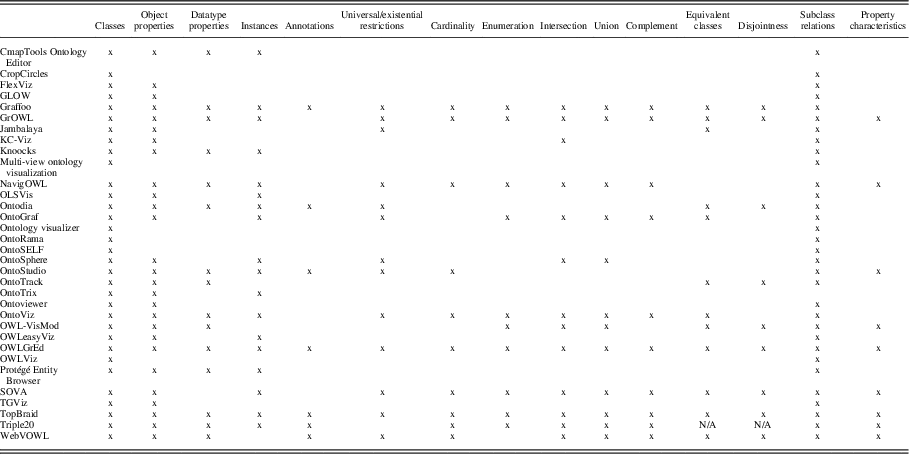
In each tool, we examined what and how visualization methods are implemented, the support of interaction techniques (as listed in Section 4) and which OWL constructs are visualized (what we denote as OWL coverage). An overview of the supported interaction techniques is given in Table 2. We used OntoViBe (Haag et al., Reference Haag, Lohmann, Negru and Ertl2014), an artificial ontology for benchmarking ontology visualization tools, to determine the OWL coverage. An overview of the OWL coverage in the tools, which we were able to run and load OntoViBe into, is given in Table 3. The last table (Table 4) shows which retinal properties are used by each tool. The tables include the structured information we were able to gather systematically. The textual descriptions focus on the visualization method and discuss core interaction techniques and information about OWL coverage, if this information was available.
Interaction techniques provided by the reviewed tools

3D=three-dimensional.
OWL constructs visualized in the reviewed tools

Retinal properties used by the tools

5.3 Summary of the tools’ performance and suitability for various use cases
Most of the existing work discussing the performance of the tools in various situations is based on evaluations with users (as detailed in Section 6). Although such work usually indicates which tools enable the users to perform a specific task faster or easier, it rarely tries to find out some general reasons why users perform better in one tool than some other. There are only few attempts on assessing the tools’ performance with respect to some general requirements. Katifori et al. (Reference Katifori, Halatsis, Lepouras, Vassilakis and Giannopoulou2007) compare ontology visualization methods based on their support of Shneiderman’s visualization tasks (Shneiderman, Reference Shneiderman1996). Schaaf et al. (Reference Schaaf, Jahn, Tahar, Kücherer, Winter and Paech2016) define the following criteria for ontology visualization tools: performance, maintenance, usability, functions and topicality. Topicality and usability reflect how well the tool is maintained and supported by documentation. Maintenance and functions show whether the tool offers selected features, and performance means whether the tool is well optimized and responses fast enough to user input. Both approaches are to some extent based on assessing what features or functions each tool supports. The Ontology Visualization Tool Recommender (OVTR) (Dudáš et al., Reference Dudáš, Zamazal and Svátek2014) works in a similar way. The suitability of each tool for each use case category stored in its knowledge base was assessed based on the amount of implemented features considered important for that use case category.
A simple rule followed (to some extent) in all three mentioned approaches is that the more features relevant to a given use-case a tool offers, the better it is for that use-case—of course, provided that the features are well implemented and integrated into the UI. The most feature-rich tools in our survey are KC-Viz, Jambalaya and Ontodia. We suppose that the reason why many tools do not support all the well-known, easily implementable features is that most of the tools are created as experimental prototypes in research projects, and there is usually not enough time and other resources for a wide-coverage implementation.
A similar situation is with other criteria mentioned by Katifori et al. (Reference Katifori, Halatsis, Lepouras, Vassilakis and Giannopoulou2007) and also used by OVTR: OWL completeness, or the amount of OWL constructs visualized by the tool. The difference is that the visualization of selected constructs can be more complicated in some visualization methods than in others. Tools in our survey that visualize all OWL constructs mentioned in Table 3 are OWLGrEd and TopBraid.
The last and most problematic criteria or requirement that we would like to mention is performance. Ideally, an ontology visualization tool should be able to load a large ontology and be responsive to user input without unreasonable delays, as also mentioned by Schaaf et al. (Reference Schaaf, Jahn, Tahar, Kücherer, Winter and Paech2016). Fulfilling this requirement requires extra time spent on the tool implementation, which is often not available during research projects. This leads to the situation that only five tools in our survey are able to load large ontologies, as shown in Table 1: Ontodia, OntoGraf, Entity Browser, TGViz and TopBraid.
This could make Ontodia one of the best visualizers as it supports large ontologies and at the same time includes most of the discussed features. The problem is, however, that Ontodia displays only a part of the ontology selected manually by the user, and thus is suitable only for some use cases. A similar situation is in the case of OntoGraf and TopBraid. The result is a situation where choosing a suitable visualization tool is a complicated task and where a recommender such as OVTR can help. OVTR takes into account the intended use case, size and OWL constructs used by the ontology to be visualized.
5.3.1 Suitability of tools for various visualization use case categories
OVTR’s recommendations of suitable visualization tools for given use-case categories (the categories were described in Section 1.1) are based on the level of support of features and techniques that are considered important for the category. Here, we offer a brief summary based on Dudáš et al. (Reference Dudáš, Zamazal and Svátek2014). Moreover, we provide approximated suitability scores along with the tool descriptions (of tools covered by OVTR) in Section 5.4. The weights of the corresponding rules inside OVTR were approximated to the scale ‘very weak—weak—strong—very strong’. These scores are, however, rather illustrative. For the actual choice of a suitable tool, it is better to use OVTR directly, as it takes into account also the ontology size and OWL constructs used in it.
The most suitable tools for editing are Jambalaya and OWLGrEd, mainly thanks to the obvious reason that the editor controls are well-integrated with the visualizations. They also offer text search for entities (e.g. an entity to be edited) and easy access to detailed properties of an entity in a pop-up window.
The most recommended tools for inspection are Ontodia, Jambalaya and KC-Viz, thanks to the fact that they enable focusing the visualization on the desired part of an ontology to be inspected.
The best tool for the learning category is KC-Viz, thanks to its ability to automatically select important concepts and thus display an overview of large ontologies. This ability is unique among the tools that are available and working. However, it is reduced due to technical limitations of KC-Viz regarding the loading of very large ontologies.
KC-Viz is also the most suitable tool for sharing, followed by Ontodia and Jambalaya. These tools are considered suitable as they allow limiting the visualization to a selected part of the ontology and at the same time enable the user to manually lay-out the visualized entities according to the needs of the particular use-case.
5.4 Available and working tools
This subsection describes the 17 tools that we were able to acquire and run. The information is based on our own experience with the tools.
5.4.1 CropCircles
CropCircles (Wang & Parsia, Reference Wang and Parsia2006) is a visualization tool hidden inside the SWOOP ontology editor under the command ‘fly the mothership’.
5.4.1.1 Visualization Method
CropCircles offers a simple implementation of Euler diagrams.
5.4.1.2 UI Features
The tool offers very limited functionality. Although we include it in the section of usable tools, it is useful only for the basic display of class hierarchies.
5.4.2 Graffoo
Graffoo is a manual drawing tool. It cannot import/export from/to any OWL format. It is available as a palette profile for the yEd Graph Editor.
5.4.2.1 Visualization Method
Graffoo allows drawing node-link diagrams. The user is responsible for placing the nodes, however, various layouts can then be applied automatically, based on radial and tree layout algorithms. Class and datatype nodes are differentiated by shape and color, so are different types of properties, displayed as links according to their domain and range. A strange fact is that there is no special kind of visualization for subClassOf axioms (there are special links only for object and datatype properties). Those are to be created as other axioms.
5.4.2.2 UI Features
All UI features are those offered by the universal yEd tool—there are no OWL-specific features. yEd also includes an ‘overview’ window, which is a radar view, a ‘neighborhood’ window, which basically implements a focus on selected entities, and a ‘structure view’ resembling an indented list view, however, without differentiating between subClassOf and other axioms.
5.4.2.3 OWL Coverage
Any OWL construct can be drawn in Graffoo as it shows most language features ‘at the RDF level’ (i.e. as individual triples). That, on the other hand, leads to less effective visualizations, as many different constructs are visualized using the same graphical elements, with the same color, shape, etc.
5.4.2.4 Suitability
Graffoo is considered little appropriate for most use case categories except sharing, where its suitability is strong according to the OVTR heuristic.
5.4.3 Jambalaya
Jambalaya (Storey et al., Reference Storey, Musen, Silva, Best, Ernst, Fergerson and Noy2001) is a complex visualization plugin for Protégé 3. Its development ended and it does not run in Protégé 4 or newer. However, the tool is still available and we were able to run and use it.
5.4.3.1 Visualization method
Jambalaya combines several visualization methods and lets users switch between them as they wish, or even to create a custom view setting up a combination of methods (treemap or node-link), layout algorithm (force-directed, tree), node style and filter (what types of nodes and edges should be displayed). It is the most flexible visualization tool of this survey. There are several predefined views: Nested View shows an ontology in a treemap with relationship edges between class rectangles. Nested Treemap is the same treemap only without relationship edges. Nested Composite View shows every top-level class (a direct subclass of owl:Thing) as a separate treemap node. Class Tree is a node-link visualization with vertical tree layout. Domain/Range is a property-centric view displaying all properties as edges between classes shown in a graph with spring layout (classes not participating in a domain/range relationship are hidden). All views depict classes and instances as nodes (or treemap rectangles) and relationships between them, including properties (based on their domain/range), as edges connecting the nodes (or rectangles). Jambalaya is closely integrated with Protégé: class and instance nodes or rectangles can be zoomed-in to display their Protégé editor window inside them. Class nodes/rectangles can be expanded or retracted (their subtrees can be shown/hidden).
5.4.3.2 OWL coverage
Jambalaya can show class hierarchy and properties. Instances can be included in the visualization. Existential and universal restrictions are shown as edges between the involved classes. The edge is distinguished from others only by color and the details about the restrictions are shown only in a tooltip window after the user hovers over it with the mouse pointer.
5.4.3.3 UI features
The details-on-demand feature is offered as the Protégé editor window shown inside the node when it is zoomed in. It shows not only the details but also allows to edit them. Graphical zoom is possible only using GUI buttons. Some kind of overview zoom can be achieved, but often leads to overlapping and thus unreadable node labels.
5.4.3.4 Suitability
Jambalaya’s suitability is strong for the learning category and very strong for the remaining categories, according to OVTR.
5.4.4 KC-Viz
KC-Viz (Motta et al., Reference Motta, Mulholland, Peroni, dAquin, Gomez-Perez, Mendez and Zablith2011) is integrated in Neon Toolkit—an OWL ontology IDE similar to Protégé.
5.4.4.1 Visualization method
It displays only classes as circular nodes and hierarchical is-a relationships as links between them using node-link tree layout visualization method.
5.4.4.2 UI features
The unique feature of this tool is an option to visualize key concepts. Key concepts are the most important classes from the ontology selected using an automatic ranking algorithm. The algorithm computes a score of each class based on seven criteria including density (how many axioms is the class used in), or criteria inspired by psychology or linguistics. The user can choose how many of such key concepts are to be displayed. All other classes are then hidden, but can be revealed using incremental exploration. If there is an indirect is-a relationship between two displayed classes and the direct superclass of some class is hidden, the indirect relationship is displayed as a link distinguished from direct relationships by a dotted line. Classes hidden inside the relationship may be revealed if the user moves the mouse pointer over it. Incremental exploration is implemented. Before each step, the user has to choose how many new key concepts are to be shown and several other parameters.
5.4.4.3 Suitability
KC-Viz is strong in the editing category and very strong in other categories, according to OVTR.
5.4.5 NavigOWL
NavigOWL (Hussain et al., Reference Hussain, Latif, Rextin, Hayat and Alam2014) is a Protégé 4 plugin.
5.4.5.1 Visualization methods
NavigOWL uses a node-link force-directed visualization method. The tool offers several alternative layout algorithms. Circle layout moves all nodes to form one big circle. Random layout is exactly what the name suggests—nodes are placed arbitrarily. Optionally, the size of the nodes might represent the number of links they are participating in.
5.4.5.2 OWL coverage
The mapping of OWL constructs to graphical elements is done at the RDF triple level. Although all OWL constructs are displayed thanks to that, the visualization is hard to read. Predicates are visualized as links between nodes which represent subjects or objects of triples—according to the predicate link direction. Nodes are drawn as color-filled circles, where the color specifies the type of the entity (class/instance/etc.). All entities, even Datatype and Object properties, are displayed as nodes. So, for example, an object property with range and domain specified is drawn as a node with two links: one to the class that is the domain of the property and another to the class that is the range of the property. Anonymous classes are also represented by a separate node. For some reason, visualization of some kinds of relationships is omitted—for example, cardinality is not displayed.
5.4.6 Neon Toolkit ontology visualizer
Neon ToolkitFootnote 14 is an ontology development platform similar to Protégé based on the Eclipse environment. It was being developed since 2006 as a 4-year EU project and the last version is from 2011. It offers an indented list view of entities very similar to the one that is available in Protégé, the only difference is that in Neon Toolkit, all entities are in one window, separated under folder-like top-level nodes. Aside from the indented list view, a simple visualization is integrated in the editor called Ontology visualizer.
5.4.6.1 Visualization method
Ontology visualizer uses node-link with force-directed layout. It displays only classes as small rectangular nodes with labels next to them and Subclass of relations as links.
5.4.6.2 UI features
Zoom is possible but affects only the length of the edges and so the result of zooming out to get an overview is just a pile of overlapping nodes and their labels.
5.4.6.3 Suitability
Ontology visualizer is weak in editing and strong in the remaining categories according to OVTR.
5.4.7 OLSVis
OLSVisFootnote 15 is a Web-based application restricted to show only several pre-loaded ontologies focused on biology.
5.4.7.1 Visualization method
Standard force-directed node-link visualization is used. No graphical symbols are present, both links and nodes are marked just with labels. An indented list overview of displayed elements is provided.
5.4.7.2 UI features
In addition to common drag&drop layout of nodes and zoom and pan, OLSVis allows fixing a selected node so that it is no longer affected by the force-directed layout and, what we have not seen in any other tool, allows adjusting the length of a selected link while keeping the effects of the force-directed layout.
5.4.8 Ontodia
Ontodia (Mouromtsev et al., Reference Mouromtsev, Pavlov, Emelyanov, Morozov, Razdyakonov and Galkin2015) is a Web-based ontology and semantic data set visualization tool with additional functionality in sharing and distribution of resulting diagrams.
5.4.8.1 Visualization method
Ontodia utilizes the 2D node-link visualization approach adopting UML-inspired way of displaying additional information about the node. In terms of layouts the tool offers force-directed and grid layouts. It includes the hierarchical relationships view that displays the parent–child relationships between classes in a tree-layout. Since the tool claims ability to visualize semantic datasets it enables drag-n-dropping instances on the diagram as well. The view of the diagram could be freely adjusted by a user through drag-n-dropping additional items on canvas, rearranging them, removing nodes from the graph, turning links between nodes on and off.
5.4.8.2 UI features
Ontodia supports data exploration capability so that the user can sort out the nodes related to selected node, then from instance panel he can grag-n-drop one or several related nodes on canvas thus expending the graph and exploring the ontology. The tool has rather unique diagram management features that allow users to publish the fixed URL of the diagram on the Web, share it with others via email address or lock it to themselves. The tool introduces the data source entity, access to later can be managed similar to controlling access to a diagram. Searching and filtering is fully available for classes, instances and links. The tool has integration means with webProtégé, which is implemented by allowing users to link the data source in Ontodia with the project on webProtégé and Ontodia will be syncing the data automatically with it.
5.4.8.3 OWL coverage
Apparently Ontodia was designed to simplify the visualization of ontologies and semantic data, due to that some of OWL constructs were omitted and only the basic ones are kept on the graph.
5.4.8.4 Suitability
Ontodia is weak for learning and very strong for the remaining use-case categories according to OVTR.
5.4.9 OntoGraf
OntoGraf (Falconer, Reference Falconer2010) is a visualization plugin integrated in Protégé 4.
5.4.9.1 Visualization method
It implements node-link visualization method in a similar way as TGViz or Jambalaya—in fact, it uses some libraries from Jambalaya. It displays classes as rectangular nodes labeled with their names. OntoGraf offers basically all well-known layout algorithms and the user can freely switch between them. Graphical zoom is unlimited in both directions.
5.4.9.2 UI features
The navigation is possible only in the way of incremental exploration. A separate Protégé indented list of classes is displayed and the user can freely select the classes to be displayed in the main window. Each class node can be expanded. The user can choose to expand only a specific relation or all of them at once. Incremental exploration is, however, the only way of browsing the ontology—the whole expanded ontology cannot be displayed automatically, only if the user clicks on all classes and expands them. Graphical zoom is implemented. If nodes become too small when zooming out, their labels are hidden automatically, so it is possible to get some sort of overview even for larger ontologies but only if the user manually displays all desired entities, which is very time-consuming effort that is difficult for small ontologies and practically unthinkable for, for example, hundreds of classes. Details-on-demand are available for classes in a form of a tooltip window, but not for properties. Search is implemented, but the consequence of the search result is moving focus to the class found according to the input. This means that any additional classes that were displayed before are hidden. Filtering is limited to a node or edge type. That means all classes or all instances can be hidden or, for example, all subsumption relations, but a particular edge cannot be hidden.
5.4.9.3 OWL coverage
Links between classes represent not only hierarchical relations and properties related by domain/range but also more complex OWL constructs like restrictions. Details about the restriction are displayed in a textual form if the user moves the mouse pointer over it. Properties are displayed as links without labels; distinguished only by color (each property has its own color). Name of the property is shown when the mouse pointer hovers over the link. OntoGraf visualizes all types of entities except Datatype and Annotation properties. Object properties are visualized only if they have domain and range explicitly specified. From the group of complex classes, only intersection is displayed, and in a way indistinguishable from a multiple subClass Of relationship. Property restrictions are visualized in the same way as properties, as a links between the class described by the restriction and the class used as a restriction, with an equal-like label. That is a bit confusing, because equivalence between classes is not visualized, nor is disjointness.
5.4.9.4 Suitability
OntoGraf is very strong in the inspection use-case category and strong in the remaining categories according to OVTR.
5.4.10 OntoStudio
OntoStudioFootnote 16 could be clearly defined as an ontology modeling environment. OntoStudio (Weiten, Reference Weiten2009) is a commercial software, which is still being marketed, thus we should declare it to be of a same kind as TopBraid Composer. The downloading and installation process are simple and do not require any special knowledge. OntoStudio belongs to desktop applications category and claims to be platform independent—thanks to its Java language origin.
5.4.10.1 Visualization method
One can find two types of visual representations available in OntoStudio. Ontology can be visualized at any point of authoring process by clicking ‘Visualize Ontology’ from the context menu. Ontology visualization employs widely used node-link approach coupled with radial layout. Visualization of ontologies in OntoStudio also enables incremental exploration allowing to expand any class by right-click on any entity. Besides showing the classes ontology visualizer pulls out the individuals and properties on canvas if the user happens to navigate to them. When the number of nodes exceeds 10 the graph tends to be hardly readable due to usage of radial layout that does not allow to indicate hierarchical dependencies. We believe that the last observation led the creators of the tool to idea of introducing the tree view option. It could be invoked by clicking any class in the class tree and then selecting the ‘Generate Graph’. The resulting tree-based graph is not interactive, but seems to be a good addition to ontology visualizer.
5.4.10.2 UI features
The general UI layout in the tool is very similar to Protégé. The class tree is placed in the top left corner and the instances pane is located right underneath it. The properties pane occupies the largest space in the middle. Ontology editing is not possible in any of the graph views, but once the new edit is done, the graph views should be regenerated. Overall the UI is rather intuitive and composing a simple ontology did not constitute a serious challenge for the authors.
5.4.10.3 OWL coverage
OntoSudio supports major portion of OWL expressiveness when it comes to properties although the complex classes are not provided for.
5.4.10.4 Suitability
OntoStudio is quite strong in sharing and slightly weaker in learning while inspection and editing support are rather weak.
5.4.11 OWLViz
OWLVizFootnote 17 is a visualization plugin bundled with Protégé 3.x.
5.4.11.1 Visualization method
It displays only classes and is-a relationships with node-link tree layout.
5.4.11.2 UI features
It is integrated with Protégé indented class list view, where the user can choose a class that should be displayed. When a class is chosen, the user is asked to enter the size of the neighborhood area to be displayed—how many levels of sub- and superclasses of selected class should be displayed. There is also a button for displaying the entire ontology.
5.4.12 OWLGrEd
OWLGrEd (Bārzdiņš et al., Reference Bārzdiņš, Bārzdiņš, Čerāns, Liepiņš and Sprog´is2010) is a standalone application offering interoperability with Protégé 4.
5.4.12.1 Visualization method
OWLGrEd visualizes ontologies using a UML-inspired method. Classes are depicted as UML classes—simple rectangles or boxes labeled with the name of the class. The box can contain a list of properties and their ranges that have given class as a domain. Object properties can also be represented by relational links labeled with the name of the property and with UML style cardinality specification. Class boxes can contain anonymous class description in a textual form. Universal and existential restrictions are represented by relational links like properties and distinguished by red color (which is not a native UML feature). Subclassof relationships are depicted by UML generalization links. If two subclasses are disjoint, a fork-style link is used for the subclassof relation representation and by using additional redundant link to display disjointness. Boxes are also used for instances and enumerations. They are distinguished from class boxes by using a different color or in some cases using UML stereotypes.
5.4.12.2 UI features
Editing is possible by directly drawing the UML style diagram. The ontology can then be automatically loaded into Protégé or the other way around, an ontology can be loaded from Protégé and visualized.
5.4.12.3 OWL coverage
OWLGrEd displays all of the OWL features that were tested, although most of them only in the form of labels and not as graphical elements. Restrictions and complex classes are just described inside the class nodes using Manchester syntax. Property characteristics and property hierarchical relationships are displayed also only as labels next to the property name.
5.4.12.4 Suitability
OWLGrEd is very strong in editing, weak in inspection and strong in learning and sharing according to OVTR.
5.4.13 Protégé Entity Browser
Protégé is an open-source ontology development platform or simply an ontology editor. The development of Protégé started in 1980s and is still in progress. Basic information about the architecture and UI is described in Knublauch et al. (Reference Knublauch, Fergerson, Noy and Musen2004). Although it is an older article, the principles are the same or very similar in newer versions of Protégé. As a development platform, it has an architecture supporting plugin development. Many such plugins have been developed and some of them are aimed at ontology visualization. Those are described separately. Protégé itself contains basic indented list ontology visualization as an integral part of its graphical UI called Entity Browser.
5.4.13.1 Visualization method
It is implemented as a typical indented list. Each type of entity—class, datatype property, object property, annotation property and individual—has a separate window called Entity Browser with a separate indented list. Subclasses or subproperties are displayed indented under its parent element, each subclass or subproperty list can be retracted or again expanded by clicking on the parent element. The elements are depicted by a simple geometrical shape—circle is used for classes, rectangle for datatype, object and annotation properties and individuals are depicted by rhombus. Each type of element is also distinguished by a different color. Next to the shape is a label that can contain the name of the given entity or its label or a value of another annotation property—as the user chooses. The usage of colored shapes might seem redundant as the type of the displayed entity is already specified by the window it is in (there is a separate window for each type of entity) but it makes orientation in the GUI easier.
5.4.13.2 OWL coverage
The indented list (or lists, to be exact) in Protégé serves as a way to select an entity that is to be edited, or whose subentity is to be created. Only the hierarchy is displayed in the list, all other relationships and property values are displayed in a text form in a separate window after an entity is selected.
5.4.13.3 Suitability
The Entity Browser is weak in sharing and strong in the remaining use-case categories.
5.4.14 SOVA
SOVAFootnote 18 is a visualization plugin for Protégé 4.
5.4.14.1 Visualization method
SOVA displays ontologies in a 2D node-link using spring and radial tree layout (the user can switch between them). It shows every OWL construct as a separate node. For example, properties are not represented by a single edge, but by a node and two edges representing their domain and range. Nodes representing different types of entities or relations have different color and shape. Mathematical symbols analogous to OWL universal and existential restrictions, unions, etc. are used for nodes representing those. Edges have also different style according to their role—a different style is used for edges connecting properties to their domain and range classes, for edges representing is-a relationships and for other edges. An alternative view is provided showing only class hierarchy in a horizontal tree layout.
5.4.14.2 UI features
Zooming changes the size of nodes and labels as well as the edges—so not only the edges as, for example, in KC-Viz, which is good for getting general overview of the ontology. General filtering by type of entity is possible, but specific selected nodes cannot be hidden.
5.4.14.3 OWL coverage
SOVA displays all OWL constructs except data properties. In contrast with most of the other tools in this survey, every OWL displayed OWL construct has a different graphic element, that is, it is not only distinguished by label but also by color or shape.
5.4.14.4 Suitability
SOVA is weak in editing and learning and strong in inspection and sharing.
5.4.15 TGViz
TGViz (Alani, Reference Alani2003) is a visualization plugin for Protégé version 3.x. Technically, it is written in Java with the help of the Touchgraph library. Since the software is no longer supported, it is no surprise it does not work very well on newest systems. We were able to run it on Win10, but it shows only two classes and then freezes with a long list of errors.
5.4.15.1 Visualization method
TGViz is based on a node-link visualization method with force-directed layout. Nodes are represented only by labels, no shapes or colors are used.
5.4.15.2 UI features
Incremental exploration is implemented: every node can be retracted or expanded. Every such operation leads to resetting the layout of all nodes. Before the visualization is loaded, the user has to select classes and instances to be shown. TGViz is one of very few tools that implement Fisheye Distortion, although it is quite hard to find and use in the UI controls.
5.4.15.3 Suitability
TGViz is very strong in inspection and strong in the remaining categories.
5.4.16 TopBraid Composer
TopBraid ComposerFootnote 19 is an ontology editor similar to Protégé or Neon Toolkit, but unlike those, it is not an open source but a commercial product.
5.4.16.1 Visualization method
Ontologies can be displayed in the TopBraid Composer using a UML-inspired graph visualization method with horizontal or vertical tree layout, backed-up by a classic indented list view. Classes and properties are depicted by nodes connected with oriented edges labeled with the predicate name they represent. There is also a possibility of displaying class data and annotation properties with their values inside the class node.
5.4.16.2 UI features
The tool does not allow to display the whole ontology at once. Classes are displayed only after they are drag&dropped from the indented list view. Their nodes can then be expanded to show relations to other classes and/or to show properties connected to them through domain/range. The expansion cannot be undone—nodes cannot be retracted. Zooming is possible only using GUI buttons.
5.4.16.3 OWL coverage
The TopBraid Composer graph visualization shows all types of entities as nodes and predicates as edges connecting them. Datatype property values can be displayed inside the node of the class they are describing. Restriction and complex anonymous classes are depicted with analogous mathematical symbols. The visualization is done rather at the RDF level, similarly to Graffoo or NavigOWL, so even owl:Class is shown as a separate node and every class is connected to it through an rdf:type edge.
5.4.16.4 Suitability
TopBraid is strong in sharing and weak in the remaining categories.
5.4.17 WebVOWL
WebVOWL (Lohmann et al., Reference Lohmann, Link, Marbach and Negru2015) is a Web application for the user-oriented visualization of ontologies. It implements the Visual Notation for OWL Ontologies (VOWL) by providing graphical depictions for elements of OWL that are combined to a force-directed graph layout representing the ontology (Lohmann et al., Reference Lohmann, Negru, Haag and Ertl2016). Interaction techniques allow to explore the ontology and to customize the visualization. The VOWL visualizations are automatically generated from JSON files into which the ontologies need to be converted. A Java-based OWL2VOWL converter is provided along with WebVOWL.
5.4.17.1 Visualization method
WebVOWL renders the graphical elements according to the VOWL specification. The force-directed graph layout uses a physics simulation where the forces are iteratively applied, resulting in an animation that dynamically positions the nodes of the graph. The energy of the forces cools down in each iteration and the layout animation stops automatically after some time to provide a stable graph visualization.
5.4.17.2 UI features
WebVOWL provides a number of interactive features that allow to explore the ontologies and customize their visualizations. These comprise basic interaction techniques like drag&drop, pan, and zoom as well as filters and features to adapt the VOWL graph visualization and its layout. An accordion UI widget helps to save screen space in the sidebar.
5.4.17.3 OWL coverage
The latest version of WebVOWL (version 1.0) supports nearly all language constructs of OWL 1 and most of OWL 2.
5.4.17.4 Suitability
WebVOWL is strong in learning and sharing but weak in editing and other use-case categories.
5.5 Legacy and proof-of-concept tools
This subsection describes 20 tools that we found information about in the form of papers or websites, but were unable to download or run them—the descriptions are therefore limited to what we were able to find out from the textual sources and screenshots.
5.5.1 CmapTools Ontology Editor (COE)
COE (Hayes et al., Reference Hayes, Eskridge, Saavedra, Reichherzer, Mehrotra and Bobrovnikoff2005) is a standalone ontology editor based on concept maps. It is available to download for free, but we were unable to run it. It is being developed at the Florida Institute for Human and Machine Cognition. As it is now part of the larger CmapTools application, it is at least actively maintained, if not developed. Concept maps (Novak & Gowin, Reference Novak and Gowin1984) are a general way of visualizing any knowledge as a graph where nodes are concepts and labeled links between them are relations. According to this definition, ontology visualized as graph could be considered to be a concept map. The difference is that a concept map is an informal visualization of knowledge created by hand whereas ontology visualization is based on its formal representation in some formal language.
5.5.1.1 Visualization method
CmapTools is a simplified variant of node-link visualization method where not every construct of OWL has its direct graphical representation. Instead, some typical sets or chunks of OWL constructs are rendered as one graphical element. For example, property restriction described in OWL with three triples is rendered as one labeled link. This way the total number of nodes and links can be somewhat smaller thus alleviating the problem of clutter (edge crossings and node or label overlap). Another simplification is in the labels, where more intuitive descriptions closer to natural language are used—for example, hierarchical links are not labeled rdfs:subClassOf which is the property name in OWL/RDF, but just as ‘are’.
5.5.2 ezOWL
ezOWL (Chung et al., Reference Chung, Oh, Kim, Cho and Cho2005) is the tool that emerged together with the first versos of Protégé. It was quite influential judging by the amount of its mentions back in the year 2000. It is a plug-in for Protégé that allowed to visually edit the ontologies. 15 years ago people claimed that they were able to construct ontologies in ezOWL only without using the typical Protégé forms. It is hard to reconstruct much about the tool since it could not be downloaded and the short paper about it offers little information. It is a UML-inspired graphical ontology editor, quite similar to today’s OWLGrEd, showing classes as rectangular nodes with related properties, restrictions and individuals listed inside and inter-class relationships shown as edges between the nodes. It offered a sort-of semantic zoom capability, allowing the user to switch between class hierarchy-only and full-detail views. We would certainly like to see this tool survive and advance to the present moment because our opinion is that the community could benefit from having such plug-in in the latest Protégé.
5.5.3 FlexViz
FlexViz (Falconer et al., Reference Falconer, Callendar and Storey2009) is a visualization tool that was integrated in BioPortalFootnote 20 . Its source code is still available, however, it is in ActionScript and we were unable to compile it. BioPortal seems to be using a different visualization currently.
5.5.4 GLOW
GLOW (Hop et al., Reference Hop, de Ridder, Frasincar and Hogenboom2012) is available as a Protégé 4 plugin. It seems that it has been developed rather as a proof of concept, introducing novel algorithm to alleviate edge crossings. However, it is not stable enough to be used by end users and we were not able to run it on our configuration.
5.5.4.1 Visualization method
GLOW offers force-directed, tree layout and inverted radial tree node-link visualizations. It differs from other similar tools mainly by implementing Hierarchical Edge Bundles technique (Holten, Reference Holten2006). In brief, the technique leads to grouping edges with similar path into bundles, thus limiting the number of edge crossings and making the visualization more clear. In GLOW, the edges also change color gradually on their way between start to end—this change of color indicates their direction, so no arrows or similar representation of direction is needed.
5.5.4.2 OWL coverage
GLOW is focused mainly on showing class hierarchy and object properties. It visualizes classes and individuals as nodes and hierarchical and domain/range property relationships as edges. Other relationship or entity types are not supported by the visualization.
5.5.5 GrOWL
GrOWL (Krivov et al., Reference Krivov, Williams and Villa2007) is a standalone visual ontology authoring tool created in Java. There is a download link in the paper describing it, which is not working anymore. A site dedicated to GrOWL can be foundFootnote 21 , with a downloadable working version of an app that looks similar to the one described in the paper, however, it is less feature-rich and does not include, for example, automatic layout and basically cannot be used for visualization of an existing ontology. We therefore described the tool according to the paper.
5.5.5.1 Visualization methods
Common 2D node-link with force-directed layout is used. In addition to most other tools, GrOWL differs types of nodes also by color and shape. The overall visualization is very similar to SOVA.
5.5.6 Knoocks
Knoocks (Kriglstein & Wallner, Reference Kriglstein and Wallner2010) is a standalone ontology visualizer that uses Microsoft .NET. Although its visualization method seems very interesting, we were unable to run it on our configuration.
5.5.6.1 Visualization methods
Knoocks uses a combination of visualization methods based on node-link and treemap. Each direct subclass of owl:Thing with its subtree of subclasses is displayed as a Knowledge Block—a block of rectangles where each rectangle represent a class and classes on the right side are subclasses of the class to their left. The result is a sort of a treemap method visualization. These Knowledge Blocks are then displayed as nodes of a 2D graph. All Knowledge Blocks are laid out to form one big circle. Curved lines between them represent properties with origin and end according to their domain and range. The domain and range is not followed just as it is specified in the ontology, but reasoning is used and the connection is displayed between all classes that are subclasses of classes specified as domain and range and are at the bottom of the hierarchy. Property links are displayed without labels by default. The label is displayed only after the user hovers over the link with the mouse pointer. The displayed label then contains not only the name of the property but also the names of the classes involved and also a list of instances that are subjects or objects in relationships where the property is the predicate.
5.5.6.2 UI features
The whole Knowledge Block can be displayed in a separate detailed view. In this details-on-demand view, instances are displayed inside the class rectangles and object properties associated with each class can be displayed in a pop-up window.
5.5.7 Multi-view ontology visualization
The tool described by Dmitrieva and Verbeek (Reference Dmitrieva and Verbeek2009) offers several visualization methods based on hyperbolic geometry and three dimensions. It is, however, not available for download, the download page returns an error.
5.5.7.1 Visualization methods
The tool offers 2D node-link visualization with several different layouts and a 3D euler diagram visualization, where the euler diagram-based visualization is displayed on a surface of a sphere. 2D layouts are based on hyperbolic geometry, achieving the fisheye view effect, and on laying out the nodes on a surface of a sphere.
5.5.7.2 UI features
Apart from the already mentioned fisheye view, the most interesting feature of this tool is semantic zoom. It is, however, implemented in a very simple way. In the euler diagram visualization, when the user zooms in, another level of subclasses is viewed. When zooming out, they are hidden again.
5.5.8 Onto3DViz
Onto3DViz(Guo & Chan, Reference Guo and Chan2010) is a Java application requiring Java 3D to be present in the system to run. It is purely a visualization tool that accepts ontologies represented in the form of XML-based document and generates a 3D interactive view.
5.5.8.1 Visualization method
Onto3DViz utilizes the extra dimension for representing complex ontologies in hierarchical tree layout. The shapes of nodes (spheres, cylinders, rectangles, cones) correspond to types of objects, for example, classes, instances, etc.
5.5.8.2 UI features
The tool allows panning, zooming and rotating of the 3D view, but it lacks such basic things as node search and node filtering that are crucial in supporting the process of learning and inspecting the ontologies. The 3D graph does allow to focus on a certain node and to visualize a part of the ontology. This inability leads to eventual cluttering of the graph with labels overlapping each other and hardly readable.
5.5.8.3 OWL coverage
It is obvious that the tool was designed as a proof-of-concept and is tailored for visualization of software project management ontology. It appears not to support any of the complex OWL constructs.
5.5.9 OntoRama
OntoRama (Eklund et al., Reference Eklund, Roberts and Green2002) is a Java client for visualization of ontologies stored in WebKB-2 server. Although it uses quite advanced techniques, it does not seem to be available or maintained anymore.
5.5.9.1 Visualization methods
OntoRama uses 2D node-link visualization with radial layout and stands out with its implementation of fish-eye view (or hyperbolic tree).
5.5.9.2 UI features
An interesting feature of OntoRama is its high configurability. The user can set up how each type of relation is displayed (color and icon) in an XML file.
5.5.10 OntoSphere
OntoSphere (Bosca et al., Reference Bosca, Bonino and Pellegrino2005) is a stand-alone application available also as a Protégé 3 and Eclipse plugin. It offers several implementations of 3D node-link visualization method. There are three types of views in the application and the user can navigate between them in an operation analogical to zooming. The first one, called RootFocus Scene, shows only the direct subclasses of the selected class (the class that is ‘focused’) as spherical nodes placed on a surface of one big sphere. The size of the node represents the number of subclasses of each class—that is, the number of classes ‘hidden’ under the node. Relations between the displayed classes are shown as links going through the main big sphere. Any of the displayed classes can be selected as focused class of a more detailed view called TreeFocus Scene. This view shows the sub-tree of the selected class—classes that are direct or indirect subclasses are displayed in a 3D tree layout with the selected class as the root. Only three levels of the tree are displayed at one time, but the user can move up or down in the hierarchy in an incremental exploration style of navigation—expanding a low level class node hides the top level class node and vice versa. Both hierarchical and other types of relations are displayed in this view, distinguished by a different color. ConceptFocus Scene is the most detailed view, where the selected class is displayed in the center with all entities that are in a direct or inherited relation with the selected class surrounding it.
5.5.11 OntoSELF
OntoSELF is a standalone application that was created as a PhD thesis (Somasundaram, Reference Somasundaram2007) but is not freely available.
5.5.11.1 Visualization method
It uses a 3D graph visualization method. It visualizes only the class hierarchy—spherical nodes with labels represent classes and links between them represent is-a or subclassof relationships. Nodes are laid out using a 3D cone layout algorithm. First, a spanning tree of the ontology hierarchy graph is found. The nodes are then simply laid out in levels: each class is placed one level below its lowest parent class. Sibling classes are placed next to each other forming a circle on a 2D plane. Finally, links that were filtered out when forming the spanning tree are added back, so that multiple subClassOf relationships of one class can be displayed. The result resembles a 3D cone. The user can then rotate the visualized graph freely.
5.5.12 OntoTrack
OntoTrack (Liebig & Noppens, Reference Liebig and Noppens2005) is a standalone desktop ontology authoring tool. Although its website is still up, the mechanism for registration and download seems to be broken.
5.5.12.1 Visualization methods
OntoTrack uses 2D node-link with hierarchical tree layout.
5.5.12.2 UI features
The most interesting feature of OntoTrack is that it allows the user to edit the ontology using its visualization, that is, through clicking on the nodes and links and editing them.
5.5.12.3 OWL coverage
According to its description, OntoTrack supports OWL constructs from OWL-Lite. Although it displays object and data properties, those are displayed separately from the class view, similarly as, for example, in the Protégé Entity Browser.
5.5.13 OntoTrix
OntoTrix (Bach et al., Reference Bach, Pietriga, Liccardi and Legostaev2011) is a standalone Java application designed to display highly populated ontologies—including instances. It is not publicly available.
5.5.13.1 Visualization methods
The tool combines 2D node-link visualization with adjacency matrices. Class instances are grouped together according to various criteria and the relationships between them are shown in a matrix.
5.5.13.2 UI features
An interesting feature of OntoTrix, apart from the adjacency matrices, is using a kind of edge bundling for edges connecting different matrices.
5.5.13.3 OWL completenes
Although classes are visualized, the visualization is focused mainly on instances.
5.5.14 Ontoviewer
Ontoviewer is a standalone application offering a unique combination of visualization methods: 2D force-directed node-link with fish-eye distortion, 2.5D graph and indented list. Unfortunately, it is only described in several articles, most recent of which is da Silva et al. (Reference da Silva, Freitas and Santucci2012), and is not freely available.
5.5.14.1 Visualization methods
The 2D graph with fish-eye distortion displays only classes and hierarchical relationships and serves as supportive view, as well as the indented list view. The main feature of the application is the one using 2.5D graph visualization method. It shows classes and their hierarchical relations placed on a 2D plane using the radial tree layout algorithm, while other relations are displayed as curved lines going above the plane. The resulting 3D graph can be rotated, moved and zoomed.
5.5.15 OntoViz
OntoVizFootnote 22 is a plugin for Protégé 3.
5.5.15.1 Visualization method
It uses a UML-inspired visualization method. It is not a strict ‘OWL to UML mapping’ visualization, but the approach is very similar. Rectangular nodes representing classes contain properties related to the class through domain relationships in a textual form. Such property relations may be also displayed redundantly as links. Different links represent hierarchical is-a relationships and instance-of relationships between classes and instances.
5.5.15.2 UI features
OntoViz does not visualize the whole ontology by default, but the user has to choose which classes and entities are to be displayed. For this selection, the Protégé indented list windows are used. The user selects not only the classes/individuals, but also types of relationships to be displayed. After the selection is confirmed, the graph is laid out automatically. Afterwards, the graph cannot be edited in any way, only pan and zoom is implemented. Search is not implemented, but selection of a class in the indented list view (which is a part of the tool) brings the focus of the graph view to the selected class.
5.5.16 OWLeasyViz
This standalone tool described in Catenazzi et al. (Reference Catenazzi, Sommaruga and Mazza2009) uses quite an original combination of visualization methods, however, it is not available for download.
5.5.16.1 Visualization method
A combination of euler diagrams and 2D node-link visualization is used. Shapes representing classes can be placed into other shapes to show subClassOf relationships and linked to other shapes to show properties (with their domain and range) or other relations.
5.5.17 OWLPropViz
OWLPropVizFootnote 23 is another plugin for Protégé with the main purpose of enabling to visualize properties. The tool was last updated in 2008 and thus it perfectly qualifies to be in legacy section. It seems to be the only plug-in that supports displaying labels for such properties as ‘disjoint-with’ and ‘equivalent-to’. OWLPropViz requires GraphViz and OWLViz to be present in the system.
5.5.18 OWL-VisMod
OWL-VisMod (García-Peñalvo et al., Reference García-Peñalvo, Colomo-Palacios, García and Therón2012) is a standalone visual ontology editor offering two visualization options. One is class-focused and the other one is focused on properties.
5.5.18.1 Visualization methods
The class-focused view is based on treemap visualization method where rectangles of superclasses contain smaller rectangles of their subclasses. This view shows only classes and their hierarchy. It can be zoomed in or out by setting the minimum and maximum level of the hierarchy. The class rectangles can be drag&dropped. A detailed view of a selected class can be viewed, showing all properties that have this class as a domain in a circle around the class. The second type of view displays properties and their domain and range using node-link method with circle layout. Hierarchical Edge Bundles technique is used in the same way as in GLOW—lines are curved and grouped together and gradually changing color of the lines indicate their direction. Datatype property lines start as blue and end as yellow while object property lines start as red and end as orange. Labels of links are displayed only after they are hovered over with the mouse pointer. Datatype properties are displayed as well, so the nodes in the circle may include datatype classes like boolean or string. Separate lists of all classes and properties are displayed around the circle. A detailed view of a property or a class can be displayed if it is selected. The detail of a class contains all properties that have this class as a domain or a range displayed around it together with all the other classes participating in these domain/range relationships. If a property is selected, its domain and range is displayed.
5.5.18.2 UI features
OWL-VisMod can serve as ontology editor in a similar way as Protégé. The editing actions are not visual, the user is provided with common textual dialogs. OWL-VisMod supports general filtering (e.g. hide classes that are domain for less than three properties) but the user cannot filter out a specific class or property. Details-on-demand view is available in the treemap view, showing properties and some other class relationships—disjointness and equality. Properties are displayed in a circle around the class, partially transparent and a little bit hard to read.
5.5.18.3 OWL coverage
Although OWL-VisMod is a standalone ontology editor and allows creating some complex classes—enumerations, unions and intersections—it does not visualize them. They are displayed as regular classes and the union or intersection relationship stays hidden. Enumeration is revealed when the user selects the class—the instances included in the enumeration are displayed in a details-on-demand tooltip style view. Equality and disjointness is displayed also in this view. Subclassof relationships are represented by class rectangle location in the treemap view. The property-centric view (called Coupling Panel) shows datatype and object properties but no other relationships. Classes that have no properties remain hidden in this view.
5.5.19 Triple20
Triple20 claims to be an RDF/RDFS/OWL visualization and editing tool, but it is hard to contradict such statement since all the links provided for download at its Web page are broken. At the same time, the tool gained some recognition in the past because it is listed as one of the OWL Authoring tools on the official wiki page of W3C. From the published papers Wielemaker et al. (Reference Wielemaker, Schreiber and Wielinga2005) and screenshots we dared to reconstruct its functionality and provide the tool overview from relatively scarce sources. What distinguishes Triple20 from most of the tools is that it is built on Prolog, namely with SWI-Prolog, which is a comprehensive free Prolog environment supplemented with special semantic Web library. Triple20 offers basic expandable graph visualization as means for ontology exploration, but it also carries fully implemented ontology authoring features. The other advantage of this particular tool is that it can boast fast user experience even with large data sets, thanks to its architecture allowing all data to be placed in RAM. From our perspective at its time it was a very promising attempt to build the alternative for traditional Protégé with the intent to supply the data exploration and visualization in a single offering. We regret seeing it perish because of the technology choice miscalculations and would definitely prefer to witness its revival based on the modern technologies.
5.5.19.1 Visualization methods
There are three ways to visualize the data in Triple20: indented list view of class hierarchy that is accompanied by tabular view for properties and a node-link representation of concepts and connections between them. Judging from the screenshots the graph can be expanded further by opening the node’s connections.
5.5.19.2 UI features
Triple20 as stated by its creators is not focused on various advanced UI features, it provides only the essentials needed for knowledge engineer to succeed with construction of data model. Therefore the tool prompts the user to work in a set of typical dialogue boxes and modal windows, which is quite similar to Protégé approach although the binding between the UI elements for editing data and for visualization of data is in our vision better implemented. The developers of Triple20 stripped the screen space from rarely used controls and employed pop-up menus as well as drag-n-drop actions to be the main drivers of user experience.
5.5.19.3 OWL coverage
The tool is lacking the expressiveness of Protégé as it could be deducted from a number of publications on the tool but it is almost impossible from the existing screenshots to derive what the limitations are exactly. There’s some ground to confirm that the tool can display complex classes, but we would restrain ourselves from making any strong judgments about the full coverage of class relations.
5.5.20 Visual Ontology Modeler (VOM)
VOMFootnote 24 (Ceccaroni & Kendall, Reference Ceccaroni and Kendall2003) is a commercial modeling environment once based on IBM Rational Rose product and the latest version is delivered as a plug-in for MagicDraw general purpose modeling suite. We could not obtain a copy of VOM for testing and reviewing and therefore we were forced to reconstruct the features of the software from marketing materials and publications. Since the full-size review is not possible we placed this tool together with legacy solutions.
VOM is heavily influenced by UML notation, that is, in its visualizations it expresses ontologies to the user in UML language. It supports drag-and-drop behaviors across the entire modeling process and is capable of visual editing. Thanks to having a well-established MagicDraw suite as a foundation the user experience in VOM seems to be smooth, enjoyable and effective.
6 Related research: evaluations of ontology visualizations
To the best of our knowledge, no comprehensive survey of ontology visualization approaches including more methods and tools than ours has been published so far. Apart from the aforementioned survey of Katifori et al. (Reference Katifori, Halatsis, Lepouras, Vassilakis and Giannopoulou2007), Lanzenberger et al. (Reference Lanzenberger, Sampson and Rester2009) conducted a literature study in which they found and briefly described 27 ontology visualization tools. They distinguish between graph-based visualization tools, visualizations for mappings and alignments, and ontology tools applying unconventional visualization techniques, but go little beyond an annotated bibliography with their paper. However, there are several papers presenting comparative evaluations of two to four visualization methods or tools. In the following, we briefly summarize these works and generalize the results.
Katifori et al. (Reference Katifori, Torou, Halatsis, Lepouras and Vassilakis2006) conducted a comparative user study of four visualization tools. Users were asked to perform specific information retrieval tasks with each tool, such as finding a value of some property. The tasks seem to be more easily achievable with non-visual tools such as SPARQL queries. This raises the question about the typical tasks that are performed using an ontology visualization. We proposed some categorization of ontology visualization use cases in our previous paper (Dudáš et al., Reference Dudáš, Zamazal and Svátek2014), but those are too general to be used directly as evaluation tasks. Time to accomplish each task was measured and the users were interviewed afterwards. Based on the answers, the effectiveness of each tool was measured. According to that, Protégé Entity Browser is the most effective, then Jambalaya, TGViz and OntoViz is the least effective. Reasons why OntoViz failed as explained by the users are its cumbersome interface, the lack of interactivity and the missing search feature. Notice that these are all disadvantages of the implementation, not of the visualization method, and could be fixed by investing more time in the development of the tool. Jambalaya and OntoViz were both criticized by the users for overlapping labels and crossing links. That is indeed a general disadvantage of most visualizations. One of the core problems of ontology visualization is how to show large ontologies without overwhelming the user and/or cluttering the view with too many graphical objects.
Fu et al. (Reference Fu, Noy and Storey2013) tried to focus their usability study more on the visualization methods instead of the quality of their implementation. They compared indented lists with node-link visualizations. The users were asked to evaluate and create new mappings between ontologies using the visualizations. The conclusion is that indented lists are more suitable for the evaluation of the mappings, whereas node-link visualizations are better for creating new mappings and also more suitable for displaying an overview of the ontology. Similarly to the previous evaluation, problems with displaying large ontologies in node-link visualizations are mentioned. The authors recommend tool developers to combine multiple visualization methods complementary to each other.
There are two papers describing a new visualization tool including an evaluation of the tool in comparison with two others. Motta et al. (Reference Motta, Mulholland, Peroni, dAquin, Gomez-Perez, Mendez and Zablith2011) present KC-Viz together with a comparative usability study. Time to perform selected tasks in KC-Viz, OWLViz and the Neon Toolkit Ontology Visualizer is measured. The tasks are probably more suited for using the visualization than in (Katifori et al., Reference Katifori, Torou, Halatsis, Lepouras and Vassilakis2006): They are focused at finding classes with hierarchical relationships to other classes. Users perform the tasks most efficiently using KC-Viz, thanks to its key-concept selection feature, which is the main difference to the other two tools. Lohmann et al. (Reference Lohmann, Negru, Haag and Ertl2016) developed the visual ontology notation VOWL and implemented it in the tool WebVOWL. WebVOWL was compared to SOVA and GrOWL in a usability study showing that WebVOWL outperforms the two tools in basically all measured aspects. The evaluation was aimed at comparison of the visualization methods rather than the quality of implementation but still suffered some bias caused by implementation-specific differences. Users were asked to perform specific tasks and then to rate each tool by criteria of clarity, learnability, ease of finding elements, mappings between visual and conceptual elements, use of colors and use of shapes. For example, the ease of finding elements depended strongly on the fact whether the specific tool supported search or not.
As all of the reported works evaluated different groups of tools, not much can be generalized from them. Katifori et al. (Reference Katifori, Torou, Halatsis, Lepouras and Vassilakis2006) and Fu et al. (Reference Fu, Noy and Storey2013) agree on indented lists being more effective than node-link diagrams for most tasks. Effectiveness is rated by users in the former case and measured by success rate of users performing tasks with the tools in the latter. Both also agree on the fact that displaying large ontologies is problematic in all mentioned tools. The only tool offering some solution to this known to us is KC-Viz. A sort of follow-up of (Fu et al., Reference Fu, Noy and Storey2013) is (Fu et al., Reference Fu, Noy and Storey2017) which also compares node-link and indented list visualizations, this time using eye-tracking. The results show that both methods have pros and cons and their effectiveness depends on other factors, like the size of the available screen space. In usability evaluations, tools are often rated better by the users thanks to some common feature support. For instance, tools supporting search are better than those without a search function. Not much research would probably be needed to prove that the more features (implemented in a user friendly way) a visualization tool offers, the better would be its score in comparative evaluations with tools using the same visualization method. Much more valuable would be a comparative evaluation of reference implementations of different visualization methods but with identical feature support. We are not aware of any such effort.
7 Conclusion
We proposed an updated classification of ontology visualization methods and accompanied it with a list of definitions of interaction techniques that are implemented in various ontology visualization tools. We surveyed existing tools with respect to this classification, interaction techniques, and their OWL coverage. Despite the large number of methods, most of the tools use a node-link visualization with a force-directed layout, although there is no proof that it is significantly better than other methods. Some tools offer more than one visualization method, which seems to be the right direction, as it has been shown that different tasks and use cases demand different visualization methods (Katifori et al., Reference Katifori, Halatsis, Lepouras, Vassilakis and Giannopoulou2007; Dudáš et al., Reference Dudáš, Zamazal and Svátek2014). None of them, however, implement a mechanism to seamlessly switch between the visualization, for instance, by using multiple coordinated views with brushing and linking (Roberts, Reference Roberts2007).
Similarly, we can see that there is a vast number of visual and interaction techniques that have been proven useful but are rarely implemented. Many tools focus on just one advanced feature and omit some more basic ones. The result usually is an experimental tool proving good usability of the advanced feature but limited support for common ontology visualization tasks. Regarding that, a possible direction of future research could be a universal ontology visualization framework that implements basic visual and interactive features, including drag and drop, pan and zoom, searching, filtering, details-on-demand, coordinated views and brushing and linking. Different visualization methods could then be implemented and added as plugins or extensions. This way, anyone could experiment with new methods and techniques, while the framework would provide the basic core functionality ensuring that the results of the experiments would actually be usable.
In addition, we identified two main problems demanding future research: (1) overview-to-detail visualizations of large ontologies, and (2) adapting the visualization methods and UIs of the tools with respect to specific use cases. The only tool with ambition to solve the former is KC-Viz. However, although it has features attempting to make the visualization of large ontologies more clear, it is not robust enough to technically deal with a large ontology and crashed in our tests. The latter problem has not been tackled at all. Although it might seem quite intuitive and have been preliminary confirmed that different use cases require different visualization methods and features, it appears that only few researchers and developers have specific use cases in mind when they design a new visualization method or tool. The design of usability tests confirms that. They often consist of general information retrieval tasks rather than tasks an ontology developer would need to perform.
The last contribution of this paper is a brief summary of general literature recommendations regarding information visualization relevant to ontologies. Again, we can see that there are several techniques that are rarely followed or have not been tried at all yet.
Acknowledgment
This research was supported by UEP IGA F4/90/2015, UEP IGA F4/28/2016 and by long-term institutional support of research activities by the Faculty of Informatics and Statistics, University of Economics, Prague.