I. INTRODUCTION
In the past few decades, nanostructured materials have become a focus of scientific research, and considerable interests have been paid in the synthesis of semiconductor materials because of their specific electronic and optoelectronic properties. The nanostructured semiconductors usually show improved physical and chemical properties for their widespread potential applications, such as solar energy conversion devices and solar cells,Reference Kamat1, Reference Huynh, Dittmer and Alivisatos2 light-emitting diodes,Reference Colovin, Schlamp and Alivisatos3, Reference Coe, Woo, Bawendi and Bulovic4 electronic and optoelectronic devices,Reference Duan, Huang, Agarwal and Lieber5 and so on. As one of the most important applications, heterogeneous photocatalysis of semiconductors has been widely used for the removal of toxic organic and inorganic contaminates from water.Reference Peng, Zhao, Dai, Shi and Hirao6 However, although some metal oxide semiconductors, such as TiO2 and ZnO, can be used as photocatalysts, they have an inborn demerit of an ultraviolet (UV)-absorbing wide band gap and require chemical modification such as anionicReference Pore, Ritala, Leskela, Areva, Jarn and Jarnstrom7 or cationicReference Kubacka, Colon and Fernandez-Garcia8 doping to make use of visible light. To overcome these UV-absorbing shortcomings, some metal chalcogenides with narrow band gaps have been developed to efficiently overcome the shortcomings of those wide-band-gap metal oxide materials. Among them, CdS, as one of the most vital and classical II–VI group semiconductors, has been extensively explored because its optimum band gap (2.3 eV) corresponds well with the spectrum of visible light as well as other thermodynamic and electrochemical properties suitable for photocatalysis.Reference Jang, Joshi and Lee9–Reference Yao, Yu, Liu, Chen, Liu and Li11 In addition, it is also widely used for photoelectronic conversion in solar cells, in light-emitting diodes for flat-panel displays, and in other optical devices based on its nonlinear properties.Reference Duan, Huang, Agarwal and Lieber5, Reference Peng, Schlamp, Kadavanich and Alivisatos12
It has been widely accepted that size and morphology of nanomaterials are crucial for their applications. Great efforts have been devoted to achieve size and morphology controllable synthesis of semiconductor nanocrystals.Reference Empedocles, Neuhauser, Shimizu and Bawendi13 Over the past decade, a variety of methods have been reported to synthesize size and morphology controllable CdS nanostructures.Reference Jang, Joshi and Lee9–Reference Peng, Schlamp, Kadavanich and Alivisatos12, Reference Yu, Qu, Guo and Peng14–Reference Zhao and Huang18 For example, Peng and his coworkers synthesized CdS crystals by using trioctylphosphine oxide (TOPO) as both shape-controlling capping ligand and stabilizing ligand.Reference Yu, Qu, Guo and Peng14 Yu’s group prepared CdS nanoflowers, branched nanowires, and nanotrees via a solvothermal method.Reference Yao, Yu, Liu, Chen, Liu and Li11 Zaho et al.Reference Zhao and Huang18 prepared the netted spherelike CdS nanostructures in ethylenediamine by a solvothermal process, and so on. Although different morphological CdS nanocrystals have been prepared by using the aforementioned methods, few studies were reported on preparation of CdS nano- or microspheres.Reference Zhang, Jian, Zheng, Sun, Chen and Cui19 Moreover, it is still a challenge for materials scientists to develop straightforward and controllable methods to tailor materials. In such a case, the soft-template process has attracted a considerable amount of attention to synthesize various morphological CdS nanomaterials. Among a variety of soft templates, polyvinylpyrrolidone (PVP) is a kind of neutral charged polymeric dispersant exhibiting outstanding colloidal and complexing properties.Reference Du and Ilegbusi20 It has been widely performed as a template-directing reagent or stabilizer.Reference Wu, Wang, Xiao and Huang21–Reference Wang, Zhao and Han23 However, most of the studies used PVP as a soft template to synthesize semiconductor nanostructures at a high level of concentration,Reference Wu, Wang, Xiao and Huang21–Reference Wang, Zhao and Han23 few reports were conducted to synthesize morphology controllable materials using PVP as a surfactant reagent.Reference Li, Jiang, Peng and Zhang24
As described previously, chemical modifications such as anionicReference Pore, Ritala, Leskela, Areva, Jarn and Jarnstrom7 or cationicReference Kubacka, Colon and Fernandez-Garcia8 doping into semiconductor photocatalysts with wide band gap have been conducted to improve their visible light absorption ability. Although CdS with relative narrow band gap can efficiently absorb visible light, its photocatalytic activity might be improved by extending its visible light absorption. Considering that iodine-doped TiO2 can effectively improve its photocatalytic properties under visible light,Reference Su, Zhang, Li, Wu, Wang, Li and Fu25, Reference Liu, Sun, Yan, Cheng, Chen, Wang, Wang, Smith, Lu and Cheng26 the iodine doping may also narrow the band gap and increase the visible light absorption of CdS. To the best of our knowledge, there is no investigation on the synthesis and photocatalytic property of iodine-doped CdS (I-CdS).
Herein, we present a convenient hydrothermal route to synthesize different I-CdS microspheres by using polyvinylpyrrolidone-iodine (PVP-I) as a template-directing reagent and iodine source for the first time. We also systematically investigate the morphology and crystal phase, as well as the visible-light-driven photocatalytic activity of the I-CdS products synthesized under different conditions. Moreover, the possible formation mechanism of the I-CdS microspheres is also proposed.
II. EXPERIMENTAL SECTION
A. Synthesis of I-CdS
All reagents in the experiment were of commercially available analytical grade and used without further purification. Deionized water was used in all experiments. Different I-CdS microspheres were prepared via a mild hydrothermal treatment by using cadmium nitrate, thiourea as starting reagents, and PVP-I as the template reagents. In a typical synthesis, equivalent molar amounts (1 mmol) of Cd(NO3)2·4H2O, thiourea, and PVP-I were dissolved into 15 mL of deionized water, and then the mixture was stirred for 20 min to obtain a clear solution and transferred into a 22-mL Teflon-lined (DuPont, Wilmington, DE) stainless steel autoclave. The autoclave was allowed to be heated at 180 °C for 20 h under autogenously pressure, and then cooled to room temperature. The resulting brown precipitates were collected and washed thoroughly with deionized water and dried at 50 °C in air. To study the possible growth mechanism and evolution process, we also carried out a series of experiments of different molar ratios of PVP-I to Cd2+. The obtained CdS and I-CdS samples are denoted as sample-N (N means the molar ratio of PVP-I to Cd2+ under the same other conditions, varying from 0, 0.25, 0.5, 1 to 2). In addition, the influences of the hydrothermal reaction time on the morphologies of the final products were investigated.
B. Characterizations
X-ray powder diffraction (XRD) patterns were obtained on a Bruker D8 Advance x-ray diffractometer with Cu Kα radiation (Karlsruhe, Germany) to determine the crystalline phases of the obtained products. Scanning electron microscopy (SEM) images were performed on a LEO 1450VP scanning electron microscope (SEM; JEOL Ltd., Tokyo, Japan) to study the morphologies of products prepared under various experimental conditions. The UV-visible (UV-vis) diffuse reflectance spectra (UV-DRS) were obtained with a Cary 5000 UV-vis-near infrared (NIR) spectrophotometer (GMI, Inc., Ramsey, MN) equipped with an integrating sphere. A nitrogen-adsorption system (Micromeritics ASAP2010; Titan Technologies Inc., Japan) was used to record adsorption–desorption isotherms at the liquid–nitrogen temperature of 77 K. X-ray photoemission spectroscopy (XPS) was recorded on a Kratos ASIS-HS x-ray photoelectron spectroscope (Kratos Analytical Inc., Spring Valley, NY) equipped with a standard and monochromatic source (Al Kα) operated at 150 W (15 kV, 10 mA). In the XPS measurements, all binding energies were referenced to the C 1s peak at 284.8 eV of the surface adventitious carbon.
C. Photocatalytic activity measurement
The photocatalytic activities of the prepared samples were evaluated by the degradation of Rhodamine B (RhB) in an aqueous solution. A 500-W tungsten halogen lamp was positioned inside a cylindrical vessel and surrounded by a circulating water jacket to cool it. An amount of 0.05 g of photocatalyst was suspended in a 50-mL aqueous solution of 5-mg·L−1 RhB. The solution was continuously stirred for about 1 h in the dark to ensure the establishment of an adsorption–desorption equilibrium among the photocatalyst, RhB, and water before irradiation. The lamp was then turned on and the solution was irradiated under visible light (λ > 420 nm). The distance between the light source and the bottom of the solution is about 10 cm, and the RhB solution was stirred by a dynamoelectric stirrer at ambient pressure and temperature. The concentration of RhB was monitored by colorimetry with a U-3310 UV-vis spectrometer (Hitachi, Tokyo, Japan).
III. RESULTS AND DISCUSSION
A. XRD patterns
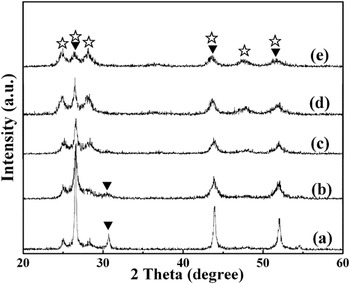
The crystallinity and phase purity of the obtained products were examined by powder XRD. Figure 1 shows the XRD patterns of the samples obtained with different molar ratios of PVP-I to Cd2+. As shown in Figs. 1(a) and 1(b), the sample-0 and sample-0.25 are the mixtures of hexagonal wurtzite and cubic sphalerite CdS. The distinctive reflection peaks at 2θ = 24.8° and 28.2° can be indexed to the (100) and (101) planes of hexagonal wurtzite CdS (JCPDS File No. 41-1049),Reference Xiong, Zhang, Huang, Ren, Liu, Li, Wang and Lin27, Reference Bao, Shen, Takata, Domen, Gupta, Yanagisawa and Crimes28 while the specific reflection peak at 2θ = 31.5° is ascribed to the (200) plane of cubic sphalerite CdS (JCPDS File No. 89-0440).Reference Cao, Wang and Zhang29 The decreasing intensity of the reflection peak at 2θ = 31.5° in Fig. 1(b) suggests the weakening crystallinity and the reducing amount of cubic CdS. Nevertheless, only hexagonal wurtzite CdS phase (JCPDS File No. 41-1049) was detected in the XRD patterns of sample-0.5, sample-1, and sample-2, indicating that more PVP-I in the reaction systems can inhibit the formation of cubic sphalerite CdS and/or promote the phase-transition from cubic to hexagonal CdS. In addition, with increasing the amount of PVP-I in the reaction systems, the intensity of XRD reflection peaks of the corresponding products also decreased significantly, indicating that the presence of PVP-I could inhibit the crystal growth of the products. Therefore, the crystal phase and crystallinity of the resulting CdS could be controlled by the amount of PVP-I added into the reaction system, and the critical phase transition point from cubic to hexagonal appears when the molar ratio of PVP-I to Cd2+ reaches 0.5. These phenomena might be attributed to the coordination between C=O groups in PVP-I and Cd2+.Reference Wu, Wang, Xiao and Huang21–Reference Li, Jiang, Peng and Zhang24, Reference Chu and Liu30 More PVP-I will offer more oxygen atoms to coordinate with Cd2+ to promote the formation of the eclipsed conformation to form the hexagonal wurtzite CdS structure, which is more stable thermodynamically. Similar phenomena were observed by Bao and his coworkers.Reference Bao, Shen, Takata, Domen, Gupta, Yanagisawa and Crimes28 They suggested that the Cd-thiourea-CH3COO− complex with a high thiourea/Cd ratio would facilitate the formation of hexagonal CdS structure.
XRD patterns of CdS samples: (a) sample-0, (b) sample-0.25, (c) sample-0.5, (d) sample-1, and (e) sample-2 (▼: cubic CdS; ⋆: hexagonal CdS).

B. SEM images
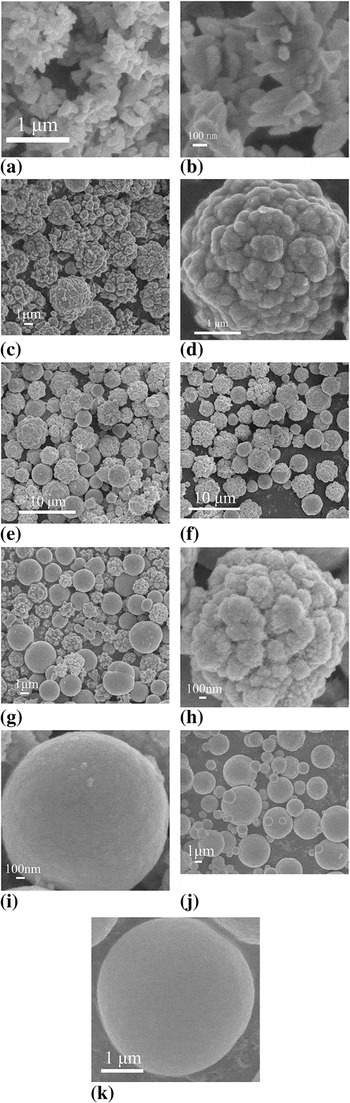
Figure 2 shows SEM images of the resulting samples. Figures 2(a) and 2(b) show the SEM images of sample-0 at low and high magnification, respectively. This sample, obtained in the absence of PVP-I, was composed of numerous irregular cone-shaped particles with a length of about several hundred nanometers. Some of those cone-shaped particles self-assembled into dendritic rods. Differently, uneven CdS microspheres self-assembled from small particles were observed in the sample synthesized in the presence of PVP-I with the molar ratio of PVP-I to Cd2+ at 0.25 [Figs. 2(c) and 2(d)]. Furthermore, with increasing the molar ratio of PVP-I to Cd2+ to 0.5, the morphologies of the resulting sample steadily changed from uneven microspheres to smooth microspheres with the diameter ranging from several hundred nanometers to about five micrometers [Figs. 2(e) and 2(f)]. When the molar ratio of PVP-I to Cd2+ further reached 1, more smooth CdS microspheres were obtained [Figs. 2(g)–2(i)], indicating that more PVP-I could facilitate the formation of smooth microspheres. The uneven microspheres were obviously formed through the agglomeration of numerous nanoparticles [Fig. 2(h)]. Most of the microspheres became smooth when the molar ratio was increased to 2, and the diameters of some final smooth microspheres decreased to several hundred nanometers in such reaction conditions [Figs. 2(j) and 2(k)].
SEM images of CdS samples: (a, b) sample-0, (c, d) sample-0.25, (e, f) sample-0.5, (g–i) sample-1, and (j, k) sample-2.

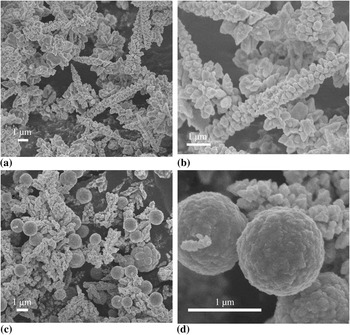
To further investigate the influence of PVP-I on the crystal phase and morphology of CdS, comparative experiments were carried out by using pure PVP or potassium iodide (KI) to replace PVP-I under the same other conditions. As revealed in Figs. 3(a) and 3(b), the CdS samples obtained in the presence of KI are mainly composed of many pyramid-like rods aggregated by numerous small irregular particles, which are similar to that of sample-0 [Figs. 2(a) and 2(b)]. Figures 3(c) and 3(d) show the SEM images of CdS samples obtained by using PVP instead of PVP-I. Both uneven microspheres and irregular short rods were observed, which are similar to the irregular cone-shaped structures in sample-0 and the microspheres in sample-1, respectively. No smooth microspheres were found in the two counterpart samples, reflecting that the presence of PVP-I in the hydrothermal system was crucial to mediate the formation of different shaped microspheres.
SEM images of CdS samples obtained by using (a, b) KI and (c, d) PVP to substitute PVP-I.

C. XPS spectra of the obtained CdS samples
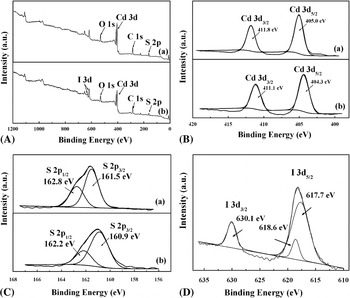
XPS measurements were performed to reveal the surface chemical compositions and the valence states of various species of the resulting samples. All the spectra were fitted with the XPSPEAK41 software package using Shirley-type background; the fitted curves are in good agreement with the experimental results (shown in Fig. 4). Figure 4(A) shows the XPS survey spectra of obtained samples. The elements of Cd, S, O, and adventitious C coexisted in sample-0 [Fig. 4(A-a)], while sample-0.5 contains Cd, S, O, I, and adventitious C elements [Fig. 4(A-b)], in which oxygen elements can be attributed to the adsorbed components (such as OH, H2O, and carbonate species) on the surface of the samples.Reference Wang, Ai and Zhang31 The “panel a” of Fig. 4(B) shows the high-resolution spectra of Cd 3d in sample-0. The binding energy peaks located at 411.8 and 405.0 eV are assigned to Cd 3d 3/2 and Cd 3d 5/2, respectively, which is in good agreement with previous reports.Reference Ryu, Balcerski, Lee and Hoffmann32 As shown in the “panel a” of Fig. 4(C), the broad peak of S 2p in sample-0 can be fitted by two peaks at binding energies of 162.8 and 161.5 eV, corresponding to the S 2p 1/2 and S 2p 3/2 states, respectively.Reference Kale, Baeg, Apte, Sonawane, Naik and Patil33 The Cd 3d 5/2 and S 2p 3/2 peak areas were used to determine the quantitative elemental analysis of Cd and S elements. The atomic ratio of Cd and S in sample-0 is close to 1:1, agreeing with the stoichiometric ratio of CdS. Similarly, the binding energies at 411.1 and 404.3 eV for Cd 3d in sample-0 can be attributed to Cd 3d 3/2 and Cd 3d 5/2 [part b of Fig. 4(B)], respectively, while the fitted two peaks at the binding energies of 162.2 and 160.9 eV for S 2p in sample-0.5 can be correspondingly assigned to S 2p 1/2 and S 2p 3/2 states [panel b of Fig. 4(C)]. Figure 4(D) shows the high-resolution XPS spectra of I 3d in sample-0.5, the peaks at the binding energies of 630.1 and 618.3 eV are characteristic bands of iodine in metal iodide, corresponding to I 3d 3/2 and I 3d 5/2 states in Cd-I bonds, respectively. This result indicated that the iodine element has been successfully doped into the CdS samples.Reference Grzelczak, Sánchez-Iglesias, Rodríguez-González, Alvarez-Puebla, Pérez-Juste and Liz-Marzán34 Meanwhile, the binding energies of species Cd 3d and S 2p slightly shifted to lower positions compared with those in sample-0. This shift could be attributed to the increasing covalent character of bonds because of the iodine doping effect, which was reported previously.Reference Grzelczak, Sánchez-Iglesias, Rodríguez-González, Alvarez-Puebla, Pérez-Juste and Liz-Marzán34
XPS spectra of CdS samples: (A) survey of the sample, (B) Cd 3d, (C) S 2p, (D) I 3d for (a) sample-0 and (b) sample-0.5.

D. Influence of hydrothermal reaction time on the morphologies of CdS
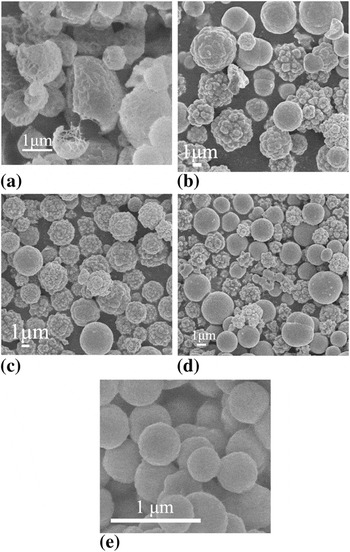
To further study the growth mechanism of uneven-surfaced and smooth-surfaced CdS microspheres, a series of experiments were carried out at 180 °C for 1, 5, 10, 20, and 48 h with the molar ratio of PVP-I to Cd2+ maintaining at 1. As shown in Fig. 5(a), quasispherical particles were obtained after 1 h hydrothermal treatment. The formation of these quasispherical CdS particles could be attributed to the preferential growth of CdS crystal with the chains of PVP acting as the structure-directing coordination template molecules.Reference Wu, Wang, Xiao and Huang21–Reference Wang, Zhao and Han23 With the hydrothermal time being prolonged to 5 h, quasispherical particles were transferred into uneven and smooth microspheres with a diameter range from 1.5 to 5.0 μm [Fig. 5(b)]. With further prolonging the hydrothermal time from 5 to 10 h, the surface of obtained microspheres gradually became smooth [Fig. 5(c)]. The surface of many more products became smooth when the hydrothermal reaction time was further extended to 20 h [Fig. 5(d)]. Furthermore, when the hydrothermal time reached 48 h, all the surfaces of CdS microspheres became smooth. This result indicates that hydrothermal reaction time played an important role in the formation of different types of microspheres.
SEM images of CdS samples obtained with the molar ratio of PVP-I to Cd2+ at 1 under different hydrothermal reaction time at 180 °C: (a) 1 h, (b) 5 h, (c) 10 h, (d) 20 h, (e) 48 h.

E. Formation mechanism analysis
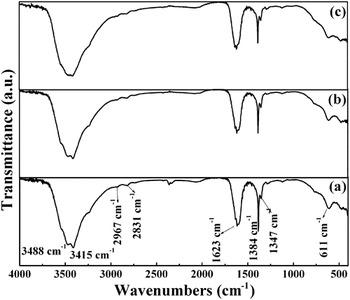
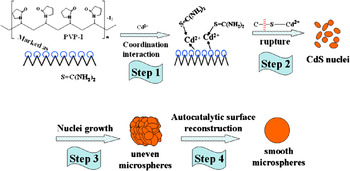
On the basis of the aforementioned characterization results, a possible formation mechanism of iodine-doped CdS microspheres is proposed in Scheme 1. First, sulfur atom in S=C(NH2)2 and oxygen atoms in PVP-I could coordinate with Cd2+ to form the initial cadmium-thiourea-PVP complex (step 1 in Scheme 1).Reference Wu, Wang, Xiao and Huang21, Reference Wang, Zhao and Han23 A typical Fourier transform infrared (FTIR) spectrum was then used to identify the functional groups in such initial precursor complex obtained at different hydrothermal times (Fig. 6). Figure 6(a) shows the FTIR spectrum of the as-prepared precursors with 1 h of hydrothermal treatment. Peaks at 3488 and 3415 cm−1 are ascribed to the stretching vibrations (asym. and sym.) of N–H bonds in thiourea or the vibration modes of O–H group in H2O absorbed on the surface of the product. In addition, peaks at 2967, 2831, 1384, and 1347 cm−1 are indexed to the stretching vibration (asym. and sym.) and bending vibration (asym. and sym.) modes of C–H bonds in PVP, respectively. Furthermore, the peak at 1625 cm−1 is assigned to the stretching vibration mode of C=O bonds in PVP.Reference Wu, Wang, Xiao and Huang21, Reference Wang, Zhao and Han23 Moreover, the sharp peak at 611 cm−1 is probably attributed to the vibration mode of an organic metal bond.Reference Zhao and Huang18, Reference Chu and Liu30Figs. 6(b) and 6(c) show the FTIR spectra of the precursors obtained after 5 and 10 h of hydrothermal treatment, respectively. The spectra of the two precursors are very similar, but the intensity of the vibrating peak at around 611 cm−1 decreases with prolonging hydrothermal time, indicating the rupture of organic metal bond as well as the increasing crystallinity of the as-prepared precursors. Next, upon being exposed to the high pressure and temperature in the hydrothermal process, the C=S bond would break and generate S2− anion gradually, resulting in the formation of CdS nuclei (step 2 in Scheme 1). Meanwhile, the C=O groups in the PVP-I chains could interact with these CdS nuclei and direct them to form quasispherical CdS particles [Fig. 5(a)]. In the following nuclei growth step (step 3 in Scheme 1), the continuous supply of newborn CdS building blocks would undergo a self-diffusion process and assemble onto the quasispherical CdS particles to form uneven microspheres.Reference Li, Li, Li and Chen35, Reference Xiang, Zhuang and Wang36 On the basis of Kossel’s interface growth theoryReference Kossel, Nachr and Wiss37 and Hartman’s K face growth mechanism,Reference Hartman and Perdok38 we speculate that the final smooth microspheres were formed through the autocatalytic surface reconstruction mechanism (step 4 in Scheme 1). That is, the uneven microspheres would undertake a type of surface reconstruction with further prolonging hydrothermal time, and CdS building blocks adsorbed on the surface of uneven microspheres would gradually incorporate into the microsphere body at active sites to eventually form the smooth microspheres. Comparing the SEM images of I-CdS samples obtained at different hydrothermal times (Fig. 5), it is found that the sizes decrease from several micrometers to several hundred nanometers when their morphologies transfer from uneven microspheres to smooth microspheres. This fact can be attributed to the incompactness and thermodynamic instability of uneven microspheres due to the high surface energy. Therefore, the surface-adsorbed CdS building blocks, which were not incorporated into active sites in the microsphere body, disassembled from the surfaces to form new microspheres, resulting in the formation of smooth microspheres and the decrease in sizes.
Infrared spectra of the as-prepared products of (a) 1 h, (b) 5 h, and (c) 10 h hydrothermal treatment under the same other conditions as the typical method.

Schematic formation mechanism of CdS microspheres with different morphologies.

F. UV-vis diffuse reflectance absorption spectra
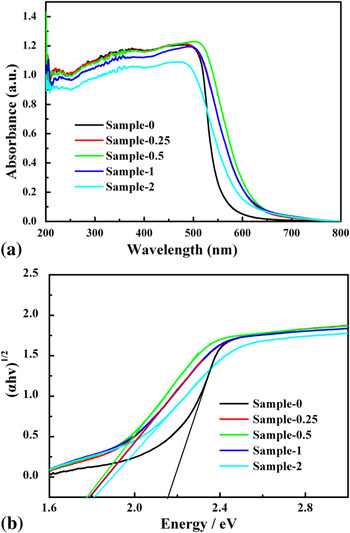
Figure 7 shows the UV-vis diffuse reflectance absorption spectra and the corresponding band gaps of different CdS samples. All the CdS samples showed excellent visible light absorption [Fig. 7(a)]. Products obtained in the presence of PVP-I showed higher intensity of absorbance, and their absorption edges exhibited red shift toward the visible light region, which could be attributed to the doping of iodine into CdS samples. These iodine-doped samples were brown, while the sample prepared in the absence of PVP-I was yellow. Sample-0.25 and sample-1 had very similar edges of absorption and sample-0.5 possessed the highest intensity of absorption than other samples; whereas the absorption intensity of sample-2 decreased slightly compared with the other I-doped CdS samples. To calculate the band gap energies, the diffuse reflectance spectra were plotted into Tauc plots [αhυ = A(hυ- E g)n] by extrapolating the linear portions of these curves to absorption equal to zero,Reference Bao, Shen, Takata, Domen, Gupta, Yanagisawa and Crimes28 as shown in Fig. 7(b). In the previous equation, α is the absorption coefficient, hυ is the photon energy, E g is the direct band gap, A is a constant, and n = 1/2 for a direct band gap semiconductor like CdS.Reference Ryu, Balcerski, Lee and Hoffmann32 The calculated band gaps of sample-0, sample-0.25, sample-0.5, sample-1, and sample-2 are 2.16, 1.79, 1.78, 1.79, and 1.81 eV, respectively, which could be attributed to the different content of doped iodine.Reference He, Liu, Sun, Yan, Zhang, Qi, Xu, Wu and Wei39Table I summarizes the calculated band gaps of the resulting samples.
(a) UV-vis diffuse reflectance absorption spectra of CdS samples by adjusting the molar ratio of PVP-I to Cd2+ from 0 to 2. (b) Plot of (αhυ)1/2 versus photon energy (hυ) corresponding to the UV-DRS in (a).

Summary of the physicochemical properties of different synthesized CdS samples.

a C and H denote cubic sphalerite and hexagonal wurtzite CdS phases, respectively.
b The BET surface area was determined by a multipoint BET method using the adsorption data in P/P0 range from 0.05 to 0.3.
c Pore volume and average pore size were determined by nitrogen adsorption volume at P/P0 = 0.951.
G. Nitrogen sorption measurement
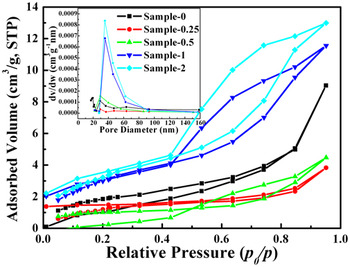
The porous structures of the resulting samples were investigated by nitrogen sorption. Figure 8 shows the nitrogen adsorption–desorption isotherms and Barret–Joyner–Halenda (BJH) pore-size distribution plots (inset) of CdS and I-CdS samples. As shown in Fig. 8, the adsorption isotherms of sample-0.5, sample-1, and sample-2 can be classified as type IV with type H1 hysteresis loops.Reference Sing, Everett, Haul, Moscou, Pierotti, Rouquerol and Siemieniewska40 This kind of adsorption would arise from the capillary condensation of N2 inside the mesoporous structures produced by the agglomeration of nanoparticles in the samples. In contrast, the adsorption isotherms of sample-0 and sample-0.25 can be assigned as type III with hysteresis loops, in which the adsorbate–adsorbate interactions play an important role.Reference Sing, Everett, Haul, Moscou, Pierotti, Rouquerol and Siemieniewska40 On the basis of N2 adsorption–desorption isotherms, the Brunauer–Emmett–Teller (BET) specific surface areas, BJH pore volumes, and mean pore diameters of CdS and I-CdS samples are summarized in Table I. It was found that the BET surface areas decreased from 7.1 to 3.5 and then increased to 12.7 with the molar ratio of PVP-I to Cd2+ changing from 0 to 2.
N2 adsorption–desorption isotherms and pore-size distributions (inset) of sample-0, sample-0.25, sample-0.5, and sample-2.

H. Photocatalytic activity of the CdS samples
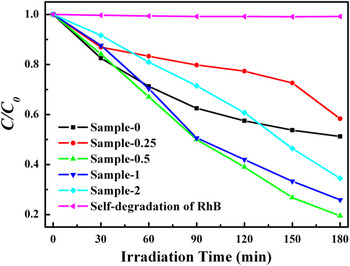
Photocatalytic activity tests were evaluated by the degradation of RhB aqueous solution under visible light irradiation (λ > 420 nm). Figure 9 shows the concentration change of RhB versus irradiation time in the presence of the CdS or I-CdS samples as well as the self-degradation of RhB. It is well known that RhB solution shows a maximum absorption at about 551 nm. The concentration of RhB was determined by the maximum absorption measurement in this study. As revealed in Fig. 9, the self-degradation of RhB was negligible, indicating the excellent photostabilization of RhB under visible light irradiation (λ > 420 nm). On the contrast, the presence of photocatalysts could result in the obvious degradation of RhB under visible light irradiation. After 3 h of visible light irradiation, the degradation percentages of RhB were 49%, 42%, 81%, 74%, and 66% over sample-0, sample-0.25, sample-0.5, sample-1, and sample-2, respectively. Obviously, among these tested photocatalysts, sample-0.5 exhibited the highest photocatalytic activity in the degradation of RhB. To quantitatively understand the reaction kinetics of the RhB degradation in our reaction system, we simulated the degradation process with the pseudo-first-order model as expressed by Eq. (1), which is generally used for the photocatalytic degradation process with low initial concentration of pollutantReference Zhang, Zhang, Xie and Wang41:

Photocatalytic properties of CdS samples on degradation of RhB as well as the self-degradation of RhB under visible light irradiation (λ > 420 nm).

where C 0 and C are the concentrations of RhB in aqueous solution at time 0 and t, respectively, and k is the pseudo-first-order rate constant. The rate constants calculated from data in Fig. 9 are summarized in Table I. The rate constants of sample-0 to sample-2 were 0.2551, 0.1548, 0.5098, 0.4383, and 0.3081, respectively.
It is known that the photocatalytic activity of a semiconductor depends on its crystal phase, crystallinity, band gap, surface area, and so on. Comparing the physicochemical properties of different sample-N shown in Table I, we could easily find that the photocatalytic degradation ratio of RhB over sample-0.5, sample-1, and sample-2 were obviously higher than those of sample-0 and sample-0.25, indicating that pure hexagonal phase, narrower band gap, and optimum content of doped iodine all played an important role in their higher photocatalytic activities. Furthermore, although sample-0.5 possessed the lowest surface area, its photocatalytic activity was significantly higher than other tested samples. Thus, we ruled out the contribution of BET surface area to the photocatalytic activity of the tested samples in this study. Therefore, the photocatalytic activity enhancement of sample-0.5 could be explained as follows: First, according to Bao’s results, pure hexagonal CdS has higher photocatalytic activity than that of cubic or mixed cubic and hexagonal CdS.Reference Bao, Shen, Takata, Domen, Gupta, Yanagisawa and Crimes28 This is because cubic CdS contains some defects acting as electron-hole (e −–h +) recombination centers,Reference Jang, Joshi and Lee9 which can reduce the formation of hydroxyl radicals, leading to the low photocatalytic activity of sample-0 and sample-0.25 photocatalysts with mixed phases of cubic and hexagonal CdS. Second, besides crystal phases, crystallinity and band gap were also important factors to influence the photocatalytic activity of semiconductors, because narrower band gap can facilitate the photoexcitation of electrons from the valence band to the conduction band of the photocatalysts, and higher crystallinity can promote the transportation of photogenerated electrons from bulk to surface of the crystals and reduce the recombination of photogenerated electron-hole pairs.Reference Peng, Zhao, Dai, Shi and Hirao6, Reference Jang, Joshi and Lee9, Reference Ohtani, Ogawa and Nishimoto42 Third, the optimum iodine dopant can introduce some impurity states to the band gap of CdS. On one hand, these impurity states can narrow the band gaps of as-prepared samples, facilitating the generation of photoexcited carriers; on the other hand, these impurity states may also decrease the number of charge carrier traps and restrain the recombination probability of the photoexcited carriers.Reference He, Liu, Sun, Yan, Zhang, Qi, Xu, Wu and Wei39 Therefore, these factors (e.g., pure hexagonal phase, narrower band gaps, and optimum content of doped iodine) have finally codetermined the enhancement of photocatalytic activity.
IV. CONCLUSIONS
In summary, by intelligently taking advantage of iodine doping, we obtained doped CdS with a pure hexagonal phase and narrower band gap. Furthermore, a critical point of 0.5 of molar ratio of PVP-I to Cd2+ for iodine doping was found to be necessary for obtaining a pure hexagonal phase that facilitated improving photocatalytic activity. The morphologies of the resulting CdS samples could be controlled from irregular cone-shaped particles to uneven microspheres, further to smooth microspheres, and the crystal phases also transformed from mixed cubic and hexagonal phases to a single hexagonal phase on an increasing molar ratio of PVP-I to Cd2+ from 0 to 2. The iodine doping resulted in the red shift of absorption edges of CdS samples and thus narrowed their band gaps. Among all the synthesized samples, the iodine-doped CdS synthesized with the molar ratio of PVP-I to Cd2+ equaling to 0.5 exhibited the highest photocatalytic activity on the degradation of RhB in aqueous solution under visible light irradiation (λ > 420 nm), and its photocatalytic activity was almost twofold of that of the pure CdS sample obtained in the absence of PVP-I. The enhanced photocatalytic activity could be codetermined by a pure hexagonal phase, crystallinity, and narrower band gap. This study provides an effective way to tune the band gap and crystal phase by simply doping iodine, and thus to improve the photocatalytic activity of metal chalcogenides.
ACKNOWLEDGMENTS
This work was supported by National Basic Research Program of China (973 Program) (Grant 2007CB613301), National Science Foundation of China (Grants 20777026, 20977039, and 20873118), Program for New Century Excellent Talents in University (Grant NCET-07-0352 and NCET-08-0665), the Key Project of Ministry of Education of China (Grant 108097), Program for Innovation Team of Hubei Province (Grant 2009CDA048), Self-Determine Research Funds of CCNU from the Colleges’ Basic Research and Operation of MOE (CCNU09A02014 and CCNU09C01009), the Program for Science & Technology Innovation Talents in Universities of Henan Province (2008 HASTIT016), Innovation Scientists and Technicians Troop Construction Projects of Henan Province (Grant No. 104100510001).