INTRODUCTION
Sugarcane (Saccharum spp.) is a crop of considerable economic importance worldwide that provides 0·60–0·70 of the world's sugar and represents an essential renewable source of biofuel (Prabu et al. Reference Prabu, Kawar, Pagariya and Prasad2011). It is cultivated in the tropical and subtropical regions of more than 90 countries, with Brazil being the world's largest producer, accounting for c. 0·45 of global ethanol production (Waclawovsky et al. Reference Waclawovsky, Sato, Lembke, Moore and Souza2010). Sugarcane is adapted to different climate and soil conditions, requiring 1500–2500 mm of rainfall per season and performing best at temperatures of 25–33 °C (Liu et al. Reference Liu, Kingston and Bull1998; Silva et al. Reference Silva, Santos, Arantes, Pincelli, Crusciol, Silva, Rossetto and Soratto2010).
Although there is a large geographical area available for growing sugarcane, many of these areas are prone to drought (Ghannoum Reference Ghannoum2009; Prabu et al. Reference Prabu, Kawar, Pagariya and Prasad2011). Water deficit is the main factor limiting sugarcane productivity around the world (Inman-Bamber & Smith Reference Inman-Bamber and Smith2005; Silva et al. Reference Silva, Silva, Enciso, Sharma and Jifon2008; Jangpromma et al. Reference Jangpromma, Songsri, Thammasirirak and Jaisil2010). The limitations of water stress on sugarcane productivity have been the subject of several studies (Inman-Bamber & Smith Reference Inman-Bamber and Smith2005; Smit & Singels Reference Smit and Singels2006; Silva et al. Reference Silva, Silva, Enciso, Sharma and Jifon2008; Singels et al. Reference Singels, Van Den Berg, Smit, Jones and Van Antwerpen2010). Studies aimed at selecting drought-tolerant cultivars are a viable alternative to increases in productivity and a necessity for the future (Prabu et al. Reference Prabu, Kawar, Pagariya and Prasad2011).
Under soil water-deficit conditions, plants show adaptive mechanisms and/or responses that allow them to survive. In this regard, a few recent studies have defined physiological changes related to drought tolerance in sugarcane. Among the responses of drought-tolerant genotypes are the smallest reduction in relative water content (RWC) of the leaf (Silva et al. Reference Silva, Jifon, Silva and Sharma2007; Jangpromma et al. Reference Jangpromma, Songsri, Thammasirirak and Jaisil2010), smallest decrease in leaf water potential (Koonjah et al. Reference Koonjah, Walker, Singels, Van Antwerpen and Nayamuth2006), smallest increase in leaf temperature (LT) (Silva et al. Reference Silva, Jifon, Silva and Sharma2007, Reference Silva, Jifon, Sharma, Silva, Caputo, Damaj, Guimarães and Ferro2011; Rodrigues et al. Reference Rodrigues, Laia and Zingaretti2009), smallest reduction in photosystem quantum efficiency (Silva et al. Reference Silva, Jifon, Silva and Sharma2007, Reference Silva, Jifon, Sharma, Silva, Caputo, Damaj, Guimarães and Ferro2011) and smallest decreases in stomatal conductance and photosynthetic rate (McCormick et al. Reference Mccormick, Cramer and Watt2008; Gonçalves et al. Reference Gonçalves, Ferreira, Silva, Endres, Barbosa and Duarte2010; Sato et al. Reference Sato, Catuchi, Ribeiro and Souza2010). Despite the existence of a significant amount of research on these physiological variables, little is known about their interactions with crop productivity. These traits can be measured as an alternative method of characterizing tolerant and susceptible genotypes in sugarcane breeding programmes.
Photosynthesis plays a pivotal role in crop production. Under dry conditions, there is a decrease in the photosynthetic rate because the stomata close to conserve water as the soil water status decreases, leading to a decrease in the leaf internal CO2 concentration (Lawlor & Tezara Reference Lawlor and Tezara2009). However, the limitations on CO2 assimilation imposed by stomatal closure may promote an imbalance in photosystem II (PSII), photochemical activity, which may cause changes in the functional state of the thylakoid membranes of chloroplasts, thereby causing changes in the characteristics of quantifiable fluorescence signals in the leaves. These changes can be used to estimate the inhibition or damage in the PSII electron transfer process (Baker & Rosenqvist Reference Baker and Rosenqvist2004; Carvalho Reference Carvalho2008).
Photoinhibition intensity can be measured by a reduction in the maximum quantum efficiency of PSII (F v/F m); this ratio reflects the maximum efficiency whereby light absorbed by the PSII antenna complex is converted into chemical energy (Maxwell & Johnson Reference Maxwell and Johnson2000). This parameter can be measured, giving a fast, non-destructive screening of sugarcane genotypes for drought tolerance (Silva et al. Reference Silva, Jifon, Silva and Sharma2007, Reference Silva, Jifon, Sharma, Silva, Caputo, Damaj, Guimarães and Ferro2011). It has also been used in selecting drought-tolerant genotypes in other crops such as beans, Phaseolus vulgaris L. (Souza et al. Reference Souza, Machado, Silva, Lagôa and Silveira2004), wheat, Triticum spp. (Paknejad et al. Reference Paknejad, Nasri, Moghadam, Zahedi and Alahmadi2007), subterranean clover, Trifolium subterraneum L. (Mauro et al. Reference Mauro, Occhipinti, Longo and Mauromicale2011) and maize, Zea mays (Zou et al. Reference Zou, Yu, Zhang, Jiang and Liu2009). Another advantage of using F v/F m in the selection of cultivars is that this characteristic has high heritability (Zhang et al. Reference Zhang, Chen, Luo, Lu and Xu2000).
Another useful trait for assessing drought tolerance is leaf chlorophyll content, which can be measured using leaf greenness index meters such as the chlorophyll meter (SPAD-502). This approach has proven to be useful for diagnosing the integrity of the photosynthetic system in different species under conditions of stress (Torres Netto et al. Reference Torres Netto, Campostrini, Oliveira and Bressan-Smith2005; Mauro et al. Reference Mauro, Occhipinti, Longo and Mauromicale2011; González et al. Reference González, Bermejo and Gimeno2010; Zhao et al. Reference Zhao, Sun, Dai, Zhang and Wu2010) and can thus help in the advanced interpretations of the photochemical process in plants (Torres Netto et al. Reference Torres Netto, Campostrini, Oliveira and Bressan-Smith2005). Chlorophyll meters are often portable and non-destructive (Peryea & Kammereck Reference Peryea and Kammereck1997). Recent studies indicate close relationships between the estimated chlorophyll concentration and the effect of water deficit conditions on sugarcane (Silva et al. Reference Silva, Jifon, Silva and Sharma2007, Reference Silva, Jifon, Sharma, Silva, Caputo, Damaj, Guimarães and Ferro2011; Jangpromma et al. Reference Jangpromma, Songsri, Thammasirirak and Jaisil2010), which is used as an essential feature in the selection of varieties.
According to Xoconostle-Cazares et al. (Reference Xoconostle-Cazares, Ramirez-Ortega, Flores-Elenes and Ruiz-Medrano2010), a combination of morphological, physiological, biochemical and molecular techniques are required for modern agriculture to produce new high-performance genotypes combined with leadership traits for drought tolerance and that show a positive correlation with productivity performance, which is essential for meeting the global demand for food and therefore crucial for improving the efficiency of water use in agriculture. As a result, more detailed knowledge of crop development, based on alterations in the source–sink dynamics, is an essential tool to help find an explanation for the low production potential of the crop under water deficit. Moreover, the understanding of physiological mechanisms can provide advanced data on a few strategies to be used in breeding programmes for selection of drought-tolerant cultivars.
Silva et al. (Reference Silva, Silva, Enciso, Sharma and Jifon2008) found differences in productivity and yield components of 80 sugarcane genotypes grown under two water regimes, with and without water deficit stress. Under stress, the authors found that the TCP93-4245 variety, considered drought-tolerant, showed a higher productivity, greater number of stems, greater stem height and greater stem mass than the sensitive variety, TCP87-3388, showing a positive correlation between these morphological variables and total biomass production. The present work presents a supplemental study that assessed the physiological responses of the same genotypes and their relationships to productivity under the two water regimes.
The aim of the present study was to assess the relationships between critical physiological variables and the productivity of field-grown sugarcane genotypes under water deficit stress during the period of rapid growth and development.
MATERIALS AND METHODS
Eighty sugarcane genotypes were grown in a commercial-type field near Weslaco, TX, USA (26°12′N, 97°57′W, 18·9 m asl) to evaluate their tolerance to water stress during the growing season of 2005/06. The soil type at the experimental site was a sandy clay loam Typic Calciustolls.
Single node stalk segments of each genotype were planted on 14 November 2005, in three-row plots, 3·0 m long and 1·50 m apart. Data were collected from the central row plants. Two irrigation treatments (well-watered or drought-stressed) were initiated at 180 days after planting (May 2006).
The well-watered treatment will be referred herein as wet and the moderate water-deficit treatment as dry. The experiment was conducted in a randomized complete block design with four replicates within each irrigation treatment. Two genotypes were chosen as ‘standard’ varieties from among the initial 80, according to their behaviour in relation to drought in the Rio Grande Valley region, Texas. TCP87-3388 was chosen as a drought-susceptible cultivar and TCP93-4245 as drought-tolerant (Silva et al. Reference Silva, Silva, Enciso, Sharma and Jifon2008). The 78 remaining genotypes are from different American breeding programmes, and they are in the adaptation assessment phase for south Texas environmental conditions.
These genotypes are originally from: the United States Department of Agriculture (USDA), Canal Point, Florida, USA (CP); USDA, Hawaii, USA (H); USDA, Houma, Louisiana (LA), USA (Ho); USDA, Houma and Canal Point, USA (HoCP); Louisiana State University (LSU), LA, USA (L); LSU and USDA, Canal Point, USA (LCP); recurrent selection for borer resistance, USDA, Houma, LA (RSB); USDA, Houma and LSU, LA, USA (US); Texas A&M University and USDA, Canal Point, USA (TCP); and Texas A&M University, USA and Copersucar, Brazil (TSP). The crop water requirements were met for all treatments following pre-established soil moisture replenishment levels (100 and 80% for the wet and dry treatments, respectively). Volumetric soil moisture content was monitored with a neutron probe (Model 503 DR Hydroprobe Moisture Gauge, CPN Int. Inc., California, USA). One access tube was installed at each site (wet and dry) to a depth of 1·80 m. For the dry treatments, soil water was replenished at 80% depletion of the soil moisture (readings taken at the 450 mm layer). Some irrigation events were skipped at the moderate water stress treatment to deliberately stress the sugarcane, in accordance with Ramesh & Mahadevaswamy (Reference Ramesh and Mahadevaswamy2000). This condition was imposed 180–270 days after planting, i.e. during the grand growth phase (Gascho & Shih Reference Gascho, Shih, Teare and Peet1983).
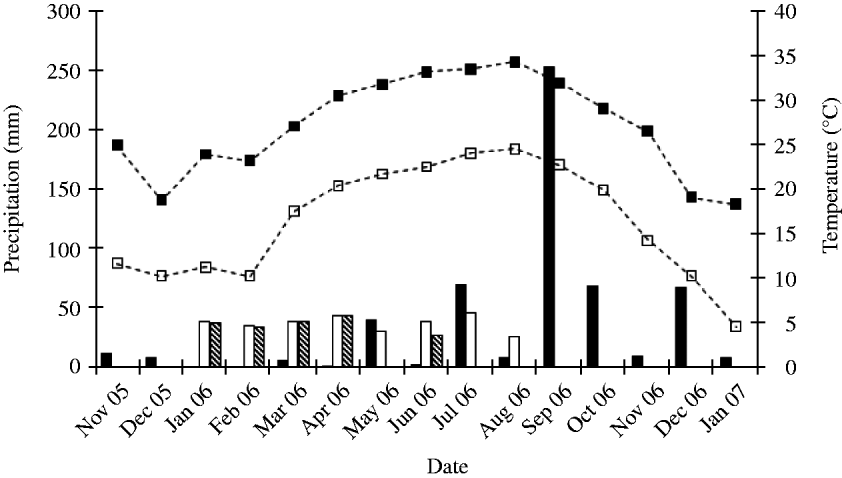
Monthly total rainfall, monthly total water applied to genotypes and average air temperatures during November 2005 to January 2007 are shown in Fig. 1. The total amount of rainfall received during the cropping period was 568 mm, while the irrigation amount applied between January and June was 184 and 300 mm on the dry and wet treatments, respectively. Thus, the total amount of water was 752 mm for the dry and 868 mm for the wet treatment.
Monthly total rainfall and irrigation for dry and wet treatments, and maximum and minimum mean air temperature between November 2005 and January 2007, in Weslaco, TX. Symbols indicate precipitation (▪), irrigation on wet treatment (□), irrigation on dry treatment ( ), maximum temperature (
 ) and minimum temperature (
 ).

Physiological parameters were measured at 90 days after the onset of treatments (DAT), i.e. August 2006, on cloudless days and between 09·00 and 15·00 h. Chlorophyll a fluorescence characteristics were measured on intact leaves using a pulse amplitude modulation fluorometer (Model OS5-FL, Opti-Sciences, Tyngsboro, MA, USA), and used to estimate the extent of drought-induced photoinhibition. During each measurement date, at least four leaves +1 (the first leaf from top to bottom of the stalk with clearly visible dewlap) per plot were chosen randomly and dark-adapted for 30 min using leaf clips (FL-DC, Opti-Science) before fluorescence measurements. The F v/F m ratio parameter was determined following the procedures of Maxwell & Johnson (Reference Maxwell and Johnson2000), and used as to quantify the degree of drought-induced photoinhibition.
Leaf chlorophyll content (SPAD index) was non-destructively estimated using a SPAD-502 chlorophyll meter (Minolta Corp., Ramsey, NJ, USA). The average of five measurements taken on different plants chosen randomly in each plot was recorded. LT readings were collected using a hand-held infrared thermometer (Model OS530HR, Omega Engineering Inc., Stamford, CT, USA) with leaf emissivity set at 0·95. During each LT measurement, the natural leaf orientation with respect to the sun was maintained to avoid shade effects. Following the LT measurements, leaf discs (13 mm diameter) were collected with a cork borer from the same leaves used for F v/F m, SPAD index and LT measurements were used to determine leaf RWC following the method of Matin et al. (Reference Matin, Brown and Ferguson1989).
The relative leaf water content (RWC) was calculated as RWC% = [(fresh mass–dry mass)/(water saturated mass–dry mass)] × 100. Five discs per plant were collected, immediately sealed in glass vials and quickly transported to the laboratory in an ice-cooled chest. Leaf disk fresh weights were determined within 2 h after excision. The turgid weight was obtained after rehydration in deionized water for 24 h at room temperature. After rehydration, leaves were quickly and carefully blotted dry with lint-free tissue paper before determining turgid weight. Dry weights were recorded after oven-drying leaf samples for 48 h at 80 °C.
Productivity (t/ha) was calculated from the weight of all millable stalks per plot and the area occupied by each plot. Data were subjected to analysis of variance, using the SPSS 13.0 statistical package. The standard errors were given at P≤0·05. The correlations between physiological and productivity parameters were evaluated using Pearson's correlation coefficients.
RESULTS
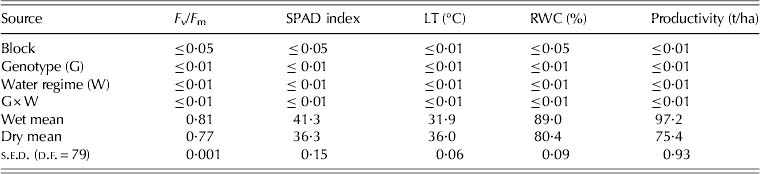
Leaf F v/F m, chlorophyll content estimate (SPAD index), LT, RWC in the leaf and productivity were affected significantly by water stress (Table 1). Compared to the control without water deficit, plants grown under dry conditions showed significantly higher values (P < 0·01) for LT and lower values (P < 0·01) for the other physiological variables (Table 1). There was also a significant difference (P < 0·01) in productivity between treatments, with an average value of 97·2 t/ha in the wet treatment, and 75·4 t/ha in plots in the dry (Table 1).
F probabilities and means for PSII photochemical efficiency (Fv/Fm), estimated chlorophyll content (SPAD index), LT, leaf RWC, and productivity of eighty sugarcane genotypes grown under wet and dry conditions and measured on three dates
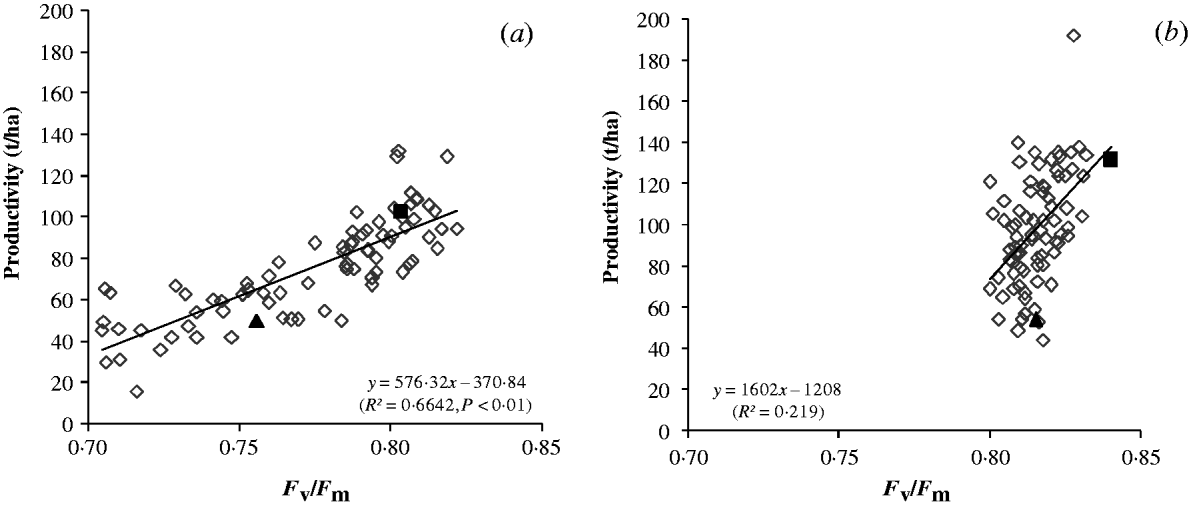
The F v/F m significantly differed (P < 0·01) between treatments. The average F v/F m value was 0·81 under wet conditions and 0·77 under dry (Table 1). A linear correlation was found between productivity and the F v/F m ratio. The linear regression accounted for 66·4% of the variance for genotypes subjected to drought (Fig. 2(a)) and 22% among genotypes under irrigation (Fig. 2(b)). The tolerant genotype TCP93-4245 showed better PSII efficiency than the sensitive genotype TCP87-3388 when subjected to both treatments (Fig. 2).
Relationship between productivity and maximum chlorophyll a fluorescence ratio, in drought tolerant (TCP93-4245), drought sensitive (TCP87-3388) and 78 sugarcane genotypes under (a) dry and (b) wet treatments. Symbols are data from 78 sugarcane genotypes (◊), genotype TCP93-4245 (■) and genotype TCP87-3388 (▲).
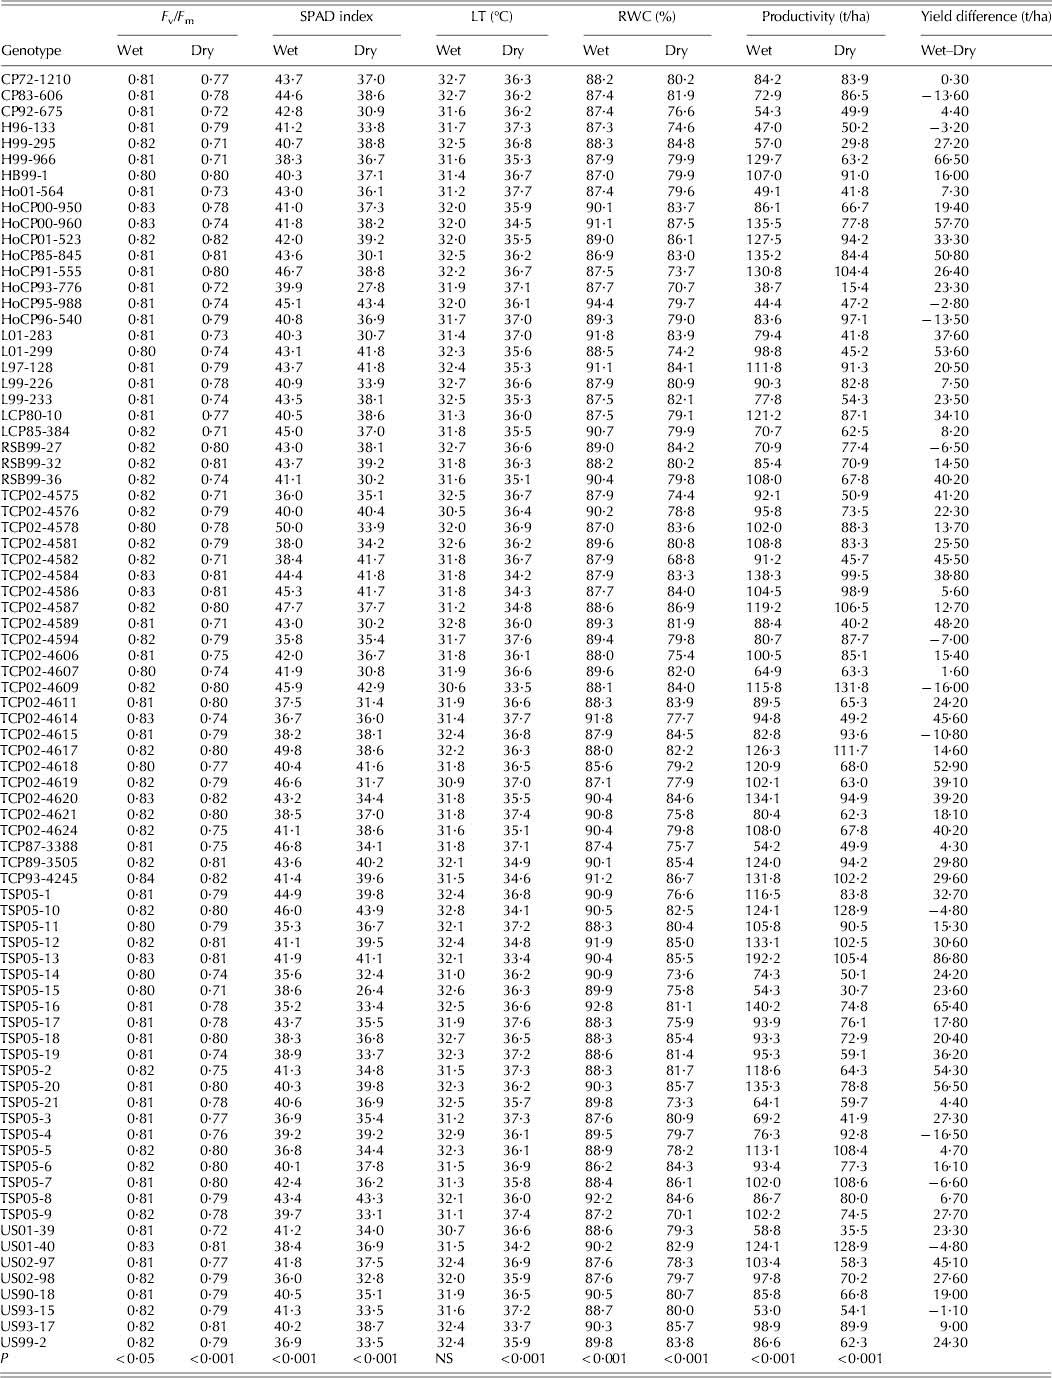
Under the dry treatment, the tolerant genotype TCP93-4245 had an average productivity of 102·2 t/ha and F v/F m of 0·82 (Table 2, Fig. 2(a)), while productivity in the wet treatment was 131·8 t/ha and F v/F m was 0·84 (Table 2, Fig. 2(b)). The standard sensitive genotype TCP87-3388 had lower productivity, 49·67 t/ha, and a lower value of F v/F m, 0·75, under drought conditions (Table 2, Fig. 2(a)), whereas with irrigation, the productivity increased to 54·26 t/ha and the F v/F m to 0·81 (Table 2, Fig. 2(b)).
Chlorophyll fluorescence (Fv/Fm), estimated chlorophyll content (SPAD index), LT, leaf RWC, productivity, and the yield difference of 80 sugarcane genotypes grown under wet and dry treatments
TCP87-3388 = susceptible standard.
TCP93-4245 = tolerant standard.
Among the 80 genotypes, 20 showed lower values of F v/F m, ranging from 0·74 to 0·71 under water stress, which were also correlated with lower yields (Table 2). This suggests that values of F v/F m below 0·75 in sugarcane can be considered enough to reduce the efficiency of energy excitation in the photochemical process during drought stress.
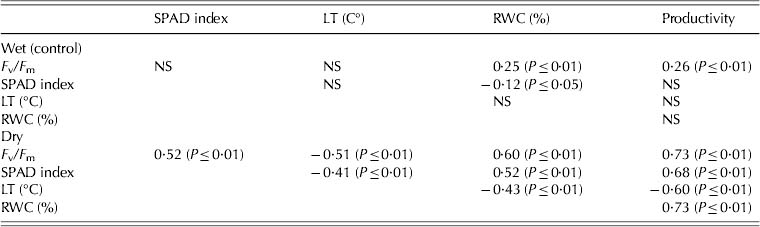
Under dry conditions (Fig. 2(a)), the most productive genotype among the 78 examined was TCP02-4609, with a productivity of 131·8 t/ha and a high F v/F m ratio of 0·80, while the least productive genotype, HoCP93-776, showed a productivity of 15·4 t/ha and F v/F m ratio of 0·72 (Table 2). Moreover, the latter genotype had lower production potential when irrigated (38·7 t/ha), even with a high F v/F m ratio of 0·81. Under the wet treatment, there were positive correlations of F v/F m with productivity (r = 0·26, P < 0·01) and RWC (r = 0·25, P < 0·01) (Table 3). Under the dry treatment, the F v/F m also had positive correlations with productivity (r = 0·73, P < 0·01), RWC (r = 0·60, P < 0·01) and SPAD index (r = 0·52, P < 0·01) and inverse correlation with LT (r = –0·51, P < 0·01) (Table 3).
Pearson's correlation coefficients for association among chlorophyll fluorescence (Fv/Fm), estimated chlorophyll content (SPAD index), LT, leaf RWC and productivity of eighty sugarcane genotypes grown under two watering treatments
NS, not significant.
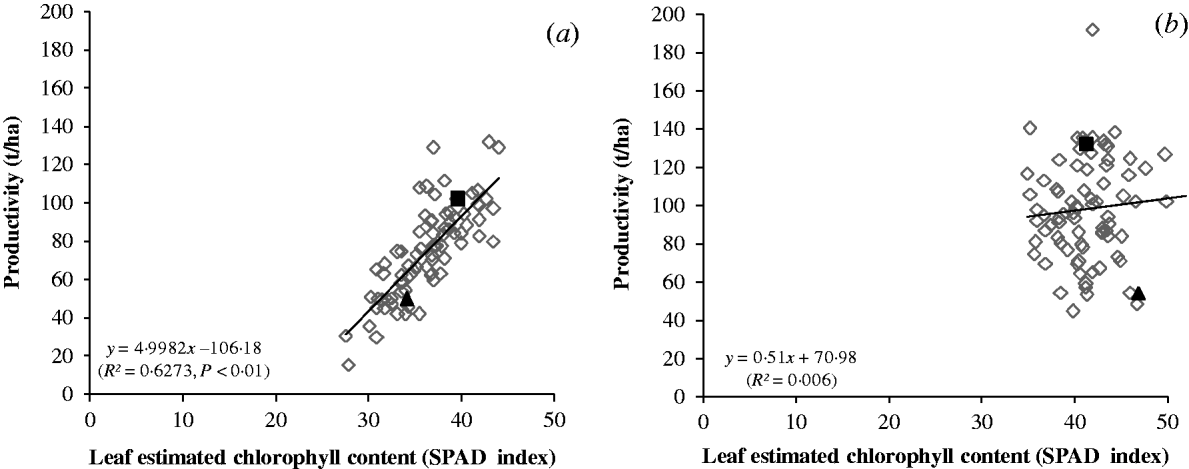
The SPAD index showed mean values of 41·2 for the wet treatment and 36·2 for the dry (Table 1). A linear regression (R 2 = 0·6273, P < 0·01) was found between productivity and the SPAD index (Fig. 3). Under water deficit, the lower SPAD index values were related to lower productivity values (Fig. 3(a)).
Relationship between productivity and estimated chlorophyll content (SPAD index), in drought tolerant (TCP93-4245), drought sensitive (TCP87-3388) and 78 sugarcane genotypes under (a) dry and (b) wet treatments. Symbols are data from 78 sugarcane genotypes (◊), genotype TCP93-4245 (■) and genotype TCP87-3388 (▲).
The tolerant standard TCP93-4245 had a SPAD index of 39·6 related to productivity of 102·2 t/ha, while the sensitive standard TCP87-3388 showed lower values for both the SPAD index, 34·1, and productivity, 49·9 t/ha, under low soil water availability (Table 2, Fig. 3(a)). However, in the irrigation treatment, higher values were observed for both standards, i.e. the tolerant standard TCP93-4245 showed a SPAD index of 41·4 and productivity of 131·8 t/ha, while the sensitive standard TCP87-3388 had a value of 46·8 for the SPAD index and productivity of 54·2 t/ha (Table 2, Fig. 3(b)).
In general, the genotypes of the sensitive group showed a strong reduction in estimated chlorophyll content with averages that ranged from 40·0 to 35·0 SPAD index in the dry treatment (Table 2). The genotypes of the tolerant group showed similar responses to the tolerant standard genotype with mean values of 40–42 SPAD index under the wet treatment and averages around 39·9 SPAD index under the dry treatment, indicating a higher intensity of green colour in these genotypes even under water stress.
The results also indicate a high association between the SPAD index and productivity during water deficit for the remaining genotypes, especially the TCP02-4609 genotype that had the highest values, with an average SPAD index of 42·9 related to its productivity of 131·8 t/ha (Table 2). This value is higher than that of the tolerant standard TCP93-4245. The lowest productivity mean was found for the HoCP93-776 genotype with a SPAD index value of 27·8, and this genotype showed lower productivity than other genotypes under the stress condition. Under irrigation, the SPAD index values of these genotypes were found to be similar to that of the standard genotype. Under drought conditions, positive correlations between the SPAD index and both productivity (r = 0·68, P < 0·01) and RWC (r = 0·52, P < 0·01) were observed (Table 3). A negative correlation between the LT and the SPAD index (r = –0·41, P < 0·01) was also observed.
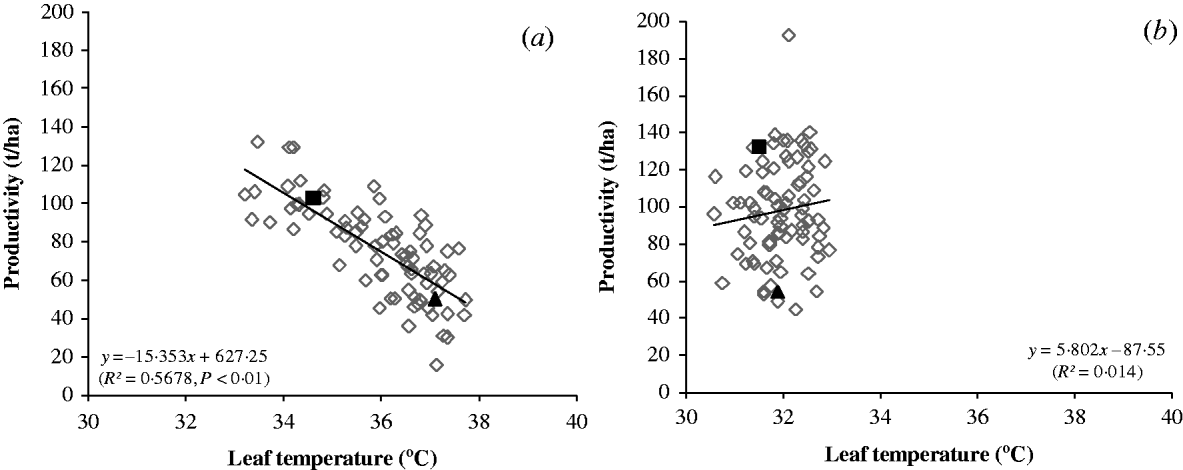
The drought effect was evident in LT data, which showed an average value of 36·2 °C, significantly higher than the value of 31·9 °C found for the wet treatment (Table 1). An inverse relationship was found between productivity and LT, i.e. higher productivity values under the dry treatment were observed with lower LTs, wherein LT accounted for 56·7% of the variation (Fig. 4(a)). This pattern of LT response was lower under irrigation conditions, displaying a weak relationship between the LT and productivity (Fig. 4(b)), and the variation of this feature was not significant. The sensitive standard TCP87-3388 had an LT of 31·8 °C and productivity 54·2 t/ha, while the tolerant standard TCP93-4245 had an LT of 31·5 °C and productivity of 131·8 t/ha under wet treatment (Table 2, Fig. 4(b)). In the dry treatment, TCP87-3388 showed a high LT of 37·1 °C, which corresponded to an increase of 5·3 °C in relation to the wet treatment, which was also related to a low productivity of 49·9 t/ha (Table 2, Fig. 4(a)). The TCP93-4245 genotype showed an LT of 34·6 °C which corresponded to an increase of only 3·1 °C in the LT when compared with the wet treatment and it was related to a higher productivity of 102·2 t/ha (Table 2, Fig. 4(a)).
Relationship between productivity and LT, in drought tolerant (TCP93-4245), drought sensitive (TCP87-3388) and 78 sugarcane genotypes under (a) dry and (b) wet treatments. Symbols are data from 78 sugarcane genotypes (◊), genotype TCP93-4245 (■) and genotype TCP87-3388 (▲).
This pattern of response was also observed in the other genotypes examined in the present study: the highest productivity values corresponded to the lowest temperatures during the drought period. LT increased in all genotypes under drought imposition; however, higher averages were seen in the most sensitive genotypes, with approximate increases of 5–6 °C, while that of the tolerant genotypes was c. 3·5 °C in relation to plants under wet conditions (Table 2). This trend was clearly demonstrated by the genotype TCP02-4609, which had the lowest average temperature of 33·5 °C while maintaining a high productivity of 131·8 t/ha during the dry period (Table 2), following the same trend for the irrigation treatment. In turn, the HoCP93-776 genotype showed higher sensitivity to water deficit, with a higher value of LT, 37·1 °C, corresponding to a lower productivity of 15·4 t/ha, less than that of the sensitive standard TCP87-3388. This genotype showed only a small increase in productivity under the irrigation treatment, 38·7 t/ha, with a drop in LT, 31·9 °C, when compared with the sensitive standard genotype.
Correlations between LT, physiological variables and productivity were only observed for plants under dry conditions (Table 3). The correlations between LT and all physiological variables, the SPAD index (r= − 0·41, P < 0·01), F v/F m (r = − 0·51, P < 0·01) and RWC (r= − 0·43, P < 0·01) as well as that between LT and productivity (r= − 0·60, P < 0·01) were negative (Table 3).
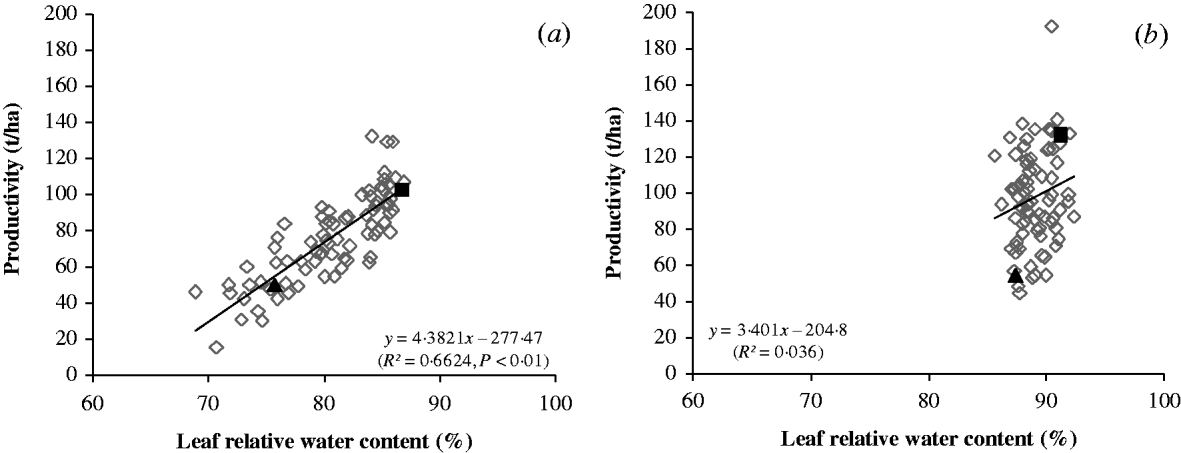
Leaf RWC differed significantly between treatments. The highest average, 0·89, was found in irrigated plants and significantly differed from the average of 0·80 found under drought conditions (Table 1). A positive correlation was found between RWC and productivity for genotypes subjected to drought, with 66·2% of the variation accounted for by linear regression (Fig. 5(a)) and a variation of only 3·6% between the genotypes under wet conditions (Fig. 5(b)), which suggests that there is little influence of RWC on productivity under an optimal water regime.
Relationship between productivity and leaf RWC, in drought tolerant (TCP93-4245), drought sensitive (TCP87-3388) and 78 sugarcane genotypes under (a) dry and (b) wet treatments. Symbols are data from 78 sugarcane genotypes (◊), genotype TCP93-4245 (■) and genotype TCP87-3388 (▲).
Under dry conditions, the productivity of the tolerant standard TCP93-4245, 102·2 t/ha, correspond to a RWC of 0·87, whereas the RWC was lower in the sensitive standard TCP87-3388 (0·76), with a productivity of 49·9 t/ha (Table 2, Fig. 5(a)), demonstrating the reduced ability of the sensitive standard to retain water in its leaf tissues under low soil moisture. In the wet treatment, the productivity value of 131·8 t/ha for the standard TCP93-4245 was related to an RWC of 0·91, while TCP87-3388 had a slightly lower RWC, 0·87, and a rather low productivity of 54·2 t/ha (Table 2, Fig. 5(b)).
A correlation between productivity and RWC was also found in the remaining genotypes studied. In most of the genotypes considered in the sensitive group, RWC decreased to values of 0·88–0·75 under dry conditions (Table 2), a reduction of c. 17·3%, whereas in the tolerant genotype group, RWC ranged from 0·89 to 0·82, representing a reduction of 8% under the same conditions. Reduction of RWC was smaller for the genotype TCP02-4609, with an average value of 0·84 when subjected to dry conditions, while HoCP93-776 showed the largest reduction of RWC (0·71) in the experimental strains. Overall, the sensitive standard TCP87-3388 genotype presented the largest reduction in RWC.
Under drought stress, RWC was positively correlated with productivity (r=0·73, P < 0·01), while RWC and LT were inversely related (r = − 0·43, P < 0·01) (Table 3).
Some genotypes showed an outstanding agronomic performance in the dry treatment, with production remaining above 100 t/ha and showing a higher productivity under water deficit compared with well-watered conditions (Table 2). In addition to the standard variety TCP93-4245, genotypes HoCP91-555, TCP02-4587, TCP02-4617, TSP05-10, TSP05-12, TSP05-13, TSP05-5, TSP05-7, US01-40 and the aforementioned TCP02-4609 showed high yield potential under drought. Moreover, the genotypes CP92-675, H96-133, H99-966, Ho01-564, HoCP95-988, L01-283, L01-299, L99-233, TCP02-4575, TCP02-4582, TCP02-4589, TCP02-4614, TSP05-14, TSP05-15, TSP05-16, TSP05-19, TSP05-2, TSP05-21, TSP05-3, US01-39, US02-97, US93-15 and HoCP93-776 were similar to the standard variety TCP87-3388, and showed lower yield potential under drought conditions (Table 2).
From another point of view, 13 genotypes (CP83-606, H96-133, HoCP95-988, HoCP96-540, RSB99-27, TCP02-4594, TCP02-4609, TCP02-4615, TSP05-10, TSP05-4, TSP05-7, US01-40 and US93-15) were more productive under dry than wet conditions, especially genotype US01-40 which, besides producing more under drought conditions, also maintained yields above 100 t/ha in both environments. More than 30 other genotypes maintained 0·75 of yield under water deficit (Table 2).
DISCUSSION
Under soil moisture deficit stress, F v/F m, SPAD index and RWC were positively correlated with productivity. Conversely, LT was negatively correlated with productivity. Therefore, the ability of sugarcane genotypes to maintain high leaf water status and thus preserve the photosynthetic apparatus under water deficit is responsible for higher productivity values.
The maximum quantum efficiency, on average, varied little between the wet and dry treatments, with F v/F m values of 0·81 and 0·77, respectively, indicating that exposure of plants to stress in the field did not compromise the photosynthetic apparatus. Under severe stress, the differences would probably be greater. According to Silva et al. (Reference Silva, Jifon, Silva and Sharma2007), the ability to maintain a high F v/F m ratio under water stress may indicate high radiation use efficiency, possibly by carbon assimilation reactions. Bolhàr-Nordenkampf et al. (Reference Bolhàr-Nordenkampf, Long, Baker, Öquist, Schreiber and Lechner1989) stated that when a plant's photosynthetic apparatus remains intact, the F v/F m values vary from 0·75 to 0·85. However, a study by Silva et al. (Reference Silva, Jifon, Sharma, Silva, Caputo, Damaj, Guimarães and Ferro2011) found that sugarcane genotypes with values of F v/F m below 0·76 showed signs of stress under drought.
The sensitive standard genotype TCP87-3388 showed a low F v/F m ratio of 0·75, which was related to low productivity under drought conditions. This suggests that despite having little reduction in the F v/F m, this genotype incurred damage to the photochemical process during stress, which contributed to the reduction in productivity. Furthermore, the genotypes of the sensitive group showed lower values of F v/F m (c. 0·73) under water stress. These genotypes, together with the susceptible standard, also showed a low productivity recovery signal when hydrated despite having a high F v/F m ratio, which suggests that in addition to being classified as sensitive to drought, these genotypes can also be regarded as having low production potential. Similar behaviour was found by Silva et al. (Reference Silva, Jifon, Silva and Sharma2007), who, while studying the effect of photochemical activity in sugarcane under water deficit in field conditions, found an F v/F m activity of 0·74–0·82 during stress, the lower values being correlated with lower productivity. According to Maxwell & Johnson (Reference Maxwell and Johnson2000), values below 0·75 indicate a stressful situation and, therefore, reduction of the photosynthetic potential of plants.
Gonçalves et al. (Reference Gonçalves, Ferreira, Silva, Endres, Barbosa and Duarte2010) found a 5% reduction in the F v/F m ratio between tolerant and sensitive sugarcane genotypes. The average F v/F m values were 0·69–0·77 under water deficit in the glasshouse. Rodrigues et al. (Reference Rodrigues, Laia and Zingaretti2009), while studying a tolerant and a sensitive sugarcane genotype grown in a glasshouse, found a decrease in F v/F m ratio under water deficit, with values lower than 0·70 during stress. A reduction in F v/F m was also found in sugarcane exposed to salt stress (Suriyan & Chalermpol Reference Suriyan and Chalermpol2009). The reduction in F v/F m is considered a photoprotective mechanism, lowering the energy pressure in photosystems under conditions of excess energy (Zheng et al. Reference Zheng, Feng, Lei and Yang2009).
Under adequate soil moisture conditions for sugarcane development, it appears that the F v/F m ratio has a direct effect on productivity, indicating that the most productive genotypes had higher F v/F m values than the less productive genotypes. Well watered, healthy leaves often maintain F v/F m of c. 0·80 and, therefore, high photosynthetic rates, which often translate into high productivity (Hall & Rao Reference Hall and Rao1994). According to Singels et al. (Reference Singels, Van Den Berg, Smit, Jones and Van Antwerpen2010), water plays a pivotal role in the production of sugarcane because it determines the crop's biomass and production of sucrose through the responses of the photosynthesis rate and crop growth.
The present study indicates that the increase in F v/F m is associated with higher productivity in sugarcane. Thus, this method can be a good tool for selection since it is easily measured and may allow selection of a large number of drought-tolerant genotypes in a short time.
In the current study, the SPAD index was significantly lower in plants exposed to dry conditions compared with plants without stress. The sensitive variety had an average SPAD index of 34·1, while the tolerant standard had a higher value. It should be noted that in the present study, the tolerant genotypes maintained high estimated chlorophyll values under drought conditions and maintained a high SPAD index when hydrated.
The most productive genotypes (⩾100 t/ha) under water deficit showed SPAD index values of c. 40·0. Other genotypes of low productive potential or sensitive to drought showed lower values, indicating that these genotypes have a lower capacity for synthesizing chlorophyll, therefore, less intense green even under water stress, which can promote lower levels of photosynthesis, i.e. less production, reaffirming the drought sensitivity in these genotypes. According to Bernardes (Reference Bernardes, Castro, Ferreira and Yamada1987), chlorophyll is the pigment that reflects the green colour and is directly associated with high photosynthetic efficiency, which in turn can be related to increased crop productivity.
These values corroborate the findings of Silva et al. (Reference Silva, Jifon, Silva and Sharma2007, Reference Silva, Jifon, Sharma, Silva, Caputo, Damaj, Guimarães and Ferro2011), who reported SPAD index values above 40·0 in tolerant genotypes of sugarcane under irrigation and lower values under dry conditions. Decreases in the SPAD index were also observed in sensitive genotypes of barley when subjected to water deficit (Zhao et al. Reference Zhao, Sun, Dai, Zhang and Wu2010). When the plant is exposed to water deficit, the decrease in SPAD index is sensitive and easily measurable; hence, this feature can be used for screening plants for tolerance to water stress (O'Neill et al. Reference O'Neill, Shanahan and Schepers2006; Jangpromma et al. Reference Jangpromma, Songsri, Thammasirirak and Jaisil2010; Zhao et al. Reference Zhao, Sun, Dai, Zhang and Wu2010). The analysis of chlorophyll content is important to assess the vitality or integrity of the apparatus during the photosynthetic process in a leaf (Li et al. Reference Li, Guo, Baumz, Grando and Ceccarelli2006).
According to Torres Netto et al. (Reference Torres Netto, Campostrini, Oliveira and Bressan-Smith2005), the portable chlorophyll meter provides instantaneous readings of the intensity of green leaf (value corresponding to the relative chlorophyll content) without destroying it. Torres Netto et al. (Reference Torres Netto, Campostrini, Oliveira and Bressan-Smith2005) state that SPAD-502 readings below 40·0 indicate the beginning of chlorophyll deficiency affecting the photosynthetic process, and this parameter is considered a good indicator of metabolic shifts in plants under various environmental stress factors.
Under drought conditions, a strong positive correlation was observed in the present paper between the SPAD index and productivity. Silva et al. (Reference Silva, Jifon, Silva and Sharma2007) also found that stalk productivity was highly correlated with the SPAD index in varieties developed with low soil water availability. In a study with barley, González et al. (Reference González, Bermejo and Gimeno2010) found that the highest values of SPAD index and total chlorophyll were directly related to the most productive genotypes under water deficit. Jangpromma et al. (Reference Jangpromma, Songsri, Thammasirirak and Jaisil2010) found positive correlations between the SPAD index and chlorophyll content in sugarcane subjected to two water regimes, with and without water deficit. According to those authors, chlorophyll content assessment using sugarcane SPAD reading is effective in conditions of water deficit, wherein it presents a further correlation between genotypes and chlorophyll content, and is thus considered a good parameter for the selection of drought-resistant genotypes.
Silva et al. (Reference Silva, Soares, da Costa, Viana, Andrade, Gonçalves, Santos, Barbosa, Nascimento, Todaro, Riffel, Grossi-De-Saf, Barbosa, Sant'ana and Ramalho Neto2012) found a positive correlation between SPAD index and photosynthesis in tolerant genotypes under drought conditions in sugarcane, which showed average values equal to or greater than 40·0 SPAD index. According to Silva et al. (Reference Silva, Soares, da Costa, Viana, Andrade, Gonçalves, Santos, Barbosa, Nascimento, Todaro, Riffel, Grossi-De-Saf, Barbosa, Sant'ana and Ramalho Neto2012), the SPAD index is one of the main physiological parameters that must be considered as a priority in breeding programmes for sugarcane for the purpose of obtaining genotypes tolerant to water stress with increased productivity.
Considering the results obtained in the present study, it can be noted that the portable chlorophyll meter can be used to estimate the concentration of photosynthetic pigments in sugarcane leaves, saving time and resources, with good distinction between tolerant and sensitive genotypes to drought.
Susceptible genotypes under dry conditions in the present study showed an increase in LT of 5–6 °C, while tolerant genotypes showed a mean increase of c. 3·5 °C under conditions of water deficit. This confirms the greater leaf cooling capacity in the genotypes considered tolerant, which suggests that the smaller increase in LT contributes to protecting plants from lack of water.
According to Taiz & Zeiger (Reference Taiz and Zeiger2009), in general, the temperature of C4 plants can quickly rise 4–5 °C above the ambient temperature under full sunlight and soil water deficit. The water and temperature stress are related, thus the temperature of actively transpiring leaves is generally lower than the air temperature, but water deficit restricts transpiration and causes overheating and heat stress. The heat stress inhibits photosynthesis and impairs the function of membrane and protein stability.
These effects were also observed by Rodrigues et al. (Reference Rodrigues, Laia and Zingaretti2009), who found greater increases in LT in sensitive sugarcane genotypes during periods of moderate and severe drought. Silva et al. (Reference Silva, Jifon, Silva and Sharma2007) found that the mean LTs of genotypes classified as sensitive and moderately tolerant were c. 37 and c. 35 °C, respectively, and stated that LT is a tool that can be trusted in the selection of sugarcane for drought tolerance.
The increase in LT was associated with a decrease in productivity. Under dry conditions, the highest productivity of the tolerant genotype, TCP93-4245, corresponded to the lowest average temperature during the drought period. This finding suggests that sugarcane growth is affected in plants that do not effectively control LT during a drought. According to Van Heerden et al. (Reference Van Heerden, Donaldson, Watt and Singels2010), higher temperatures limit the growth of sugarcane, stopping the accumulation of biomass in the plant and resulting in lower productivity. Koonjah et al. (Reference Koonjah, Walker, Singels, Van Antwerpen and Nayamuth2006) found that an increase in sugarcane LT caused a decrease in photosynthesis after suspension of irrigation by promoting stomatal closure, which increases LT due to lowered cooling via transpiration, ultimately leading to reduced photosynthesis and productivity.
In the present study, an inverse correlation was observed between LT and the parameters SPAD index, F v/F m and productivity, which shows that water deficit together with high radiation contributed to the increase in LT. This contributed to structural changes in the photosynthetic pigments of the PSII and, possibly, reflected the destabilization of the PSII reaction centre or the decrease in photosynthetic capacity, especially in drought-sensitive sugarcane genotypes. Silva et al. (Reference Silva, Jifon, Silva and Sharma2007) also found an inverse correlation between LT with SPAD, F v/F m and productivity of sugarcane genotypes under water deficit. Therefore, the variable LT is a good criterion to be applied in the selection of drought-tolerant sugarcane genotypes.
In the current study, water deficit stress resulted in significant reductions in RWC in 80 genotypes, especially in the sensitive standard TCP87-3388, where it reached a value of 0·71, while the tolerant standard, TCP93-4245, had a value of 0·87. The progressive RWC decrease in sensitive genotypes of sugarcane subjected to water stress has also been reported by Silva et al. (Reference Silva, Jifon, Silva and Sharma2007), Rodrigues et al. (Reference Rodrigues, Laia and Zingaretti2009) and Sato et al. (Reference Sato, Catuchi, Ribeiro and Souza2010). Maintaining a relatively high RWC during mild drought is indicative of drought tolerance. According to Gorai et al. (Reference Gorai, Hachef and Neffati2010), the precise knowledge of the leaf tissue water status using RWC has a direct physiological response in the quantification of water content in the plant, and this parameter is becoming a key indicator for screening crops to find drought-tolerant genotypes.
The decrease in productivity was directly related to the reduction in F v/F m and RWC variables. The data suggest that with a smaller decrease in RWC, photochemical activity is less affected by water deficit. A similar response was observed by Liu et al. (Reference Liu, Yuan, Zhang, Lei, Duan, Liang and Lin2006) and Silva et al. (Reference Silva, Jifon, Silva and Sharma2007) in sugarcane, and by Paknejad et al. (Reference Paknejad, Nasri, Moghadam, Zahedi and Alahmadi2007) in wheat. Under water deficit conditions, leaf RWC was significantly reduced in most genotypes, and this was associated with decreases in radiation efficiency (F v/F m) and productivity.
According to Kumar (Reference Kumar, Ashraf and Harris2005) and Silva et al. (Reference Silva, Jifon, Silva and Sharma2007), a plant or a group of plants showing better growth and productivity with limited soil moisture than other plants in a given set of similar environments is understood to be tolerant to drought. Therefore, based on the ability to maintain higher F v/F m, SPAD index and RWC, and lower LT under drought conditions in south Texas, the genotypes HoCP91-555, TCP02-4587, TCP02-4617, TSP05-10, TSP05-12, TSP05-13, TSP05-5, TSP05-7, US01-40 and TCP02-4609 were considered drought-tolerant. Owing to the high physiological performance of these genotypes as well as those with outstanding agronomic productivity, they can be recommended for sugarcane-breeding programmes to obtain germplasm and for selection of higher genotypes under drought conditions. The results also demonstrate that sugarcane productivity is strongly associated with the ability to maintain higher levels of physiological function, as measured in the present study by higher values of F v/F m, SPAD index and RWC, as well as lower LT under dry condition during the period of greatest development. These physiological traits also have great potential as selection tools in breeding programmes aimed at improving crop productivity in drought prone environments. Therefore, according to the present results, it is possible to recommend limit values for these physiological variables which might indicate a genotype as tolerant to dry conditions, such as those with the ability to maintain values of F v/F m above 0·76, SPAD index of at least 35, RWC above 0·80 and LT below 36 °C.