One of the enduring legacies of Hurricane Katrina is the mortality and morbidity consequences among residents of nursing facilities (NF) in the Gulf Coast states. The loss of life and lack of emergency preparedness at NFs in the Gulf region has been widely chronicled in the lay press,Reference Hull and Struck1Reference Harris2 research papers,Reference Dosa, Grossman, Wetle and Mor3Reference Brodie, Weltzien, Altman, Blendon and Benson4Reference Franco, Toner, Waldhorn, Maldin, O’Toole and Inglesby5Reference Hyer, Brown, Berman and Polivka-West6 and in several government reports.Reference Root, Amoozegar and Bernard789 For example, 34 residents lost their lives at St Rita's NF in St Bernard Parish, Louisiana, after administrators reportedly declined to evacuate before the storm.Reference Dosa, Hyer, Brown, Artenstein, Polivka-West and Mor10 An additional 22 residents lost their lives at Lafon NF after successfully weathering the storm while they waited for emergency personnel to respond to their needs for restitution of services.Reference Hull and Struck1
Although the response of NF residents to traumatic experiences remains largely anecdotal, there are reasons to believe that they are highly vulnerable to emergencies in terms of subsequent mortality and morbidity. In a 2008 article, Brunkard et al noted that of the 877 confirmed fatalities from Hurricanes Katrina and Rita, 103 (12%) were believed to be NF residents.Reference Brunkard, Namulanda and Ratard11 Intuitively, NF residents also represent a clustered group of individuals at the highest risk for hurricane disaster consequences.Reference Morrow12 Almost half of the adults living in NFs in the United States reside in 1 of the 18 hurricane-prone Gulf and Atlantic Coast states.Reference Harrington, Carillo and LaCava13 NF residents are particularly vulnerable to the consequences of disasters; most have significant functional limitations and many have dementia, significant vision/hearing impairments, or other conditions that compromise their ability to respond appropriately during emergencies.Reference Root, Amoozegar and Bernard7Reference Fernandez, Byard, Lin, Benson and Barbera14Reference Kidder, Rennison and Goldberg15Reference Shaughnessy and Kramer16
These functional impairments limit health reserves, potentially amplifying the impact of disasters and forced relocation.Reference Hyer, Brown, Berman and Polivka-West6Reference Dosa, Hyer, Brown, Artenstein, Polivka-West and Mor10Reference Fernandez, Byard, Lin, Benson and Barbera14Reference Chou, Huang, Lee, Tsai, Chen and Chang17Reference Mangum, Kosberg and McDonald18Reference Semenza, Rubin and Falter19 Using 2005 NF data from the Minimum Data Set (MDS) and Medicare claims data, the intent of this research was to evaluate the 30- and 90-day mortality and morbidity consequences of Hurricane Katrina among residents in the affected areas of Louisiana and Mississippi and to compare those rates against those for residents living in the same NFs during the 2 previous years (2003 and 2004).
METHODS
Data Sources
Before beginning work, the institutional review boards at Brown University and the University of South Florida approved the research protocol. Resident-level data from the MDS for calendar years 2003, 2004, and 2005 from Louisiana and Mississippi were matched to the Medicare denominator files and hospital claims using the Residential History File methodology described elsewhere.Reference Intrator, Berg and Hiris20 The MDS is a federally mandated assessment for all NF residents that includes approximately 400 data elements, including demographics, diagnoses, treatments, and measures of both physical and cognitive functions.Reference Morris, Hawes and Fries21 The Centers for Medicare and Medicaid Services Standard Analytical Files for Part A claims contain information to evaluate inpatient hospitalization, NF use, and hospice, home health, and outpatient services for residents in each cohort.
Subject Sample
An initial exposure cohort of 9383 long-stay NF (>90 days), Medicare-eligible (>65 years old) residents were identified as residing at 1 of 150 hurricane-affected NFs as of June 1, 2005. All of the NFs in the exposure (“at risk”) group were located in affected parishes/counties across Louisiana and Mississippi. These parishes/counties were defined on the basis of their inclusion in the National Weather Service's hurricane watch at 48 hours and the subsequent warning zone at 24 hours before landfall. We also included every NF located in parishes/counties where at least 1 NF was known to have evacuated based on lists provided by individual state NF associations. Finally, we removed all of the NFs from counties/parishes where there were no known evacuations. A detailed explanation of this approach is available from the first author.
The exposed cohort was then compared to nonhurricane-exposed cohorts residing at the same NFs as of June 1, 2003 and June 1, 2004. Methodological exclusions among the initial cohorts were then made for residents residing at NFs who did not contribute data for all 3 years and for residents who could not be matched to their Medicare Denominator File. After these exclusions, a total of 9260 NF residents at 141 NFs remained in the exposed 2005 cohort. Of that total, 7062 (76.3%) residents were located in Louisiana and 2198 (23.7%) were located in Mississippi.
Resident Outcomes
Descriptive characteristics for NF residents (eg, demographics, health characteristics) were obtained from the MDS. MDS measures for cognitive status (Cognitive Performance Scale),Reference Morris, Fries and Mehr22 functional status (Activities of Daily Living [ADL] Scale),Reference Morris, Fries, Morris, Morris, Fries and Morris23 and comorbidity (Changes in Health, End-Stage Disease, and Signs and Symptoms Comorbidity Index)Reference Hirdes, Frijters and Teare24 have been validated independently. The Cognitive Performance Scale score measures cognition from 0 to 6, where 0 to 2 is generally defined as no to mild impairment, 3 to 4 is defined as moderate impairment, and 5 to 6 is defined as severe impairment. The Changes in Health, End-Stage Disease, and Signs and Symptoms Score is an aggregated measure that uses 6 MDS items to create a 5-point scale ranging from 0 (not at all unstable) to 5 (highly unstable). Finally, the ADL scale is a composite scale from 0 to 28 points of 4 ADLs (personal hygiene, toileting, locomotion, and eating), each measured from 0 (no impairment) to 6 (total impairment).Reference Morris, Fries, Morris, Morris, Fries and Morris23
Information on date of death came from the Medicare Denominator File. Using data from Medicare files, the prehurricane period (June 1-August 25), 30-day, and 90-day mortality and hospitalization rates were established for exposed patients in 2005. Although the landfall of Hurricane Katrina occurred on August 29, 2005, a date 4 days prior was selected due to potential mortality and morbidity associated with evacuations that commenced on or after the August 25 date but before landfall. To our knowledge, no nursing facilities were evacuated before the August 25 date. The 2005 exposure group was then compared to control populations residing in the same NFs during the same period of time for 2 different nonhurricane-exposed years (2003 and 2004).
To determine the level of functional decline, the MDS ADL Scale was evaluated comparing the aggregate score (0- to 28-point scale) on the most recently collected MDS for residents before August 25 to the first available aggregated ADL score after landfall of the hurricane. Because MDS collections are required every 90 days (with an allowed grace period of several weeks), surviving residents with available data included in the analysis received a follow-up score within 120 days of hurricane landfall. A reduction of 4 or more points on the 28-point scale was considered a significant functional decline based on work done during the MDS validation process.Reference Phillips, Morris and Hawes25
Statistical Analysis
Differences in the rates of mortality, hospitalization, and ADL decline were determined across the 3 annual cohorts of long-stay NF residents from the same 141 facilities. Outcomes from the 2005 cohort—treated as exposed to Katrina—were contrasted to outcomes from nonhurricane year control cohorts (2003 and 2004). Because all of the outcome variables were defined as dichotomous, χ2 tests of statistical significance were performed to highlight observed differences in each outcome across cohorts. Statistical measurements were conducted using SAS 9.3 (SAS Institute, Inc, Cary, NC).
RESULTS
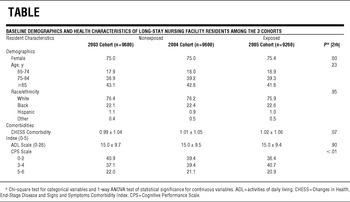
The Table presents the descriptive characteristics of the exposed 2005 cohort compared to the 2003 and 2004 nonexposed groups. A total of 9680, 9600, and 9260 residents were identified among the 141 facilities in the 2003, 2004, and 2005 cohort groups, respectively. As noted in the Table, there were no statistical differences between the basic demographic and clinical characteristics of any of the 3 groups with the exception of cognitive status. There was a mild trend toward patients of moderate levels of cognitive impairment in 2005 and fewer patients of severe or minor impairment.
Baseline Demographics and Health Characteristics of Long-stay Nursing Facility Residents Among the 3 Cohorts

Mortality Rates
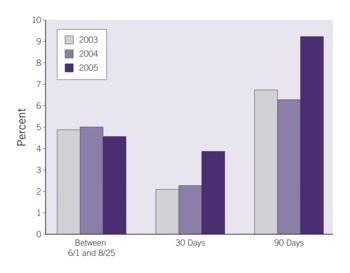
Figure 1 presents the mortality rates among residents in each of the 3 years. As expected, there was no difference in mortality trends in the prehurricane period of June 1 to August 25 (P = .3311). By 30 days later, a total of 359 residents (3.88%) had died in 2005 compared with 203 (2.10%) and 219 (2.28%) residents in 2003 and 2004, respectively. At 90 days, a total of 858 residents died (9.27%) in 2005 compared with 650 (6.71%) and 606 (6.31%) residents in 2003 and 2004. Differences in 30- and 90-day mortality rates were statistically significant (P < .0001) by χ2 analysis.
The Association of Hurricane Exposure on Nursing Facility Resident Mortality

Hospitalization Rates
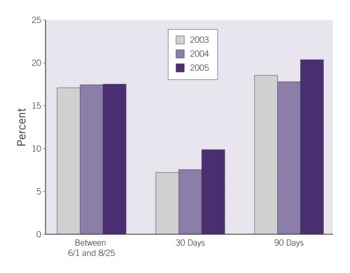
Figure 2 presents the hospitalization rate differences among residents in each of the 3 years. As expected, there was again no difference in hospitalization rates among the 3 groups in the prehurricane period of June 1 to August 25 (P = .7288). By 30 days later, a total of 914 residents (9.87%) had been hospitalized in 2005 compared with 698 (7.21%) and 723 (7.53%) residents in 2003 and 2004, respectively. At 90 days, a total of 1888 residents (20.39%) had been hospitalized in 2005 compared with 1801 (18.61%) and 1711 (17.82%) residents in 2003 and 2004, respectively. Differences in 30- and 90-day hospitalization rates were also statistically significant (P < .0001).
The Association of Hurricane Exposure on Hospitalization Rates Amoung Nursing Facility Residents.

Decline in ADL
A total of 664 residents from the exposed cohort did not have follow-up ADL scores within 120 days of landfall either due to death (125 patients) or absence of follow-up among the survivors (eg, discharge from NF, extended hospitalization, loss to follow-up, or missing data). Among the 8596 residents in the exposure group, a total of 582 residents (6.77%) experienced significant ADL decline (defined as a drop of ≥4 on a 28-point scaleReference Morris, Fries, Morris, Morris, Fries and Morris23) compared with 530 (5.81%) in 2003 and 461 (5.10%) in 2004. The level of significant ADL decline between groups was statistically significant (P < .0001).
COMMENT
This first-of-its-kind study evaluates the effects of Hurricane Katrina on long-stay NF residents living in facilities located in highly affected areas of Louisiana and Mississippi. In all of the cases, the 30- and 90-day mortality and hospitalization rates for residents living in NFs exposed to the storm were considerably higher than for residents living at the same facilities during the same period of time in 2003 and 2004. Even among survivors, there was also a statistically significant decline in functional status.
Perhaps most striking in the data are the significant increase in loss of life at 30 and 90 days. The data for 2005 suggest that 148 additional residents died in the exposed area compared with the mean number of deaths at the same facilities in the 2 preceding years. This translates to a rate of nearly 16 extra deaths per 1000 residents. At 90 days, a total of 230 additional lives (an additional 25 deaths per 1000 residents) had been lost. This excess in the death rate is statistically significant and suggests that greater attention needs to be paid to this high-risk population by emergency preparedness officials to prevent future repetition of this calamity. Among the survivors, the rates of additional hospitalizations were also significant, with 204 extra hospitalizations (22 additional hospitalizations per 1000 residents) at 30 days and 132 extra hospitalizations (14/1000 residents) at 90 days. In addition, 86 extra residents experienced significant functional decline (10/1000 residents) as a result of the storm.
It is noteworthy that several government reports and research papers identified glaring deficiencies in preparedness among NFs after the 2005 storms.Reference Dosa, Grossman, Wetle and Mor3Reference Root, Amoozegar and Bernard789 Although there is some evidence that preparedness in NFs has improved since 2005,Reference Blanchard and Dosa26 future work needs to be conducted to identify whether fewer deaths occurred with larger-scale evacuations conducted for Hurricanes Gustav and Ike during 2008.
Although this study did not examine differences in mortality and hospitalizations between evacuating and nonevacuating NFs, the question of evacuation remains a critical concern for future research.Reference Dosa, Hyer, Brown, Artenstein, Polivka-West and Mor10 Further examination is needed to determine whether the additional mortality and morbidity reported in the present article are associated with the stress of the storm, the decision to shelter in place, the trauma of evacuation, or the special circumstances of poststorm flooding that occurred in New Orleans after this specific hurricane. Future research should also consider whether some of the additional mortality and morbidity reported here was differentially associated with certain nursing facility characteristics (eg, nonprofit vs for-profit ownership, individual vs chain). Regardless, interventions encouraging better preparedness and response activities are needed to improve mortality and morbidity for future storms.
There are several limitations to this research. First, the geographic region outlined in this study was intended to capture the effects of Hurricane Katrina. Although this intention largely removed western Louisiana counties affected primarily by Hurricane Rita (landfall September 24, 2005 on the Texas–Louisiana border) from the analysis, it is impossible to know whether some of the mortality and morbidity beyond 30 days occurred as a result of the second storm. Second, it is well known that there are yearly differences (eg, differential influenza rates) that account for differences in annual mortality and morbidity rates. Although unlikely (because of similarities in the prestorm data), it is infeasible to ascertain that something else may have prompted the additional mortality and morbidity during 2005. Finally, the increases in mortality and morbidity identified in the present article are also in part associated with the regional disruption in the health care system that occurred after Hurricane Katrina. Distinguishing between how much of the mortality and morbidity was related to the storm and how much was related to the disruption in health care that followed is not possible. Further studies identifying the differential effects of evacuating vs sheltering in place are therefore needed to tease out some of these questions.
CONCLUSIONS
It is clear that Hurricane Katrina was a sentinel public health event that has precipitated a reevaluation of how emergency preparedness efforts are carried out. Among vulnerable NF populations, the effect of the 2005 storm on loss of life, hospitalizations, and decline in functional status was substantial. More public health attention needs to be paid to NF populations in the future to prevent recurrence of these tragic events.
Funding Sources: Funding for the present study was provided by the National Institutes on Aging (RO1AG030619-01A2) and the Department of Veterans Affairs (VA Grant number CDA 08-280).
Authors' Disclosures: The author reports no conflicts of interest.