1 Introduction
1.1 The concept of approximant
The term approximant was defined for the first time by Peter Ladefoged in 1964, in his Phonetic study of West African languages, in a rather complex way: a ‘sound that belongs to the phonetic class vocoid or central resonant oral, and simultaneously to the phonological class consonant in that it occurs in the same phonotactic patterns as stops, fricatives and nasals’ (Ladefoged Reference Ladefoged1964: 25). The idea that these sounds had to be central was soon abandoned; consequently lateral sounds could also be considered approximants. In 1975, Ladefoged redefined an approximant as ‘an articulation in which an articulator is close to another but without the tract being narrowed to such an extent that a turbulent airstream is produced’ (Ladefoged Reference Ladefoged1975: 292). That is, for a sound to be an approximant two conditions must be satisfied: (i) the articulators have to be close together, and (ii) no turbulent airstream should be produced. The first condition contrasts approximants with stops, which require a complete closure, and the second one with fricatives, which require a turbulent airstream. Approximants, therefore, are neither plosives nor fricatives. Moreover, Ladefoged gives this new definition exclusively in phonetic terms, avoiding any reference to phonology. When the class of approximants is illustrated with English sounds, the segments [j w l r] are included, that is, semivowels and liquids.
In 1979, the International Phonetic Association introduced the term approximant into its phonetic chart and, along with the corresponding symbols, approved the use of the diacritics for lowered articulation ([ ] or [
 ]) under the symbol of any voiced fricative to mark approximant articulation. The latter, known as ‘tiny T’, is the only diacritic remaining since 1989. Nonetheless, there is no general agreement within the Association, that the category of approximants contains a set of subclasses. Currently, the Association itself (IPA 1999) has separated lateral approximants from other approximants, but the subclasses of semiconsonants (or semivowels), rhotic sonorants and non-rhotic obstruent consonants are all mixed in under approximants on the pulmonic sounds chart with no distinction made among them. From a general phonetics standpoint, including the semivowels in the set of consonants is rather contradictory in and of itself.
In a recent article published in the Journal of the International Phonetic Association, Martínez-Celdrán (Reference Martínez-Celdrán2004) presents a solution for all these contradictions. He postulates that approximant is a super-category that includes lateral and rhotic sounds, semivowels, and a set of obstruent consonants such as [ 

 ] that have no specific name, and for which the author proposes the label spirants, following Martinet (Reference Martinet1956). In Martínez-Celdrán's article a new definition for approximants is proposed, because in some studies there is evidence that the difference between fricatives and approximants does not actually lie in a different degree of articulatory stricture. Romero (Reference Romero1995: 130) asserts that ‘there is no reliable difference in constriction degree between fricatives and [spirant] approximants’. In fact, the true difference lies in tension. Martinet (Reference Martinet1956) already said that spirants are lax articulations, whereas fricatives are firm (tense). Ladefoged & Maddieson (Reference Ladefoged and Maddieson1996) avoid dealing with tension, though they mention that fricatives have a higher degree of articulatory precision than plosives. And we may add that approximants have a lower degree of precision than plosives. Thus, all of these data allow for a new definition of this large class of sounds:
Approximants are segments that, having a certain degree of constriction, lack the required articulatory precision to produce a turbulent airstream, either because they lack the needed amount of tension of articulators or because the vocal tract is not constricted enough, or both.
This definition enables us to consider both open and closed segments as approximants. In so doing, open approximants, still having a certain degree of constriction, will closely resemble vowels, but they will differ in their lower intensity and shorter length. As closed approximants will not have the required tension, they will lack not only the turbulent airstream which is to be found in any fricative but also the release burst typical of stops. And it is this absence of burst what makes those sounds approximants ‘when the oral closure is released in the offset phase of an oral stop, the compressed air escapes to the atmosphere with a small but audible explosion, sometimes referred to in the acoustic phonetic literature as the stop burst’ (Laver Reference Laver1994: 205). Furthermore, Hayward (Reference Hayward2000: 179) adds that ‘the voice bar is darker at the beginning than at the end of the constriction interval. This reflects a general tendency for voicing to weaken and become more breathy in character over the course of the interval’. This feature is absent in the voicing bar of closed approximants (see figure 5 below for a spectrogram of a closed velar approximant in intervocalic position that does not have burst or the above-mentioned ‘tendency for voicing to weaken’). From an articulatory viewpoint, Catford (Reference Catford1977: 118) notes that ‘there is a continuum of possible degrees of openness running from the complete, tight, closure of a stop like [p] or [b]’. In the current work the adjective ‘tight’ is crucial in that a closed approximant might have the articulators very close together, or even closed, but never ‘tight’. Moreover, there is no perceptual difference between closed and open approximants. Therefore, phoneticians agree on a full closure for stops and, as Catford states, on a tight closure, which prevents degrees of openness. However, approximants do have several degrees of openness, making the distinction between closed and open approximants possible. Fricatives do not have several degrees of openness, either, if turbulences are to be produced. By contrast, there exist various degrees of turbulence – i.e. sibilant or strident sounds, a binary feature as outlined by phonologists, yet a gradual feature phonetically (Laver Reference Laver1994: 260). That possibility of establishing degrees of openness allows for the depiction of approximants as a prototypical category (Taylor Reference Taylor1989), whereby the so-called open approximant is the prototype, while the closed approximant is on the boundary with stops.
1.2 The aim of our work
As is well known, in the passage from Latin to Western Romance (therefore to Galician and Spanish) ‘an interrelated series of consonantal changes, sometimes described as “weakenings” and referred to by the name lenition’ happened (Penny Reference Penny1991: 65): intervocalic voiceless plosive consonants became voiced, while geminated consonants were simplified and voiced plosives turned into spirant approximants. Lleal (Reference Lleal1990: 239) concisely describes these changes for medieval Spanish:
Por una parte, las aproximantes, derivadas de interruptas sonoras en posición intervocálica, se relajaron y tendieron a desaparecer [pedónes > peðónes > peónes]. Por otra, y algo más tarde, se produjo la relajación de las interruptas sonoras, derivadas de las interruptas sordas latinas en posición intervocálica [amátis > amátes > amádes > amáðes]. [On the one hand, approximants, derived from intervocalic voiced stops, relaxed and tended to disappear [pedónes > peðónes > peónes]; on the other, and some time later, the relaxation of voiced stops, which came from Latin intervocalic voiceless stops, took place: [amátis > amátes > amádes > amáðes].]
Similarly, from Latin amicu, lupu, natu, we find in current Galician [aˈmi ʊ], [ˈloʊ], [ˈnaʊ].
As a result, current Spanish and Galician have spirant approximants that come from Latin intervocalic plosives (Martínez-Celdrán Reference Martínez-Celdrán1991, Reference Martínez-Celdrán2002: 45f., 49; Regueira Reference Regueira1998: 45–47, Reference Regueira1999; Martínez-Celdrán, Fernández-Planas & Carrera-Sabaté Reference Martínez-Celdrán, Fernández-Planas and Carrera-Sabaté2003). Catalan behaves in a similar way (Carbonell & Llisterri Reference Carbonell and Llisterri1999; Solà et al. Reference Solà, Lloret, Mascaró and Pérez-Saldanya2002: 77–80). This aspect of European Portuguese is not so well known, although several descriptions confirm that these consonants in intervocalic position are ‘oclusivas imperfeitas ou espirantes’ [imperfect stops or spirants] (Barbosa Reference Barbosa1994: 60; cf. Mateus Reference Mateus, Faria, Pedro, Duarte and Gouveia1996: 185f.; Cruz-Ferreira Reference Cruz-Ferreira1999), such as in Portuguese gaðu ‘cattle’, gaˠu ‘stutterer’.
In some Galician dialects this change proceeds to the loss of [] (from Latin -t-) in some contexts, as in:
pratu > [ˈpɾado] > [ˈpɾa
 o] > popular Galician [ˈpɾao] ∼ [ˈpɾa], Eastern Galician (and Asturian) [ˈpɾaw] ‘meadow’
latu > [ˈlado] > [ˈla
o] > popular Galician [ˈla] ‘side’ (cf. Instituto da Lingua Galega 1999: 297)

The loss of this consonant is very common in Asturian (Academia de la Llingua Asturiana 1999: 44f.). In most dialects of Peninsular Spanish it is also usual in some contexts, especially in Andalusian (Zamora Vicente Reference Zamora Vicente1967: 316f.; Narbona, Cano & Morillo Reference Narbona, Cano and Morillo1998: 76), even in Castilian varieties with some prestige, as the Castilian spoken in Valladolid (Williams Reference Williams1987: 65–79):
nata > [ˈnada] > [ˈna
a] > [ˈna] ‘nothing’-atu > [-ado] > [-a
o] > [-a] (> [-aw]), especially in participles, as cantado (> cantao) ‘sung’, etc.
This process generates variation in current Spanish between forms with [] and forms where this approximant has already disappeared, through intermediate degrees of openness (cf. Williams Reference Williams1987: 68), from a closed approximant, close to stops, to a vocalic, very open, approximant, which would be the last step before its complete loss, following the ‘model of diachronic variation’ proposed by Penny (Reference Penny2000: 3f.).
Our work focuses on the acoustic study of the realizations of these approximants in current Galician. Furthermore, we think that the facts shown here represent not only the state of these consonants in Galician but in most Iberoromance dialects.
Spanish phoneticians traditionally classified these consonants as fricatives. It should be noted that under this label there is an underlying stipulation: every consonantal sound that is not a stop shall be fricative. There are no intermediate categories, and whether they show a turbulent airstream is not taken into account. Indeed, Navarro Tomás, much later than the publication of his 1918 Manual (Navarro Tomás Reference Navarro Tomás1918), did take into consideration turbulence, which he called rehilamiento (Navarro Tomás Reference Navarro Tomás1934); then he divided fricatives into rehilantes and arrehilantes. He stated: ‘en la acepción fonética de rehilar comprendemos asimismo juntamente con la vibración que estremece los órganos, no sólo de la laringe, sino en el punto de articulación, y el efecto acústico que de esto se deriva’ [in the phonetic sense of the word rehilar we also mean both the vibration that shakes the organs, not only of the larynx, but at the point of articulation, and the resultant acoustic effect] (Navarro Tomás Reference Navarro Tomás1934: 276). When talking about rehilamiento he is clearly referring to what is currently called turbulent airstream. In this article, by means of the rehilamiento he is able to distinguish what he calls fricative [đ] from voiced fricative [ð] in words like dadme ‘give (you-pl.) me’ and hazme ‘make (you-sg.) me’, respectively. Following his terminology, the first sound is arrehilante and the last one rehilante. Currently, the term fricative is only common for segments with rehilamiento (hazme) and approximant for those without (dadme).
Since the Galician language was excluded from the public domain until the last quarter of the 20th century, the research on Galician phonetics started late with respect to Spanish phonetics (Spanish being the official language), and was grounded directly in the Spanish phonetic tradition. Thus, in the phonetic descriptions of Galician, the term ‘fricative’ was widely adopted for [ ] (see, among others, Porto Dapena Reference Porto Dapena1977: 31f.; Taboada Reference Taboada1979: 45–47; Álvarez, Monteagudo & Regueira Reference Álvarez, Monteagudo and Regueira1986: 25). As a sole exception, Veiga (Reference Veiga1972: 281–291, reprinted in Veiga Reference Veiga1976: 99–101) refuses to classify these sounds as fricatives, and asserts that ‘[s]e trata simplemente de una realización menos tensa de la oclusiva sonora’ [it is simply a less tense articulation of the voiced stop], although he only gives arguments of a phonological nature, based on his own conception of a hierarchical system of phonological oppositions: ‘Que las realizaciones débiles [– b] [– d] [– g] corresponden a fonemas oclusivos sonoros lo prueba el hecho de que la oposición oclusivo / fricativo es previa a la sonoro / sordo’ [The fact that the lax articulations [– b] [– d] [– g] correspond to voiced plosive phonemes is proved by the fact that the opposition plosive/fricative comes before voiced/unvoiced] (Veiga Reference Veiga1972: 282); that is, this argument is dependent on his own framework of phonological representations.
Taking all this into account, it was only after the publication of Martínez-Celdrán's work in 1991 about the Spanish phonetic realizations for /b d ɡ/, when this tradition was abandoned and the corresponding sounds in Galician began to be described as approximants (despite this notion having already been introduced in Hispanic phonetics in Martínez-Celdrán Reference Martínez-Celdrán1984a: 170f.). In later studies, the term ‘approximant’ for [ ] enters general use (cf. Freixeiro Mato Reference Freixeiro Mato1998: 139; Regueira Reference Regueira1998: 45–47; Álvarez & Xove Reference Álvarez and Xove2002: 40; Martínez-Celdrán Reference Martínez-Celdrán2002: 82f.). This practice is, however, criticized by Alexandre Veiga (Reference Veiga2003), in the wake of Veiga (Reference Veiga1972).
In Galician the spirant approximants [ ] are allophones of the respective voiced phonemes, and they show up in any position except after a pause and after a nasal (and for the dental consonant, after a lateral as well), usually where plosive articulations are found. First of all, we have to determine if, in the positions where approximants are expected, the sounds that actually occur are always approximants or if other articulations are also found. Our purpose is to study the acoustic characteristics of the Galician spirant approximants [ ] and to determine whether they are open or closed. In Galician there is also a palatal approximant [], as a result of the delateralization of the palatal [ʎ], but it was excluded from this study because it only appeared in very few files.
Furthermore, this paper aims at providing data that support the categorization proposed by Martínez-Celdrán (Reference Martínez-Celdrán2004). As his proposal was based mostly on Spanish data, it is interesting to see whether his classification can be extended to other related languages. More importantly, we present quantitative evidence supporting the original proposal. The paper concludes with a critical analysis of the use of discrete categorization in phonetics, and a sketch of a proposal suggesting that the class of approximants is structured as a prototypical category.
Thus, the present study is intended to provide an insight into the nature of phonetic variation of Galician obstruents, in addition to offering data that determine and characterizes a lesser-known phonetic category in general phonetics, namely spirant approximants. The notion that spirant approximants are still little known is supported by a recent book: ‘the concept “approximant”, which is not widely used in the phonological literature, is a broader category that includes glides and liquids. The phonetics literature tends not to use the term “glide”’ (Odden Reference Odden2005: 31). Next, in the book's Glossary the term ‘glide’ is equivalent to ‘semi-vowel’, hence ignoring the sub-category of spirant approximants [ ].
2 Method
2.1 Speakers and recording
All tokens were taken from conversations in casual speech with three young women having Galician as their first language and coming from three different places in Galicia. All conversations were recorded on digital tape with a Sony TDC-D10-PROII. The first recording belongs to the Phonetics Laboratory of the Institute of Galician Language and was taken in 1997 of an 18-year-old university student in Esteiro, Muros (region of A Coruña);Footnote 1 the two other recordings were made by the authors in 2004 of two university graduates, one from Xermade (Lugo) and the other from Oímbra (Ourense), who were 25 and 35 years old, respectively. These three speakers were chosen because they are native to rural or semi-rural areas that have remained basically monolingual in Galician, so the Galician spoken by them is only slightly influenced by contact with the Spanish language (although this contact does exist, particularly through school and college curriculum), because they speak different geographical varieties of Galician, and because of their similar level of education. Therefore, in our view, the language spoken by these young women can be taken as representative for the language of young educated Galician speakers who preserve the phonetic characteristic of Galician.
2.2 Spectrographic images: categories and subcategories
The figures displayed here are samples of the different categories in which we have classified the realizations of /b d ɡ/ in the contexts where approximants were expected: spirant approximants, stops and fricatives.
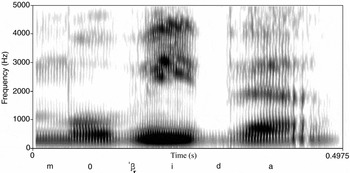
Some examples show an intervocalic stop, with a visible release burst, as can be seen in figure 1.
Image of an intervocalic stop.

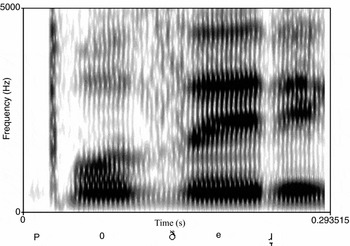
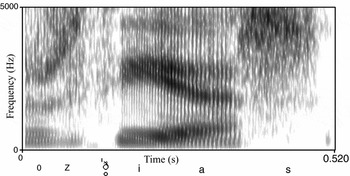
In figure 2 two images of fricatives are shown. The first one (Figure 2a) occurs in intervocalic position. Although this is certainly a very uncommon case, it is still possible, probably because of a certain emphasis when uttering this word. More commonly, instead of the approximant sound, another fricative is found after an alveolar fricative. In the second image (Figure 2b), the preceding alveolar fricative gets voiced [z] and, in contrast, the following dental fricative [ ] gets devoiced. Note the different degree of sibilance, which is far stronger in the first fricative than in the second one.
Image of a voiced fricative.

Image of a devoiced fricative.

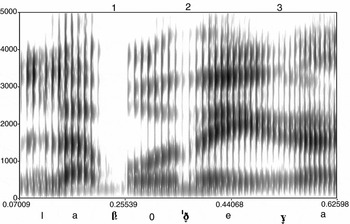
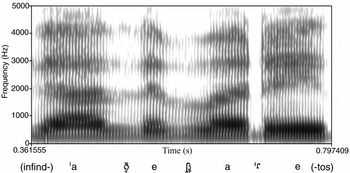
All remaining examples show spirant approximants. Before we proceed, consider the different approximants represented in figure 3, which shows a spectrogram of the Spanish sequence la bodega ‘the cellar’.
Spectrogram of the Spanish phrase la bodega ‘the cellar’; numbers mark the spirant approximants.

As can be seen in figure 3, the three approximants show different spectrographic images. The first one (number 1) is a closed approximant because it lacks glottal pulses above the sonority bar. We classified this sound as approximant, and not as plosive, because it has no release burst (cf. figure 1). Numbers 2 and 3 are open approximants, with different degrees of openness. The most open one (number 3) was classified as spirant approximant (and not vocalic) because of its difference in intensity with respect to the surrounding vowels, as can be seen in the spectrogram. Thus, the category of spirant approximants emerges as a continuum of openness, in which we have distinguished three main degrees: closed, open and vocalic approximants.
Back to the Galician examples, we will illustrate these three degrees of openness. figure 4 shows the prototypical image of open spirant approximants; that is, those which show a formant structure as a transition between the adjacent vowels. They have weak glottal pulses and a shorter duration than the neighbouring; and there are no traces of noise on the spectrogram. We have measured duration and intensity since they are the two most relevant acoustic parameters to define these segments.
Image of open spirant approximants.

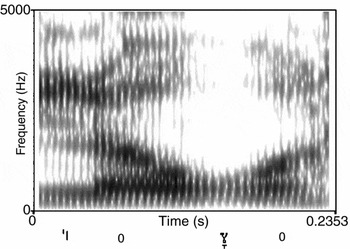
In figure 5, a typical closed spirant approximant ([]) is seen. As a distinguishing characteristic it shows some very weak glottal pulses above the voice bar, pulses which often disappear. This closed approximant differs from stops in that it has no release burst. From an articulatory point of view, the organs might be closed but without any pressure being exerted between them, which prevents the burst; sometimes this closure is very short and some rests of pulses appear at both sides.
Image of a closed spirant approximant.

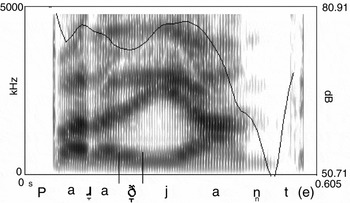
Lastly, in figure 6, there is what we have called a vocalic spirant approximant. It is extremely difficult to segment, as the borders with the neighbouring vowels are very fuzzy. The approximant is clearly audible, despite its lack of a defined shape. Only F1 serves as a guide to where its borders might be. Apart from the spectrogram, figure 6 also shows the intensity curve that can help recognize the approximant.
Image of a vocalic spirant approximant.

Thus, spirant approximants are arranged as a continuum, where we differentiate three main realizations, with fuzzy boundaries, by their spectrographic image: closed, open and vocalic. As we will see, the distinction between closed and open spirant approximants is justified by statistically significant differences in duration and intensity (see tables 8, 9 and 12 below). That does not mean that we conceive open and closed spirant approximants as different categories of sounds. On the contrary, we will argue that these are two subtypes of the same category, that of spirant approximants, conceived as a prototypical category. We will defend the position that the prototype is the open approximant because it is by far the most frequent realization, and because of its centrality on a scale whose ends are closed approximants, next to plosives, and vocalic approximants, next to vowels.
2.3 Measurements
The software used for our analysis was the SIL Speech Analyzer 2.6, a commercial and much improved version of the free 1.5 version that can be downloaded from the website of the Summer Institute of Linguistics (www.sil.org). However, the figures shown above were taken with Praat 4.2 software (www.praat.org).
One hundred words from each speaker were analyzed, for a total of 300 audio files. In 244 (81.3%) of them, the analyzed consonant was preceded by a vowel (V), in 33 (11%) by /s/ and in 23 (7.7%) by a liquid. Some files were disregarded because the approximant sound was not clearly audible as it was either not pronounced or fully vocalic – about 15% for each speaker. We replaced those disregarded files by others, where the approximant, stop or fricative was clearly recognizable both visually and auditorily, thus maintaining a 100-word file for each speaker.
Besides measuring the duration of the analyzed sound, we measured the duration of the whole group formed by the scrutinized consonant and the sounds that surround it (C1/V+C+C2/V, where C1 stands for an /s/ or a liquid, and C2 just for a liquid; V can represent any vowel). The duration of the whole group will serve to standardize the duration of the consonant and to compare different utterances by the same speaker (whose speech rate varies in spontaneous speech) and also the utterances between speakers. In the results table we have put the absolute and relative duration values; it is the relative duration (the percentage of the duration of the whole group taken by the analyzed consonant) which permits us to make reliable comparisons.
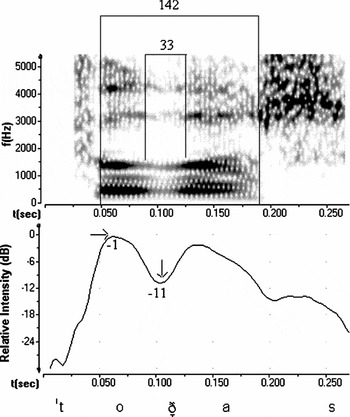
The intensity of the consonant and of the preceding vowel or consonant has been measured. Since these absolute values can vary, the difference in intensity from the first sound in the sequence to the analyzed consonant gives a relative value that, once again, allows for valid comparisons across utterances. Intensity values are always negative because the software allows for 0 dB as the highest value without sound distortion; therefore the more intensity a sound has, the closer its value will be to 0, and vice versa (see figure 7).
Analysis sample with Speech Analyzer 2.6. At the top, a spectrogram in which the duration for VCV (142 ms) and for the approximant (33 ms); at the bottom, the overall intensity curve: −11 dB for the approximant, and −1 dB in the preceding vowel.

The database of the statistics software SPSS 11.5 includes the speaker involved, the point of articulation of the analyzed sound, its open or closed character, and the category in which it is classified. These categorizations follow the visual taxonomy introduced above, based on spectrographic images. The position of the analyzed consonant in relation to stress was also recorded given that it could account for some differences in duration or intensity. In this way we intended to control all the variables that can exert some influence over the targeted sounds.
3 Results
3.1 Desciptive statistics
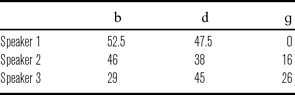
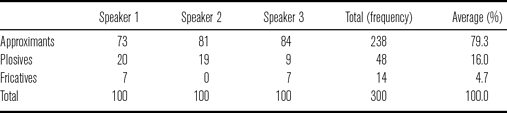
Tables 1–3 give an overview of the analyzed sounds. Speaker 1 pronounces the gheada (a process by which some dialects substitute the sounds [ɡ] and [] by a voiceless pharyngeal [ħ] or velar [x] fricative), and for that reason she pronounced no velar approximant. A lower number of velars is found in the two other speakers, especially in speaker 2, where bilabials are the most frequent. By contrast, dentals are the most common in speaker 3.
Percentage of analyzed sounds by speaker.

Number and percentage of sounds by categories.

Number and percentage of spirant approximants.

In table 2, as the scrutinized context is where approximants appear according to traditional phonetic descriptions, these sounds are here preponderant, with a 79.3% occurrence rate. Stops appear next at a significant rate of 16%, whereas that of the remaining categories is very low.
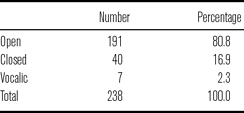
As shown in table 2, in the 300 files analyzed, 238 approximants were found; of these, 191 (80.8%; table 3) correspond to open spirant approximants, i.e. to approximants which show striations of glottal pulses above the voice bar, and 40 (16.9%) to closed spirant approximants, which show just the voice bar and often some very weak remnants of glottal pulses as well, of course with no release burst. As was previously mentioned, when the examined sounds have a fully vocalic character it becomes impossible to analyze them in the referred manner; so the percentage of reported cases, 2.3% in table 3, stands for some samples that could be segmented after some acoustical cue. However, vocalic spirant approximants are really an insignificant number (7, 2.3%) and, in general, we will not take them into account in later statistics.
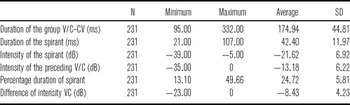
Although all data are displayed in table 4, bear in mind that the most significant values are the relative ones: the duration of the spirant approximant equals 24.72 % of the whole group of preceding sound + spirant + following sound. The same is true for intensity, for which the significant value is a difference of –8 dB between the approximant and the preceding sound (which means that the spirant has an average of 8 dB lower than the preceding vowel or consonant).
Descriptive statistics for open and closed spirant approximants.

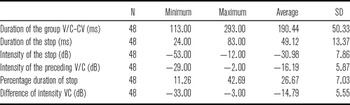
Relative duration has increased to 26.67% (table 5), and the stop intensity has dropped to 15 dB lower than the preceding vowel, both of which are to be expected since these sounds show no glottal pulses above the voice bar across their realization. That represents a negative difference of 7 dB with respect to spirants, which is a significant drop in intensity.
Descriptive statistics for stops.

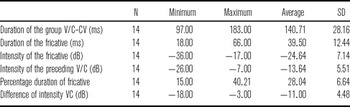
As shown in table 6, fricatives are longer than the two preceding categories as their duration reaches 28.04%. Here, relative duration is much more significant than absolute duration; following the absolute length of these sounds, fricatives are shorter than approximants (39.50 ms compared to 42.40 ms, respectively), but the percentage data show that, whereas fricatives account for 28.04% of the duration of the sound group, approximants account for just 24.72%; i.e., approximants are 3.32% shorter than fricatives in relation to the group in which they are pronounced. Regarding intensity, fricatives show an intermediate value; turbulent noise has a lower intensity than glottal pulses, but higher than when glottal pulses are absent.
Descriptive statistics for fricatives.

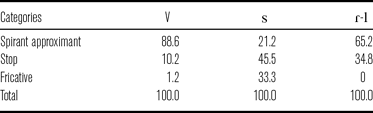
Table 7 shows the relation between the context and categories of sounds. After /s/, stops and fricatives are the most common sounds, but approximants represent 21.2% of the occurrences. Consequently, and despite their lower percentage, they must also be considered in this context. This table also shows to what extent stops and fricatives are possible after a vowel and that the fricative sound does not occur after a liquid. The context immediately following the spirant was not considered because it was found to be irrelevant.
Percentage of each category by preceding segment.

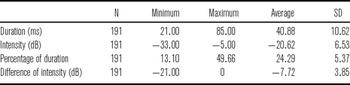
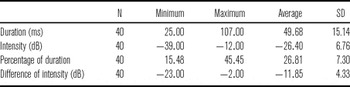
Concerning the differences between open and closed spirant approximants, the four main parameters are shown in the tables 8 and 9. By comparing tables 8 and 9 we can infer that closed spirants are closer to stops in duration, reaching 26.81% (26.67% for stops), but some remnants of glottal pulses prevent a very sharp fall in intensity (−12 dB, approximately). Thus, the differences are clear: open spirants show a shorter length (24.29%) and, above all, a higher intensity (some 4 dB); that is, the fall in intensity from the preceding sound is 4 dB less. By comparison, a fall of 7 dB is found for stops. These differences are not bound to context, since after vowels both kinds of spirant approximants can be found without any significant difference (except those owing to speech emphasis). The significance of the differences in duration and in intensity will be tested in the following section (table 12).
Descriptive statistics for open spirant approximants.

Descriptive statistics for closed spirant approximants.

3.2 Inferential statistics
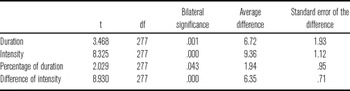
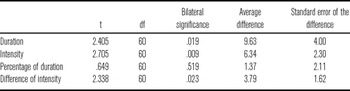
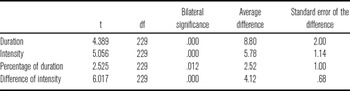
Tables 10–12 show the results for the Student's t-test, which demonstrate the existence of significant differences in the bilateral comparison between the scrutinized categories and subcategories.
T-test between spirant approximants and stops.

T-test between stops and fricatives.

T-test between open and closed spirant approximants.

Assuming equal variances, these differences are significant because the probabilities for every consonantal parameter considered are lower than 0.05. The percentage of duration is the parameter which comes the closest to this number, although it still remains below it. Intensity, thus, is clearly the most significant value, since its probability is less than 0.001 in both cases (absolute and relative intensity).
Spirants and fricatives show significant differences regarding the parameters of duration and intensity. Assuming equal variances, the percentage of duration shows a significance of 0.041 and the difference in intensity reaches a significance level of 0.029, which is sufficient to guarantee the distinctive nature of spirants vs. fricatives. Santagada & Gurlekian (Reference Santagada and Gurlekian1989) have suggested that zero crossings allow measuring the quantity of noise and, consequently, the difference between approximants and fricatives. However, in the present study, we did not consider this measurement, as previous investigations on Spanish (e.g. Martínez-Celdrán Reference Martínez-Celdrán1984b) have shown that duration (Romero Reference Romero1995) and intensity suffice to distinguish those consonants. Additionally, the absence/presence of noise in the spectrogram is a determinant for consonant recognition/identification.
The percentage of duration is not significant (p = 0.519). Once again, intensity is the parameter with the largest differences.
As shown in table 12, there are significant differences in any parameter between open and closed spirants, which indicate that they are two types of approximants.
Although we do not include comparative tables here, we have found significant differences (p = 0.003) in intensity between closed spirants and stops; on the contrary, in duration there are not significant differences. And of course, the differences between open spirants and stops are very large for every parameter.
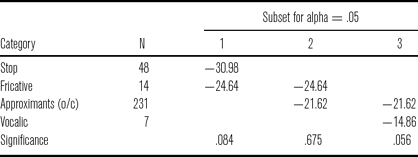
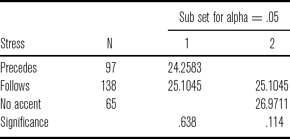
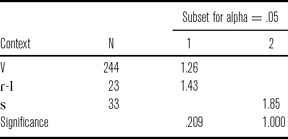
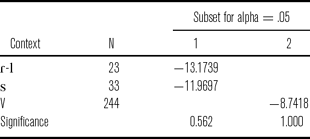
Next, ANOVAs were computed on the four parameters studied. The percentage of duration shows no significant differences (F = 2.56, df = 296.3, p = 0.055). But the rest of the parameters do. After the multiple comparisons of the Scheffé's test, homogeneous subsets are shown. Of particular interest are some of the referred subsets displayed in tables 13–16.
Subsets by differences in consonant intensity.

Subsets by percentage of duration, according to stress position.

Subsets by openness according to the segmental context.

Subsets by intensity differences according to the context.

In table 13, SPSS constitutes three subsets: (i) stops and fricatives, (ii) fricatives and open and closed spirant approximants, and (iii) open and closed spirant approximants and vocalic ones. For the differences in duration, the same three subsets are formed.
The intermediate position of fricatives regarding intensity was already mentioned above. Vocalic spirant approximants were not dealt with in detail because they are few in number and those that exist seem to be interchangeable with open spirants, as no significant parameter was found between open and vocalic spirants. Indeed, vocalic spirants can be regarded as the last degree of open spirants.
In table 14, only two subsets were found. When stress follows the analyzed consonant, irrespective of its category, the percentage of duration participates in both subsets, i.e., there are no duration differences related to the fact that stress precedes or follows the consonant. Differences were found only between stress in the preceding position and no stress at all, neither preceding nor following. Intensity does not produce significant differences, neither does accent concerning openness or category. So we conclude that stress position is not a determining factor of the features of these sounds.
Now the contextual variables will be analyzed (table 15). Whereas V and /ɾ-l/ favour the presence of approximants, /s/ triggers the production of a non approximant sound immediately following /s/ in most occurrences. According to the context, two groups are formed in category as well as in openness: V and /ɾ-l/ show no differences and they behave as if they were the same context. But /s/ is a clearly different context.
Context is also related to differences in intensity. V is separated from the set of consonantal contexts, as shown in table 16.
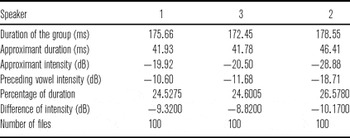
Finally in this section on results, the corresponding ANOVAs show that there are no significant differences between the three analyzed sounds according to their place of articulation (bilabial, interdental and velar). Likewise, no differences were found between the three speakers in relation to the relative values concerning duration or intensity. With regard to the absolute values, speakers 1 and 3 show no differences, but they differ in comparison with speaker 2. Thus, according to the data in table 17, this seems to indicate that speakers 1 and 3 used approximately the same speech rate and loudness and that speaker 2 had a lower speech rate and loudness than the other two.
Average data for each speaker.

4 Conclusions
The acoustic techniques and the statistics allow us to deal with phonetic data on a continuous scale. Tradition, grounded on Aristotelian logic, assumed that after a pause and after a nasal the allophones for /b d ɡ/ (as well as the allophone for /d/ after /l/) were stops, and fricatives elsewhere. As explained in the introduction, this label was replaced by the more appropriate term approximant, following current phonetic descriptions. Aristotelian logic imposes discrete entities; therefore, in some contexts we should have stops and in others approximants. However, phonetic reality is not discrete but gradual both at the context and categorical levels. Based on this, open spirant approximants might be considered as the centre of category and closed approximants as being on the boundary with stops, whereas vocalic approximants are located on the boundary with semivowels or vowels.
The data presented here show that tradition was wrong in a particular context: after the alveolar fricative /s/. As we have shown, mostly stops and fricatives instead of the expected approximants are found; so the traditional assertion might be corrected to state that after a pause, nasal and /s/ no approximants are pronounced. However, once again this statement is too categorical, as approximants can also occur in this context (indeed, 21.2% of the analyzed sounds in this context are approximants, see table 8 above). We have further shown that stops and fricatives can also occur after vowels, although their occurrence is infrequent. After vowels, spirant approximants appear in the majority of the occurrences (88.6%), with stops (10.2%) and fricatives (1.2%) showing up much less frequently (table 8).
In short, spirant approximants have the shortest duration and highest intensity of all the categories of sounds in the 300 voice files we analyzed. Their duration was measured at 42.40 ms (24.72% of the sound group), and their intensity at –22 dB, which represents a difference of 9 dB with respect to stops, the segments with the lowest intensity. These features match those previously described for the approximants of Castilian Spanish (Martínez-Celdrán Reference Martínez-Celdrán1984b: 107).
Furthermore, three kinds of spirant approximants were distinguished: more open spirants, which represent 80.8% of the total number of spirants (duration 40.88 ms, or 24.29% of their sound group, and intensity –21 dB); more closed ones, which represent 16.9% of occurrences (duration 49.68 ms, or 26.40%, and intensity –26 dB), and the vocalic ones which represent the remaining 2.3%. Closed spirants are more like stops, but without a release burst. Open spirants are featured by their shorter duration and higher intensity.
We can represent the different types of approximants on a scale of openness, with their relative frequencies, as in figure 8.
Scale of spirant approximants.

The centrality of the open spirant approximants in the category of approximants (clearly distinct both from plosives and from vocalic sounds) and their frequency of occurrence are arguments to defend the prototypical role of the open spirant approximants.
All these features described above determine and characterize the phonetic category we called spirant approximants, which to date have barely been accounted for in general phonetics.
Acknowledgements
We wish to thank Laura Colantoni and two anonymous reviewers for helpful comments on a previous version, and the Instituto da Lingua Galega for allowing us to use the recording of speaker no. 1.