Introduction
Attention Deficit Hyperactivity Disorder (ADHD) is an important public health problem that affects 5% or more of children in the United States. Although ADHD is a pediatric disorder, symptoms often persist into adulthood and may affect as many as 2–4% of adults in the United States (Barkley, Fischer, Smallish, & Fletcher, Reference Barkley, Fischer, Smallish and Fletcher2002; Kessler et al., Reference Kessler, Adler, Barkley, Biederman, Conners, Demler and Zaslavsky2006). Adults with ADHD are at increased risk of underemployment, poorer educational achievement, marital stress, social role impairment, and often suffer from comorbid psychiatric disorders (Biederman, Newcorn, & Sprich, Reference Biederman, Newcorn and Sprich1991; Kessler et al., Reference Kessler, Adler, Barkley, Biederman, Conners, Demler and Zaslavsky2006). Developmentally, symptoms of hyperactivity and impulsivity wane with age, whereas symptoms of inattention and disorganization remain problematic and may even increase as educational and occupational demands intensify in late adolescence and adulthood (Biederman, Mick, & Faraone, Reference Biederman, Mick and Faraone2000; Hart, Lahey, Loeber, Applegate, & Frick, Reference Hart, Lahey, Loeber, Applegate and Frick1995). These complications are present even in adults with higher than average intellectual functioning (Antshel et al., Reference Antshel, Faraone, Maglione, Doyle, Fried, Seidman and Biederman2009). Thus, there is strong motivation to identify and understand the psychological and cognitive mechanisms at the root of this disorder.
Several studies have sought to identify and characterize specific deficits in selective attention associated with ADHD. However, in a recent review, Huang-Pollock and Nigg concluded that “data concerning a convincing and replicable attentional orienting deficit in ADHD did not appear” (2003, p. 817). Aggregate effect sizes they reported (based on a quantitative meta-analysis of 10 studies) were relatively small. Thus, cumulative evidence suggests that many aspects of selective attention are spared in ADHD (e.g., Huang-Pollock & Nigg, Reference Huang-Pollock and Nigg2003; Nigg, Swanson, & Hinshaw, Reference Nigg, Swanson and Hinshaw1997; Schachar, Tannock, & Logan, Reference Schachar, Tannock and Logan1993; Swanson et al., Reference Swanson, Posner, Potkin, Bonforte, Youpa, Fiore and Crinella1991).
The paucity of evidence for impaired attentional functioning associated with ADHD remains puzzling when considered in relation to clinical phenomenology. For example, individuals with ADHD (as well as individuals with other disorders) typically report difficulty focusing attention, especially in cluttered environments. However, most studies attempting to characterize deficits in selective attention associated with ADHD have relied on procedures in which targets are presented in isolation, or with little competition among objects for attention. For example, the studies reviewed by Huang-Pollock and Nigg (Reference Huang-Pollock and Nigg2003) used some variant of Posner's (Reference Posner1980) procedure in which the key dependent measure is the reaction time to detect a single visual target at attended versus unattended locations. This procedure emphasizes orienting of attention and may be less sensitive to other components of attention, such as the suppression or resolution of interference generated by irrelevant information.
The current report is specifically concerned with the resolution of perceptual interference that can hinder the initial encoding of target stimuli. Few studies with ADHD populations have focused on attentional resolution of perceptual interference, which is caused by irrelevant distracters that have to be suppressed to facilitate attention. Spatial attention facilitates target processing via both distractor suppression and signal enhancement (e.g., Awh, Matsukura, & Serences, Reference Awh, Matsukura and Serences2003; Awh, Sgarlata, & Kliestik, Reference Awh, Sgarlata and Kliestik2005; Desimone & Duncan, Reference Desimone and Duncan1995; Kastner, De Weerd, Desimone, & Ungerleider, Reference Kastner, De Weerd, Desimone and Ungerleider1998; Shiu & Pashler, Reference Shiu and Pashler1994). Measuring perceptual interference requires use of displays that contain a large number of irrelevant distracters, rather than task-relevant distractors, which may contribute to response conflict. Perceptual interference has been distinguished from response conflict, which refers to the interference from distractors that are associated with a different response than the target, such as in the flanker tasks (Eriksen, Reference Eriksen1995). This distinction highlights an important gap in the ADHD literature.
The current approach complements a study by Huang-Pollock, Nigg, and Carr (Reference Huang-Pollock, Nigg and Carr2005), who directly manipulated the distractor interference during a visual search task. That study determined how the presence of nearby task irrelevant distractors influenced the strength of response conflict generated by a task-relevant distractor . The logic of that study derived from the “perceptual load” model proposed by Lavie (Reference Lavie1995). This model predicts a reduction in response conflict when a high perceptual load depletes attentional resources that are needed to process the task-relevant distractor. Consistent with that model, Huang-Pollock and colleagues observed that response conflict was muted under high perceptual load. However, no differences appeared between ADHD and control groups in the effect magnitude. This result suggested that the ability to suppress or ignore task-irrelevant distractors is spared in ADHD. However, the primary dependent measure in that study was the magnitude of response conflict (slowing in presence of the task-relevant distractor). Because this kind of response conflict is thought to reflect relatively late stages of processing that follow the initial encoding of the target, this procedure was not well suited to isolate observers’ ability to resolve interference during the initial perceptual encoding of visual targets. Thus, a more direct measure of selection efficiency (non-task related distractor suppression) during early stages of visual processing could provide a powerful complement to this result. The present study therefore introduces method of measuring the strength of perceptual interference during a visual discrimination task, to assess the degree to which observers can use spatial attention to resolve this kind of low-level visual interference.
Methods
Participants and Diagnostic Criteria
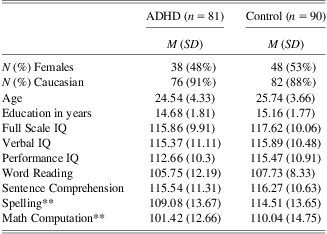
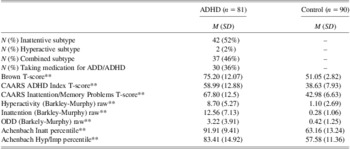
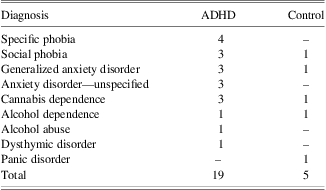
All procedures were approved by the Human Investigations Committees at Oregon Health & Science University and the University of Oregon. A total of 166 healthy adults between the ages of 18 and 34 participated in Experiment 1 after providing informed written consent. Seventy-seven of these participants were classified as ADHD (as defined below) and the remaining 89 were non-disordered controls. Demographic information for this sample is provided in Table 1. Measures of ADHD symptom severity (see below) are shown in Table 2. To avoid potential controversy about validity of the ADHD assignments, the DSM-IV were followed carefully, including caution in excluding participants whose symptoms might have been attributable to comorbid conditions. Thus, this sample had fewer comorbid disorders than a general clinical ADHD sample would be expected to have. While this may limit generalization to more severe or comorbid ADHD cases (with risk of Type II error), any effects identified have a higher probability of being specific to ADHD. Most ADHD participants (65/77; 84%) received no concurrent Axis I psychiatric diagnosis, while seven had one additional diagnosis, and five had two or more concurrent diagnoses (Table 3). Among the control participants, 85/89 (95%) had no current diagnosis while four were identified with a single Axis I disorder.
Demographic data for the ADHD and control

Significant differences between ADHD and control groups, measured by t tests, indicated next to variable name.
*p < .05; **p < .01.
Descriptive statistics of symptom indicators in ADHD and control participants

Significant differences between ADHD and control groups, measured by t tests, indicated next to variable name.
*p < .05; **p < .01.
Comorbid diagnoses by group

All participants who completed Experiment 1, were invited to participate in Experiment 2. Of those, 50 ADHD (24 female) and 65 Control (36 female), completed Experiment 2.
Participant Recruitment
Participants were recruited from the community through public advertisements such as craigslist.org, local newspaper ads, and the local hospital clinical trials Web site. Prospective participant contacted the project office for preliminary screening of eligibility. Eligible participants were then scheduled for a diagnostic visit wherein they completed a semi-structured clinical interviews including the Kiddie Schedule for Affective Disorders and Schizophrenia (KSADS-E modules modified for adults; Biederman et al., 1992) and the Structured Clinical Interview for DSM Disorders (SCID-I; First, Spitzer, Gibbon, & Williams, Reference First, Spitzer, Gibbon and Williams1997), as well as questionnaires and cognitive/achievement testing (see below). If the participant remained eligible for the study, the experimental measures were administered.
Assessment of ADHD Symptoms by Self and Informant Reports
We acquired retrospective assessment of childhood ADHD status from the participant and a past informant to establish childhood onset, and inclusion of contemporaneous informant interview to verify current symptoms and impairment (Wender, Wolf, & Wassertein, Reference Wender, Wolf and Wassertein2001). Interviewers were either research assistant or graduate students in clinical psychology who underwent extensive training, with fidelity checks (via spot checking of video recording of interviews) and weekly supervision by a licensed clinician. Participants also completed the self report Conners, Erhardt, and Sparrow (Reference Conners, Erhardt and Sparrow1999) Adult ADHD Rating Scale; Achenbach (Reference Achenbach1991) Young Adult Self-Report Scale; Brown (Reference Brown1996) Adult Attention-Deficit Disorder Scales; and the Barkley-Murphy (Reference Barkley and Murphy2006) Current and Childhood Symptoms Scales. Informant interviews were conducted to provide corroboration of participant's self reported history in just over half of the cases. An individual well acquainted with the participant's childhood behavior (typically a parent) completed an interview in which we administered the retrospective Kiddie Schedule for Affective Disorders and Schizophrenia (K-SADS; Puig-Antich & Ryan, Reference Puig-Antich and Ryan1986) to assess childhood ADHD, conduct disorder (CD) and oppositional defiant disorder (ODD) symptoms and impairment. They also completed the Barkley-Murphy (Reference Barkley and Murphy2006) Childhood Symptoms Scale – Other Report Form. A contemporary familiar with the participant's behavior during the previous 6 months (e.g., spouse or roommate) completed a similar interview. We acquired past collateral information on 54 (67%) of the ADHD participants, and current collateral information on 50 (60%) of participants. Based on the collateral information, four of these individuals were excluded.
Best Estimate Diagnosis for ADHD
A best estimate procedure established a final diagnosis of ADHD (Faraone, Biederman, & Monuteaux, Reference Faraone, Biederman and Monuteaux2000; Nigg et al., 2005). A clinical diagnostic team (2 licensed clinical psychologists) independently reviewed a subset of available cases, examining information from the SCID-I, K-SADS, and informant ratings to determine participant eligibility, ADHD status (present or absent), ADHD subtype (if applicable), and comorbid disorders. To obtain a diagnosis of adult ADHD, the participant (1) met full DSM-IV criteria for a diagnosis of ADHD by the age of 12, as well as currently (within the past 6 months); (2) described chronic ADHD symptoms from childhood to adulthood; and (3) endorsed a moderate or severe level of impairment attributed to the ADHD symptoms (based on the KSADS). Participants were excluded if the diagnostic team judged that ADHD symptoms were better explained by a co-occurring disorder rather than ADHD (American Psychiatric Association, 1994). Diagnostic reliability was determined by clinical directors at the two research sites based on a subset of 20 cases. There was high agreement on eligibility (k = .956; p < .001) and perfect agreement on group assignment (i.e., ADHD, Control) and ADHD subtype (hyperactive, inattentive, combined).
Intelligence and Achievement Assessment
Standardized intelligence (e.g., the Weschler Abbreviated Scale of Intelligence, Wechsler Reference Wechsler1999) and achievement (the Wide Range Achievement Test, Wilkinson & Robertson, Reference Wilkinson and Robertson2006) measures were used to determine overall level of cognitive functioning and identify comorbid learning disabilities. A suspected learning disability was suggested by a 1.5 standard deviation difference between overall intellectual functioning and achievement scores but was not exclusionary.
Exclusion Criteria
Exclusion criteria for both groups included (1) any clinically significant medical or neurological conditions; (2) sensory-motor handicap(s); (3) estimated Full Scale IQ < 85; (4) learning disorder(s); (5) current major depressive or manic-hypomanic episode; (6) substance abuse/dependence that would prevent sober testing; (7) lifetime history of psychosis or bipolar disorder; (8) prescribed anti-psychotic, anticonvulsant, or antidepressant medication; (9) history of conduct disorder; (10) English as a second language; and (11) a closed head injury with loss of consciousness > 1 min. Absence of substance use was verified by urine toxicology screens administered at the beginning of each testing session. Subjects were not excluded for positive results of THC (14 ADHD, 15 Controls), but were dismissed for positive tests of cocaine (2 ADHD), opiods, amphetamine, and methamphetamine (1 ADHD).
Medication Washout
Of the ADHD participants who participated in the study 26 (34%) were prescribed stimulant (amphetamine-based) medication at the time of enrollment. These participants underwent a washout period of 24 hr to 72 hr before completing the experimental tasks. Washout was confirmed with the urotoxicology tests (a positive amphetamine result was considered an incomplete washout). When tests were positive, participants were rescheduled.
Experimental Tasks
The experimental tasks were designed to evaluate non-task relevant distractor effects using a mechanistically valid measure of perceptual selection. To do this, we chose a well understood visual crowding paradigm that avoids several psychometric problems from prior task designs (Awh et al., Reference Awh, Matsukura and Serences2003, Reference Awh, Sgarlata and Kliestik2005; Scolari, Kohnen, Barton, & Awh, Reference Scolari, Kohnen, Barton and Awh2007). The psychophysical tasks were conducted under similar conditions at two testing sites. Participants completed the tasks used in Experiments 1 and 2 on separate days. All stimuli were presented on 15-inch monitors cycling at 85 Hz. A head holder was used to hold constant the size and position of the stimuli on the eye across participants.
Experiment 1
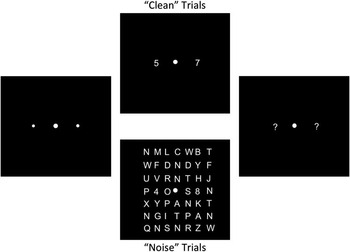
A schematic of the task used in Experiment 1 is depicted in Figure 1. Participants were required to identify two digits (randomly selected from 2 to 9 without replacement) presented at equidistant locations to the left and right of a fixation cross along the horizontal meridian (Figure 1). Each trial began with a fixation display for 1540 ms, consisting of a central fixation point, flanked on either side by two small “placeholders” denoting the targets’ locations. The target array was then presented for 170 ms to discourage eye movements. On 50% of trials, the targets were presented in isolation (“clean” trials) or embedded within 7 × 7 grids of calculator-font letters (“noise” trials). Stimuli were rendered in white against a black background. Targets were presented at 1.8° eccentricity. Number and letter stimuli subtended 0.7 × 0.5°. During noise trials, targets and distractors were separated by 1°. After the offset of the target array, a question mark (“?”) appeared at each target location. Participants identified the target digits using a number keypad. Participants’ responses appeared on the screen, and they could edit their responses until they pressed the return key.
Schematic of Experiment 1. Each trial began with a 1540-ms fixation interval (left panel), followed by the presentation of the target array (center panels) for 170 ms. During clean trials, a numerical target was presented on each side of fixation. During noise trials, targets were embedded in a 7 × 7 grid of distractors (letters). At the end of each trial, a question mark prompt appeared at each target location; participants were instructed to type their responses using the number pad on a standard keyboard.

To ensure comparable performance between clean and noise displays, we adjusted stimulus luminance using a staircasing algorithm, applied independently to trials of each display type. If both targets were reported accurately on three consecutive trials of a display type, luminance was reduced by 8% of the current luminance level measured in the RGB scale (ranging from 1 to 255, with an initial value of 255 in both display types). If only one target was reported accurately on a trial, luminance was increased by 8%. If both targets were reported inaccurately on a trial, luminance was increased by 16%. Feedback indicated the subject's response accuracy. This procedure converges on a luminance value that yields 79% accuracy in each condition. Final luminance thresholds for clean and noise displays were the primary dependent measure in this study and were measured by averaging the luminance values during the final two blocks of the tasks, which allowed ample time for performance to reach a stable asymptote by this phase of the procedure.
Participants were given detailed instructions and then were dark-adapted for 5 min. Then they received 20 practice trials (10 clean trials, 10 noise trials) similar to the real trials except that the display duration was lengthened to 500 ms to acquaint them with the task's structure and response procedures. Following practice they completed 8 blocks of 40 trials, with each block resuming at the luminance levels from the end of the previous block.
Experiment 2
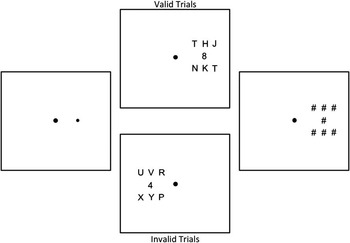
In Experiment 2, stimuli were rendered in black against a white background. Participants were instructed to report the identity of a single target digit that was presented in the presence or absence of nearby distractors (letters; see schematic in Figure 2). On each trial, the target was presented in one of two locations 3.5° to the left or right of fixation. Stimulus dimensions and center-to-center spacing (noise trials only) are as in Experiment 1. Before the onset of the target array, a spatial precue was presented for 33 ms (left panel of Figure 2). This cue indicated the location of the subsequent target with 80% validity. Following a 50-ms blank interval, the target array appeared. On 50% of trials, this array contained a single target digit (“clean” trials). On the remaining 50% of trials, the target digit was embedded within a small grid of nearby letter distractors (“noise” trials; see Figure 2). The target array was presented for a brief interval (determined for each participant via a staircasing algorithm) and followed by a mask array (Figure 2, right panel) that remained present until the participant entered a response on the number pad of a standard keyboard.
Schematic of Experiment 2. Each trial began with a 500-ms fixation interval. A precue was then presented for 33 ms (left panel) and immediately followed by the target array (middle panels). On 80% of trials, the cue appeared at target's location (upper middle panel). On the remaining 20% of trials, the cue appeared at a location opposite the target (lower middle panel). On 50% of trials, the target was embedded in an array of letter distractors (“noise” trials). On the remaining 50% of trials, the only the target was presented (“clean” trials, not shown). The target array was presented for a variable interval (individually determined for each participant) and followed by an array of pound sign masks for 360 ms.

Exposure Durations
Before beginning the main task, each participant completed a staircase procedure designed to equate task difficulty during validly cued clean and noise trials. This procedure was identical to the main task, with the exceptions that (1) the target array was preceded by a 100% valid precue, and (2) the stimulus duration of the target was continuously adjusted using the staircasing procedure until a criterion level of performance was reached. The target duration began at 360 ms. Separate thresholds were determined for clean and noise trials.
Results and Discussion
Experiment 1
We examined the clean condition data to make sure that all participants obtained thresholds that were well below the initial luminance contrast of 255. The highest luminance threshold on the clean (no distracters) condition was 50. This confirmed appreciable decreases in the luminance thresholds for all participants indicating they were indeed attending to the task and responding appropriately. In all analyses that follow, we initially included participants’ gender, medication status at the time of study enrollment (currently taking medication, not on medication), and ADHD diagnostic subtype (e.g., inattentive, combined). These factors had no apparent influence on task performance and will not be discussed further.
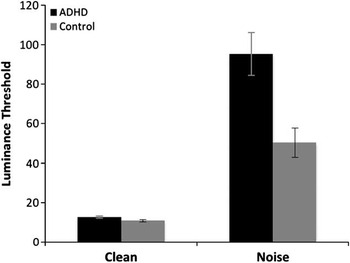
As expected, luminance thresholds were substantially lower during clean relative to noise trials (Figure 3). Thresholds observed in the clean condition for the ADHD (M = 12.53) and control groups (M = 10.86) were similar. However, during the noise trials, luminance thresholds were substantially higher for the ADHD group (M = 95.16) compared to the controls (M = 50.25). Thresholds from clean and noise trials were submitted to a 2 × 2 mixed-model analysis of variance (ANOVA) with group as the sole between-subjects factor. This analysis revealed a main effect of group (ADHD vs. Control), F(1,162) = 10.68, p < .001 and a main effect of trial type (clean vs. noise), F(1,162) = 87.10, p < .001. This suggests that in the absence of distractors, both ADHD and control participants had little difficulty in selecting and reporting low contrast targets. However, the effect of noise interacted with group membership, F(1,162) = 9.89, p = .002. Post hoc analyses revealed a significantly larger difference in luminance thresholds between the ADHD and Control groups during noise trials, t(162) = 3.07, p = .003 than clean trials, t(162) = 1.88, p = .07.
Results of Experiment 1. Mean luminance (±SEM) thresholds observed during clean and noise trials for the ADHD and control groups. Mean luminance values observed in the ADHD and control groups were statistically identical during clean trials. However, mean luminance values observed in the ADHD group were substantially larger than those observed in the control group during noise trials, suggesting that individuals with ADHD were disproportionately affected by the presence of irrelevant distractor.

The noise and clean trials were randomly intermixed within each block of trials, making it unlikely that fatigue or other non-specific factors related to motivation or strategy accounted for the group differences in luminance thresholds observed during noise trials. Distractors had a deleterious effect on performance in both groups. However, the effect of distractors increased the mean luminance thresholds of the ADHD group during noise trials to approximately 80% greater than those observed in the control group. This result suggests that individuals with ADHD are disproportionately susceptible to the presence of nearby visual interference.
This initial result supported the supposition that in fact perceptual processing may be altered in ADHD, providing a possible explanation for experiences of distraction that are not in fact “attentional.” However, at least two possible explanations the Experiment 1 results require consideration before accepting that conclusion. One possibility is that individuals with ADHD had difficulty allocating spatial selective attention because they could not resolve interference from nearby distractors. This would be consistent with our hypothesis and would suggest that apparent attention problems are secondary to a perceptual processing (upstream) problem.
Alternately, selective attention may be unaffected in ADHD. Instead, individuals with this disorder may experience amplified levels of visual interference unrelated to attention. For example, target discrimination is strongly impaired when targets are located very near task-irrelevant distracters, a phenomenon that has been labeled visual crowding (Bouma, Reference Bouma1971). Visual crowding is hypothesized to reflect lateral interactions between neural representations of closely spaced stimuli that leads to a harmful integration or “pooling” of target and distractor features (cf., Pelli, Palomares, & Majaj, Reference Pelli, Palomares and Majaj2004). In the current context, even if visual attention were operating normally in ADHD, amplified perceptual interference from visual crowding could still have yielded lower performance in the noise condition.
Experiment 2
To determine if the deficits in the ADHD group resulted from impaired allocation of attention in the presence of distracters or whether they were attributable to enhanced crowding (failure to suppress distracters), Experiment 2 manipulated the amount of interference present in target displays while using spatial precues to manipulate spatial attention (Figure 2). Before completing the main experimental task, we determined target array exposure duration thresholds for clean and noise trials using a 100% valid cueing procedure. This equated the difficulty of perceptual processing across participants and enabled us to focus on putative group differences in ability to use spatial selective attention to resolve visual interference from irrelevant distractors.
Exposure Duration Thresholds
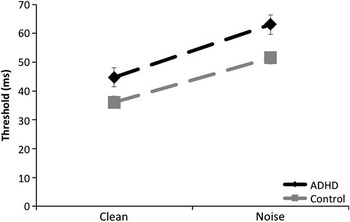
Data for one ADHD participant were eliminated because his clean exposure duration thresholds were greater than four standard deviations above the next highest ADHD threshold score for both the clean and noise conditions and were long enough to permit voluntary eye movements to the target. As shown in Figure 4, mean exposure durations were lower during clean trials (M = 40.83 and 36.0 ms for the ADHD and control groups, respectively) relative to noise trials (M = 61.6 and 51.4 ms). Exposure durations were initially submitted to a 2 (group – ADHD vs. Control) by 2 (trial type – clean vs. noise) mixed model ANOVA. There was a significant effect of group (F(1,114) = 9.09; p < .01), and trial type (F(1,114) = 125.86; p < .001) but the group by trial type interaction was not significant, F(1,114) = 1.46; p = .23. The ADHD group had modestly but significantly elevated exposure duration thresholds relative to controls. Although these results did not reveal the same strong interaction between group and trial type as in Experiment 1, we note that the strength of distractor interference was also substantially reduced because distractors were spaced further away from the target stimuli in Experiment 2. This aspect of the design was necessary to prevent floor effects due to the greater eccentricity of the target and the predicted reduction of performance during invalid trials. Thus, while this design provides a sensitive platform for measuring the degree to which spatial attention can resolve visual interference, it may be less sensitive to potential differences in the strength of distractor interference than observed in Experiment 1.
Mean exposure duration thresholds observed in Experiment 2. Mean exposure duration thresholds (±SEM) are plotted as a function of display type (clean vs. noise) and group (ADHD vs. Control).

Cued Spatial Attention
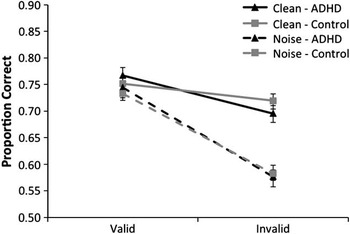
Mean target identification accuracy is plotted as a function of cue type, distractor type, and group membership in Figure 5. There was a significant advantage for target processing at attended locations (i.e., valid minus invalid target discrimination accuracy) on noise relative to clean trials. During clean trials, valid cues were associated with higher accuracy in both groups (M = 0.77 and 0.75 for the ADHD and control groups, respectively) relative to invalid cues (M = 0.70 and 0.72). A similar pattern was observed during noise trials: valid cues led to higher overall accuracy (M = 0.74 and 0.73 for the ADHD and control groups, respectively) relative to invalid cues (M = 0.58 for both groups). To determine whether ADHD was associated with difficulty in allocating spatial attention (so as to resolve distractor interference), data (target identification accuracy) from the primary spatial attention task were submitted to a 2 (trial type – clean vs. noise) × 2 (cue type – valid vs. invalid) × 2 (group membership – ADHD vs. Control) mixed-model ANOVA with group membership as the sole between-subjects factor. This analysis revealed the expected main effects of distractor type, F(1,114) = 55.06; p < .001, and cue type, F(1,114) = 230.98; p < .001. Critically, the main effect of group membership was not significant, F(1,114) < 1, and this factor did not interact with distractor or cue type. Additionally, we observed an interaction between cue type and distractor type, F(1,114) = 146.03; p < .001. Cue type by distractor condition interactions are a hallmark of the influence of attention in resolving interference due to distractors; that is, larger attention effects in the presence of interference suggest that attention plays a role in resolving that interference. Thus, the data confirm that this procedure provided a sensitive measure of spatial cueing effects, as well as the known benefits of spatial selection for the resolution of visual interference (e.g., Scolari et al., Reference Scolari, Kohnen, Barton and Awh2007). Nevertheless, the strength of visual interference resolution (as operationalized by the interaction between cue type and display type) was identical across the ADHD and control groups, suggesting that the attentional resolution of distractor interference was equivalent across these populations.
Results of Experiment 2. Mean proportion correct responses (±SEM) are plotted as a function of cue type (valid vs. invalid) and display condition (noise vs. clean). No group differences were observed as a function of either factor.

The results of Experiment 2 were unequivocal. Once adjusted for individual differences in exposure duration thresholds of the targets in the presence and absence of distractors, the ADHD group's performance was indistinguishable from the control group. This stands in direct contrast to the marked differences in target discrimination thresholds that were observed in Experiment 1. Taken together, Experiments 1 and 2 suggest that while ADHD individuals may suffer from amplified visual interference from nearby distractors, their ability to resolve this kind of interference at attended locations is similar to that of controls, indicating a deficit in resolving perceptual interference.
General Discussion
In Experiment 1, individuals with ADHD were drastically impaired by interference from irrelevant distractors. Specifically, luminance thresholds for perceiving targets in noise displays were substantially higher for ADHD participants relative to controls. This effect was not explained by comorbid disorders, medication history, gender, or other confounds. It was concluded that the impairment could reflect either a deficit in the attentional resolution of visual interference (a top-down process), or amplified interference from the distractors due to differences in low-level target-distractor interactions (a bottom-up process) (Pelli et al., Reference Pelli, Palomares and Majaj2004).
To distinguish between these possibilities, Experiment 2 measured spatial cueing effects in both noise and clean displays while controlling for differences in the difficulty of perceptual encoding across groups and display types. Here, we observed robust spatial cueing effects. These cueing effects were independent of experimental group, that is, both ADHD and control participants showed identical enhancement of spatial cueing effects in noise relative to clean displays. This strongly suggests that attention-based interference resolution was intact in the ADHD group, and suggests that the experiment 1 results are most attributable to amplified perceptual interference in cluttered visual environments, a bottom-up problem in perceptual processing.
Our working hypothesis is motivated by the literature documenting a phenomenon referred to as visual crowding (Bouma, Reference Bouma1971; for review, Pelli et al., Reference Pelli, Palomares and Majaj2004). Crowding effects are hypothesized to reflect a harmful integration of target and distractor features when those items fall within a certain distance of one another (Cavanagh, Reference Cavanagh2001; Parkes, Lund, Angelucci, Solomon, & Morgan, Reference Parkes, Lund, Angelucci, Solomon and Morgan2001). Our data suggest that individuals with ADHD are more susceptible to this form of interference. Intriguingly, our data suggest that increases in such low-level sensory interactions can be documented even when attentional processes that work against these interactions are operating normally.
Although we did not assess subjective experience of distraction, this finding is consistent both with experimental reports of intact selective attention in ADHD (as observed in Experiment 2) and with clinical reports that patients with ADHD are troubled by difficulty managing distracting information (“selection”). Future work could examine the extent to which the subjective phenomenology is related to the experimental effect seen here. We were unable to identify relations between clinical scales of ADHD inattentive symptoms and task effects; however those scales are not optimized to assess subjective feelings of being distracted in busy environments.
Thus, a key conclusion from the current report is that, regardless of the relation to subjective phenomenology, sensitivity to perceptual interference from visual crowding is elevated in adults with ADHD, while selective attention is intact. This is important in suggesting future directions for investigation. While there has been an substantial focus in the past two decades on “top down” attentional processes such as cognitive control mechanisms and executive function deficits in ADHD, the current data suggest that careful examination of “bottom up” information processing such as perceptual level processing may be fruitful. ADHD may be associated with dysfunction arising at sensory stages of processing. Our findings emphasize how apparent difficulties in contexts that seem to require intact attentional function (e.g., crowded or distracting visual environments) may not be due to attentional dysfunction per se, but instead due to amplified levels of interference at early stages of sensory processing.
This conclusion dovetails with the idea that it is productive to distinguish between the site of selective attention effects (i.e., in the present case, the visual cortical regions where low-level crowding effects are manifest) and the source (e.g., dorso-lateral prefrontal cortex) of the top-down signals that generate these attentional modulations (Posner and Petersen, Reference Posner and Petersen1990).
Several studies of perceptual interference have indicated that the interference resolution probably takes place in early visual cortices, that is, V1 or V2 (Boehler, Tsotsos, Schoenfeld, Heinze, & Hopf, Reference Boehler, Tsotsos, Schoenfeld, Heinze and Hopf2011; Serences, Yantis, Culberson, & Awh, Reference Serences, Yantis, Culberson and Awh2004). Using a paradigm similar to the one used in Experiment 1, Serences et al. used fMRI to demonstrate that attending to a location under conditions when distractors were present versus absent, produced a significantly large signal than when distractors were absent. Importantly, when distractors were not anticipated, the signal response was comparable whether or not the location was attended or unattended (Serences et al., Reference Serences, Yantis, Culberson and Awh2004). These results suggest that visual cortical areas are modulated by attention, although the source of the modulation remains to be elucidated. Our working hypothesis is that individuals with ADHD suffer from abnormally strong interference between competing visual stimuli due to increased low-level interactions in early visual areas. This increased interference could explain the amplified thresholds for noise displays in Experiment 1, despite evidence from Experiment 2 that visual selective attention operating normally in the ADHD group.
These results must be considered in light of the limitations of the study. The ADHD and control participants were generally in the low average to high average range of intellectual functions, and we specifically excluded individuals with an estimated IQ < 85. Therefore, they may not reflect the general population where some individuals with ADHD have IQ < 85. This could have resulted in underestimation of the size of the ADHD deficit. Furthermore, because the deficits were present in high functioning adults, they seem more likely to persist, as has been shown for other symptoms of ADHD in similar high functioning cohorts (Antshel et al., Reference Antshel, Faraone, Maglione, Doyle, Fried, Seidman and Biederman2009). Clearly, future studies will need to address the generality of the current findings. Nevertheless, the presence of heightened interference in early stages of visual processing in ADHD present a potential explanation for broad range of findings on a range of cognitive functions.
Acknowledgments
This work was supported by a grant from the National Institutes of Mental Health (R01MH077105) to Dr. Edward Awh. The authors declare no conflict of interest regarding this research.