I. INTRODUCTION
Fabrication of inorganic nanowires (NWs) with controlled morphology has attracted a lot of interest due to their potential applications in high-density storage media,Reference Nielsch, Wehrspohn, Barthel, Kirschner, Gosele, Fischer and Kronmuller1 highly sensitive giant magnetoresistance (GMR) materials,Reference Dubois, Beuken, Piraux, Duvail, Fert, George and Maurice2, Reference Blondel, Meier, Doudin and Ansermet3 sensors,Reference Varghese, Gong, Dreschel, Ong and Grimes4–Reference Xu, Qin, Yang and Li6 biosensors,Reference Matsumoto, Nishio and Masuda7 photocatalysts,Reference Ono, Saito, Ishiguro and Asoh8, Reference Chu, Inoue, Wada, Hishita and Kurashima9 thermoelectric cooling systems,Reference Lim, Whitacre, Fleurial, Huang, Ryan and Myung10 and photonic crystals.Reference Peng, Qin, Zhou and Li11–Reference Choi, Luo, Wehrspohn, Hillebrand, Schilling and Gosele13 Among different deposition methods, template-assisted techniques are promising due to the high level control over morphology and packing density of NWs. Polycarbonate films as well as anodized aluminum oxide (AAO) are the most popular templates which have been used.Reference Martin14–Reference Schonenberger, vanderZande, Fokkink, Henny, Schmid, Kruger, Bachtold, Huber, Birk and Staufer18 AAO is preferred in comparison with polycarbonate templates because of its potential for high-density storage applications. AAO templates with parallel cylindrical pores in the form of hexagonally close-packed patterns have been demonstrated, using a two-step anodization process developed by Masuda et al.Reference Masuda, Hasegwa and Ono19–Reference Masuda and Fukuda21 The anodization of aluminum in certain electrolytes results in the following structure for the AAO template: aluminum base, alumina barrier layer separating the aluminum from the nanoporous membrane, and the nanoporous alumina membrane. AAO templates can be filled by different ferromagnetic materials for preparation of aligned ferromagnetic NWs. Direct current (DC) electrodeposition has been proved to be a useful technique as it provides a substantial control over the composition and the crystallinity of NWs.Reference Nicewarner-Pena, Freeman, Reiss, He, Pena, Walton, Cromer, Keating and Natan22, Reference Tian, Wang, Kurtz, Mallouk and Chan23 However, DC electrodeposition is not feasible in the presence of the barrier layer, and as such is not amenable to industrial scale processing because of the laborious preprocessing that must be performed on the template before deposition. In contrast, AC electrodeposition appears to be a successful technique for the preparation of NWs due to a less complex sample preparation process. The AC electrodeposition through the barrier layer is a complicated process, due to the complex chemical and structural nature of the barrier layer. Many efforts have been made to understand the effect of the barrier layer during the electrodeposition process. In early works, the thin film structure of Al–Al2O3–Al was modeled as a series combination of an interfacial capacitance and a geometrical capacitance.Reference Hebard, Ajuria and Eick24 Brevnov et al. have modeled the structure with an equivalent circuit that consists of two parallel constant phase elements (CPEs) and resistances to describe the behavior of barrier layer, barrier layer–aluminum, and barrier layer–electrolyte interfaces during the electrodeposition process.Reference Brevnov, Rama Rao, López and Atanassov25 Sharma et al. have modeled the structure with a circuit consisting of the uncompensated cell resistance and a parallel combination of a resistor and a capacitor to describe the barrier layer-solution interface and a parallel combination of a resistor and CPE to describe the barrier layer.Reference Sharma, Pishko and Grimes26
This work investigates the effect of the barrier layer during the electrodeposition through experiments on electrodeposition of arrays of Co NWs. A compact electrodeposition process is proposed that provides excellent matching to experimental data. The model provides an accurate tool for estimating the amount of material deposited and can be used to control length and magnetic properties of deposited Co NWs. The model accurately predicts the role of deposition frequency and voltage on NWs and identifies the role of the alumina barrier layer in deposition.
II. EXPERIMENTAL
Co NWs were fabricated using electrodeposition and template method. Porous aluminum oxide (PAO) was made by anodizing the aluminum foils in a conventional two-step process.Reference Masuda and Fukuda21 High purity (99.999%) aluminum sheets were cut to 8 mm diameter disks and then ultrasonically degreased in acetone for 6 min followed by annealing at 450 °C for 1 h in high purity argon (Ar) for enlarging the grain size and to obtain homogeneous microstructure for pore growth over a large area. Formation of an oxide layer can lead to further residual stress in the surface of the plate, which is detrimental to the ordering of pores in anodic aluminum oxide structure. To remove the oxide layer, samples were etched in 3 M NaOH at room temperature for about 3 min prior to the anodization process. Samples were then washed and electropolished in 1:4 (v/v) solutions of H2ClO4 and ethanol with a constant voltage of 20 V for 5 min. For obtaining highly ordered pores a two-step mild anodization process was used. The first anodization was carried out in 0.3 M oxalic acid, (COOH)2, electrolyte at 40 V and 17 °C for 15 h. The anodized layer was then removed by immersing the samples in a 0.2 M chromic acid and 0.5 M phosphoric acid solution for 15 h at 70 °C. The patterned aluminum substrate was re-anodized using the same conditions as in the first step for 1 h. The barrier layer thickness for samples made by mild anodization technique is reported to be linearly proportional to the anodization voltage, about 1 nm/V.Reference Shimizu, Kobayashi, Thompson and Wood27 Therefore the barrier layer thickness is estimated to be about 40 nm. This barrier layer is too thick and has to be thinned for electrodeposition.
Co NWs were AC electrodeposited using sine, square and triangle waves (20–30 Vpp) in different frequencies ranging from 50 Hz to 1500 Hz. Electrodeposition was performed at room temperature for 2 min. A platinum plate was used as counterelectrode and PAO template as working electrode. A solution of 0.3 M CoSO4 and 0.73 M boric acid was used as the electrolyte. At the beginning, the pH value of the electrolyte was about 3.2, but it was adjusted to 4.5 and maintained constant during the experiment using NaOH. The electrolyte was continuously agitated during the deposition procedure.
Samples were characterized by scanning electron microscopy (SEM) and atomic force microscopy (AFM). Magnetic properties of the Co NWs embedded in the anodic aluminum template were measured using an alternating gradient force magnetometer (AGFM). The equivalent circuit for the barrier layer was modeled using Proteus 7.2 SP6 software. Electrochemical impedance spectroscopy (EIS) was performed using PGSTAT30 AUTOLAB. The data were acquired over a frequency range between 50 Hz and 1000 Hz with AC voltage of 10 mV. A low amplitude of the AC voltage is used in EIS for satisfying the condition of linearity. The measured voltage was in reference to a Saturated Calomel Electrode (SCE).
III. RESULTS AND DISCUSSIONS
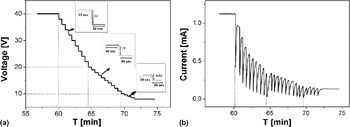
Figure 1 shows the anodization voltage (a) and current (b) during the barrier layer thinning process. The thinning process was performed by decreasing the anodization voltage in three stages. First, the anodization voltage was decreased by 4 V/min from 40 V to 20 V, and then decreased from 20 V to 10 V at a rate of 2 V/min followed by decreasing to 8 V with the rate of 0.5 V/min. The voltage variation was performed in a stepwise manner, e.g., for the 40 to 20 V region, the voltage was kept at an appropriate value for 30 s. Then it was immediately decreased to its next down step value (2 V lower). This procedure was repeated for the two next stages with step changes of 1 V and then 0.5 V. The anodization process was then continued for 3 min at 8 V for obtaining a uniform barrier layer. The final thickness for the barrier layer is estimated to be about 8 nm. Figure 1(b) shows the anodization current versus time during the thinning process. As seen, the current abruptly decreases by decreasing the voltage in each step then levels off to a constant value. Figure 2(a) shows a typical top view SEM micrograph of a pore structure after the second anodization. The average pore diameter and pore spacing are about 35 and 100 nm, respectively, which are in agreement with experimental results in the literature.Reference Shimizu, Kobayashi, Thompson and Wood27–Reference O’Sullivan and Wood30Figure 2(b) shows a SEM image of Co NWs electrodeposited at 200 Hz for 2 min after releasing from the alumina template. The length of NWs electrodeposited at 200 Hz varies from 1 up to 5 μm depending on the electrodeposition time. Therefore, NWs have an aspect ratio ranging from 30 to 150.
Anodization voltage (a) and current (b) during the procedure to thin the barrier layer.

(a) The SEM micrograph of the as-obtained alumina template by a two-step anodization process. (b) SEM micrograph of Co NWs after releasing from the alumina template.

The presence of the high resistivity (∼1010 to 1012 Ω-cmReference Sellmyer, Zheng and Skomski31) barrier layer is a major obstacle for DC electrodeposition of NWs. The barrier layer also incorporates a large amount of acidic anions.Reference Thompson, Wood and Scully32 The density and distribution of anions in the barrier layer mainly depends on the type of acid and conditions of the anodization process.Reference Thompson, Wood and Scully32–Reference Vrublevsky, Parkoun, Sokol, Schreckenbach and Marx34 For oxalic acid, there are many ion species of Al3+, O2−, and OH−, which are created in the barrier layer during the anodization process. It is well known that the anodization current is basically due to the migration of these ions in the barrier layer.Reference Jessensky, Muller and Giosele28, Reference Parkhutik and Shershulsky35 Although electrodeposition does not take place by DC voltage, it can be performed using an AC current.Reference Nielsch, Wehrspohn, Barthel, Kirschner, Gosele, Fischer and Kronmuller1, Reference Yin, Li, Jian, Bennett and Xu36 There are two half cycles in the AC deposition process. It is believed that electric current can tunnel through the barrier layer only in one half cycle, resulting in deposition of metal ions in the bottom of the pores. Since free electrons are only available in the aluminum, therefore electrons can tunnel from the aluminum–alumina interface to the alumina–electrolyte solution interface through the barrier layer during the cathodic half cycles. It then leads to the reduction of ions on the bottom of pores in the cathodic half cycle.
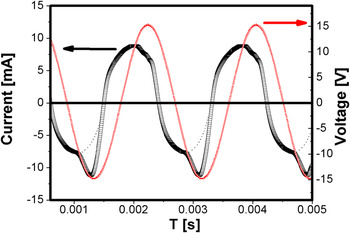
Figure 3 shows the experimental results for an electrodeposition current of 550 Hz sine wave. For comparison, the electrodeposition voltage is also included in the figure. The phase shift between the current and voltage is due to the capacitance properties of the circuit containing the barrier layer. These results corroborate experimental results reported earlier.Reference Almasi Kashi, Ramazani and Khayyatian37 As seen, the electrodeposition currents in the two half cycles are not symmetric. There are differences between current waveforms in terms of phase shift as well as shape and maximum current. Larger phase shift for current in the anodic half cycle than that for the cathodic half cycle indicates that the circuit shows different capacitive properties for different half cycles. In addition, although the anodic half cycles almost follow a sine wave, the cathodic half cycle does not. As the charge transfer is proportional to the area underneath the current curve for each half cycle, in fact, the differences between the shapes of two half cycles show the net charge transfer that is proportional to the amount of electrodeposited materials. The dotted line in the cathodic half cycles shows the difference between the two half cycles.
Experimental results for electrodeposition current as well as the electrodeposition voltage for 550 Hz sine wave. The dot line in the cathodic half cycles shows the difference between two half cycles.

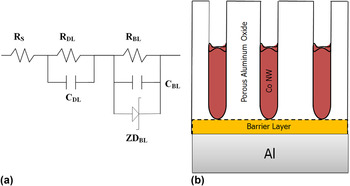
The observed electrodeposition current can be modeled by the circuit illustrated in Fig. 4(a). For comparison, a schematic of the structure is also shown in the Fig. 4(b). The equivalent circuit consists of a series combination of three components: (i) Rs models the uncompensated resistance of the electrolyte occupying the pores and the output resistance of the electronic devices, (ii) a parallel combination of a capacitance, CDL, and a resistance, RDL, that models the effects of the barrier layer-electrolyte interface, and (iii) a parallel combination of a capacitance, CBL, a resistance, RBL, and a Zener diode, ZDBL, that describes the behavior of barrier layer. Mass transfer limitation within the pores results in a higher value for Rs as compared with the expected value in bulk electrolyte. While the capacitance and resistance are used to account for capacitive charging and dielectric relaxation effects, the tunneling current in the barrier layer is modeled by a Zener diode with a reversible breakdown under a contact reverse bias. Since there are no free electrons available in the solution, the Zener diode is considered in reverse bias, and electrons can tunnel from the aluminum side to the solution when the electrodeposition voltage is high enough in the cathodic half cycle. Once the tunneling occurs, the current is effectively due to the electrons that transferred from the aluminum substrate to the barrier layer-electrolyte interface, confirming that RBL and CBL will be bypassed by the parallel ZDBL. As a result, in the cathodic half cycle the current phase only depends on RDL and CDL.
(a) The equivalent circuit in cathodic half cycles and (b) a schematic showing the structure of the PAO template.

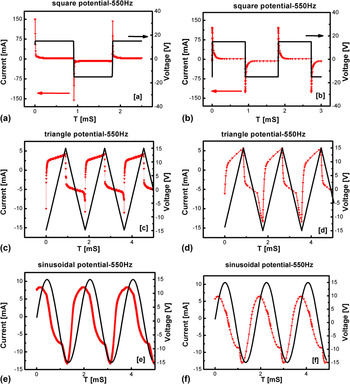
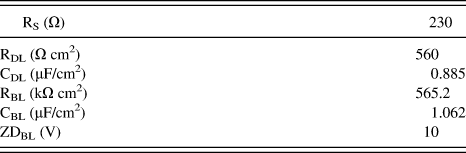
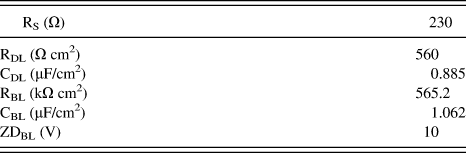
Figure 5 shows the simulated current and electrodeposition voltage as well as their experimental values for square, triangle and sinusoidal electrodeposition voltage waveforms at 550 Hz. As we can see, excellent agreement is obtained between experimental results and simulated results indicating the accuracy of the proposed circuit model. The values of the components used for simulation are summarized in Table I. The lower value of CDL in comparison to CBL that leads to a smaller phase delay in anodic half cycle is in agreement with experimental results previously reported by Atanassov et al.Reference Brevnov, Rama Rao, López and Atanassov25
The experimental deposition current for (a) square, (c) triangle, and (e) sinusoidal voltage waveform. The simulated current for (b) square, (d) triangle, and (f) sinusoidal voltage waveform.

Values of elements obtained from the equivalent simulated circuit.
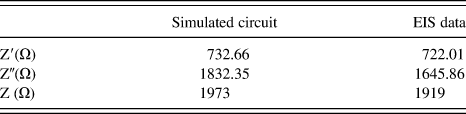
EIS measurements were also used to examine the accuracy of the parameters obtained by simulation. Table II shows the results of the real and imaginary parts of the impedance obtained from the EIS experiment as well as those obtained from the simulated circuit at f = 550 Hz. As seen, there is good agreement between simulation and the EIS experimental results.
The values obtained for impedance (ZTotal = Z′ +Z″ j) from simulated circuit and EIS experiment at 550 Hz.
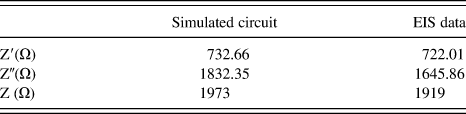
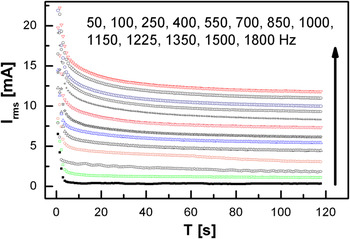
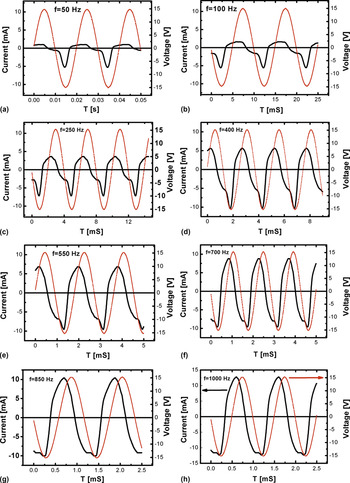
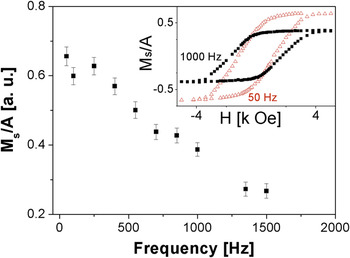
Figure 6 shows the electrodeposition current (Irms) versus time for sine wave electrodeposition with different frequencies ranging from 50 to 1800 Hz. The high initial electrodeposition current drops quickly with time followed by a slow decrease during the deposition process. Such high current at the beginning of the electrodeposition process is believed to be due to filling the smaller pores at the bottom of the pores.Reference Saedi and Ghorbani38 The resistance is slowly increased due to NW growth resulting in a slow decrease of the electrodeposition current over time. As seen, Irms increases with increasing frequency during the electrodeposition procedure. It should be pointed out that Irms measured by a multimeter does not really show the amount of electrodeposited material. The deposition current consists of cathodic and anodic half cycles. The difference between these two half cycles corresponds to the real amount of electrodeposited material. To confirm this, we have displayed the results for eight different frequencies ranging from 50 Hz up to 1000 Hz in Fig. 7. As seen, although Irms is relatively low for 50 Hz, there is big difference between two half cycles of the electrodeposition current at this frequency. By increasing the frequency, the Irms is increased, but the two half cycles gradually change to a more symmetrical pattern and therefore the difference between the two half cycles is decreased. Almost no difference between two half cycles can be seen for frequencies higher than 1500 Hz (not shown). Based on these results, there is expected to be a higher amount of the electrodeposited materials at lower frequencies. The saturated magnetization per unit area of samples (Ms/A) was evaluated and depicted in Fig. 8. Since the template properties (i.e., pore diameter and pore density) are the same for all samples and electrodeposition time is also equal for all samples, the magnetization presumably provides a quantitative estimation for electrodeposited materials. It has been recently proved that the value of Ms/A is proportional to the NW growth rate.Reference Almasi Kashi, Ramazani, Ghaffari and Isfahani39 The value of Ms/A was calculated from the hysteresis loop of the NW samples obtained by magnetic measurement. The inset to this figure shows two typical hysteresis loops (magnetization per unit area) for samples electrodeposited at 50 Hz and 1000 Hz, using the external magnetic fields parallel to the NWs. The difference between the values of Ms/A is obviously seen in these two hysteresis loops. As can be seen in Fig. 8, the amount of Ms/A is clearly decreased by increasing the electrodeposition frequency. As shown before, in the high frequency regime, the tunneling current is low and therefore the amount of electrodeposited material is low. This fact was confirmed by our experiments. A very small amount of Co was deposited for a sample made at 1600 Hz and no measurable magnetization was found for samples made at frequencies of 1800 Hz and higher even after deposition for 30 min. In contrast, samples made at 100 Hz visually turn to black after electrodeposition for a very short period of time, as short as 5 s. This is in agreement with our previous results that the absolute value of deposition current was reduced by increasing the frequency, as shown in Fig. 7.
Electrodeposition current (Irms) versus time of Co NWs using 50–1800 Hz sin wave for electrodeposition voltage. The arrow represents increasing of the frequency.

Electrodeposition current and sine wave electrodeposition voltage of Co NWs made at 50, 100, 250, 400, 550, 700, 850, and 1000 Hz.

Variation of saturation magnetization per unit area for Co NW samples prepared at different frequencies. Inset show the hysteresis loop for unit area of Co NW samples electrodeposited at 50 and 1000 Hz.

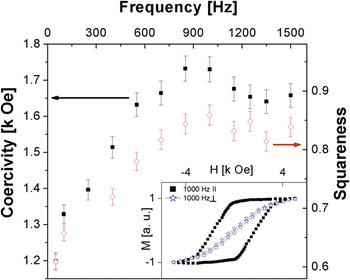
Figure 9 shows the variation of the coercive force and squareness of Co NW samples as a function of frequency obtained from the measurement of the hysteresis loops of the samples. Samples were measured with external magnetic field parallel to the NWs. The inset to this figure shows two typical normalized hysteresis loops of samples electrodeposited at 1000 Hz, using the external magnetic fields parallel and perpendicular to the NWs. The hysteresis loop has a square shape for the case of external magnetic field set parallel to the NWs. It changes to a narrow loop for measurements with external magnetic field perpendicular to the NWs. This strong anisotropy demonstrates that the easy axis is along the growth direction NWs while the hard axis is perpendicular to the NW axis.Reference Sellmyer, Zheng and Skomski31, Reference Stoner and Wohlfarth40 As seen in Fig. 9, the coercivity is increased from 1200 Oe for the sample made at 50 Hz to about 1750 Oe for the samples made at 850 Hz. Further increase in frequency results in decreasing the coercivity to about 1630 Oe for the sample made at 1500 Hz. We were not able to obtain the coercivity of the sample made at 1600 Hz because the amount of electrodeposited Co was so small, the coercivity was below the accuracy of our measurement. In addition, the value of squareness is also increased by increasing the frequency from 0.65 for sample made at 50 Hz to about 0.85 for sample made at 850 Hz. This remains constant for samples made at higher frequencies. These behaviors are in agreement with previously reported experimental results that show that increasing the frequency leads to more uniform deposition and better pore filling.Reference Sharma, Pishko and Grimes26 It has also been confirmed that increasing the electrodeposition frequency causes a rotation of the easy axis from in-plane to being perpendicular to the plane of the samples, thereby increasing the coercive force.Reference Almasi Kashi, Ramazani and Khayyatian37 Both of these effects improve the coercivity and squareness by increasing the frequency.
Coercivity and squareness of Co NWs as a function of frequency. Inset show the normalized hysteresis loops for Co NW samples electrodeposited at 1000 Hz with external magnetic field parallel (║) to the NWs and with external magnetic field perpendicular (┴) to the NWs.

IV. CONCLUSIONS
Anodized aluminum templates were made by two-step anodization of aluminum sheets and used for fabrication of Co NWs using an AC electrodeposition process. The effect of the barrier layer during the electrodeposition process was investigated by comparing the experimental results with a proposed circuit model. This circuit model consists of a series combination of three components: (i) electrolyte resistance, Rs, (ii) a parallel combination of capacitance, CDL, and resistance, RDL, for double layers, and (iii) a parallel combination of the capacitance, CBL, and the resistance, RBL, and the Zener diode, ZDBL, of the barrier layer. The values of coercivity and squareness are increased by increasing the frequency of the electrodeposition voltage from 50 Hz up to 850 Hz. Then these values slightly reduce by further increases in frequency. It is also found that the amount of electrodeposited Co in the cylindrical pores cannot be directly estimated by the value of electrodeposition current Irms. In contrast, the amount of Co electrodeposited in template can be estimated from the difference between the anodic and cathodic half cycles in the electrodeposited current. Higher frequency leads to more symmetrical half cycles, i.e., less electron tunneling and smaller electrodeposited materials. No measurable magnetization was found for samples made at frequencies of 1800 Hz and higher. These results are critical for understanding mechanisms of deposition over AAO templates for magnetic Co NWs that can find application in magnetic storage devices and sensors.