


Introduction
The Accuray M6 cyberknife treatment delivery system was installed at Atomic Energy Cancer Hospital (NORI), Islamabad in June 2022. A cyberknife system is essentially a small 6 MV linear accelerator (LINAC) mounted on an industrial robot that is capable of 6D motions. For real-time imaging of the patient during treatment, two x-ray imaging systems are mounted on the ceiling at 450 angle at the patient’s couch. Reference Dieterich and Gibbs1 The robot can compensate for the patient’s motion during treatment using real-time x-ray images. Reference Dieterich and Pawlicki2,Reference Kannan, Ninan, Chandrasena, Pande and Gupta3 The cyberknife system is capable of delivering high doses to the cranial and extra-cranial targets with sub-millimetre accuracy. Reference Dieterich and Gibbs1,Reference Kannan, Ninan, Chandrasena, Pande and Gupta3 The dose is delivered in single or multiple fractions to the target. 4
The cyberknife consists of three collimation systems: fixed cones (fixed collimators), IRIS and multileaf collimators. The fixed cones and IRIS have 12 circular apertures of diameters 5, 7·5, 10, 12·5, 15, 20, 25, 30, 35, 40, 50 and 60 mm. The beam data commissioning of the cyberknife system requires very rigorous and tedious data acquisition due to the small fields involved in it. Reference Kannan, Ninan, Chandrasena, Pande and Gupta3,Reference Francescon, Kilby, Noll, Masi and Satariano5 For small fields, careful selection of detectors and acquisition parameters is of paramount importance. 6 The precision RayStation treatment planning system (TPS) requires lateral beam profiles which are also called off-centre ratios (OCRs), depths dose profiles and output factors along with absolute dose for 60 mm cone using American Association of physicists (AAPM) TG-51 protocol 7–Reference Almond, Biggs, Coursey, Hanson and Haq9 ). The recommended setup for these measurements is fixed source to axial distance (SAD) which is laborious and cumbersome. The RayStation TPS requires the OCRs to be measured at three depths, that is15, 100 and 300 mm at source to surface distance (SSD) of 785, 700 and 500 millimetres (mm), respectively, for 12 cones and all apertures of the IRIS collimation system.
The Physics Essentials Guide by Accuray describes the method for the acquisition of all the commissioning data. The OCRs can either be measured directly with SAD setup or with SSD setup, which can be scaled to respective SSD later. The TPS accepts only the OCRs measured with the SAD setup. 7
This research aims to compare the OCRs measured with fixed SAD and fixed SSD setups. The OCRs are measured for 12 cones with both SSD and SAD settings and compared with each other. Joane Vale et al. Reference Vale, Campos and Ponte10 made the same comparison for only three cone sizes of 40 mm, 50 mm and 60 mm. The present work aims to expand this work to all cones and with more statistical analysis.
Material and Method
OCRs were measured on the cyberknife M6 system with 12 cones with dimensions 5, 7·5, 10, 12·5, 15, 20, 25, 30, 35, 40, 50 and 60 mm diameters. The dosimetry system used for the measurements was a Sun Nuclear SNC 3D scanning system with a Sun Nuclear diode detector ‘EDGE’ which has an active measuring volume of 0·019 mm3· 11 Before the measurements, the cyberknife LINAC head was aligned perpendicular to the phantom using a pinhole collimator tool, specifically provided for this purpose. After the phantom setting, cross-plane and in-plane scans were performed at two different depths, and the inclination between the phantom and LINAC head was calculated. Minor adjustments were made in the LINAC roll and pitch to ensure the inclination remain under 0·02 degrees. For changing the SSD in fix SAD setup, the LINAC head was moved vertically keeping in mind that inclination should remain below 0·02 degrees.
The OCRs were measured for all cones at three different depths 15, 100 and 300 mm, both with fix SSD = 80 cm setup and fix SAD = 80 cm Setup. For SAD setup, SSD was set at 78·5, 70 and 50 cm for respective depth OCR. Both in-plane and cross-plan OCRs were measured and averaged to get one single profile. This averaged OCR is then exported as a text file compatible with RayStation TPS. This export averages each profile’s left and right halves and then takes half profile to be imported by the TPS. Each point in this final half profile is an average of four points. OCRs are normalised at a central axis value of 1 and listed to three decimal points.
The setup of phantom and LINAC head requires very focused effort and time for each measurement. For fix SAD setting, this effort has to be repeated three times, because for each change of SSD, the perpendicularity of the LINAC head with phantom has to be checked and ensured to be within the 0·02 degrees. For this repetition of work, SAD setup uses more effort, while with fix SSD setting, the phantom has to be setup once
For analysis, each field is analysed at three different regions, that is within the field (from the central axis to 80 per cent dose), penumbra region (from 80 per cent to 20 dose value) and out-of-beam (with dose value less than 20 per cent).
All the OCRs measured with SSD and SAD setup are compared point by point with each other for respective cones and depth. The gamma analysis was also done by arbitrarity selecting the OCR of the SAD technique as the reference OCR for each depth.
Gamma analysis
All the curves were analysed using three different dose distance and distance-to-agreement (DTA) criteria. As cyberknife is a modality of sub-millimetre accuracy so it demands commissioning data to be measured with sub-millimetre resolution. The OCRs were measured for 0·2mm resolution for all cones with Ø≤20mm and 0·5mm for large cones with Ø≥20mm. For DTA, the distance was selected as per the resolution of the OCR. All OCRs were compared to 1%/0·2, 2%/0·2 and 3%/0·2mm. For the calculation of the gamma index, the following formula was used:
 $$\Gamma = \min \left[ {\sqrt {{{\left( {{{\Delta {d_i}\;}}\over{{\Delta D}}} \right)}^2}\; + \;\;{{\left( {{{\Delta {S_i}\;}}\over{{\Delta S}}} \right)}^2}\;\;\;} } \right]$$
where ΔdI is the difference of doses in OCRs of SAD and SSD techniques at any location, ΔSi is the distance between these two points while ΔD and ΔS are two arbitrary constants selected as acceptance criteria. Reference Bacala12,Reference Dowlatabad, Mowlvi, Gorbani and Mohammadi13 In this case, we calculated Γ for ΔD as 1%, 2% and 3% while for ΔS was set to 0·2mm as it is the measurement resolution for the OCR measurements. The points that have a gamma index smaller or equal to 1 are considered as pass while the ones having a larger than 1 value are considered as Fail. The results for the 1%/0·2mm gamma criterion were mostly failing in the penumbra region, while for 3%/0·2mm, all the cones were 100% matching for each region and scan depth. The percentage of passing points for each OCR for the gamma criteria of only 2%/0,2mm is reported in tables.
Results
OCR-15 mm depth
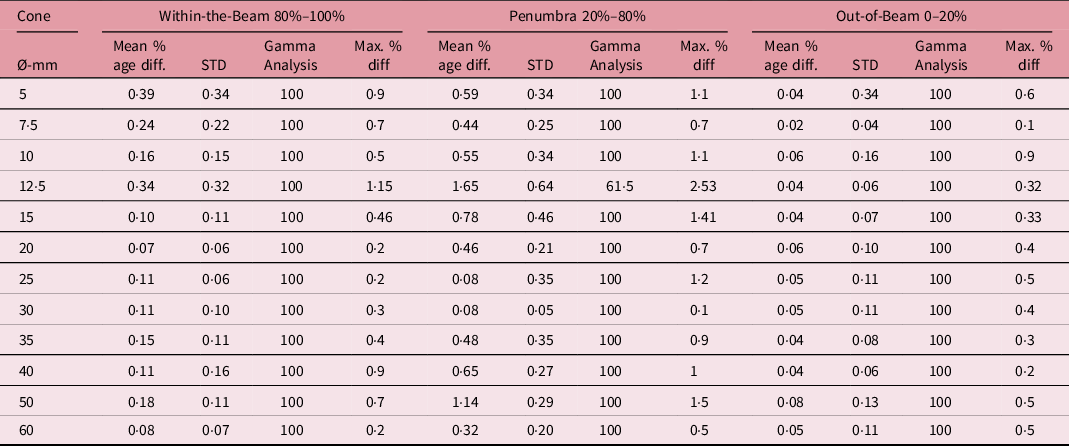
For OCR at a scan depth of 15 mm, the results are tabulated in Table 1. Within the radiation beam (having a dose of more than 80% of the central axis dose and out-of-beam (dose lower than 20%) regions, both SSD and SAD profiles are closely matched. The mean and standard deviation around the mean of the percentage difference in this region is insignificant. Generally, mean percentage difference is higher for smaller cones. The gamma analysis is a 100% match for the gamma criteria of 2%/0·2mm for both regions. The maximum percentage difference between the two profiles is also higher for smaller cones as clear from Table 1.
Comparison of OCR at depth 15mm measured with fixed SAD and fixed SSD setup. The comparison parameters are the mean of the percentage difference and associated standard deviation, gamma analysis with gamma criteria 2%/0·2mm and maximum percentage dose difference

For the penumbra region, the difference is a bit higher as compared to within-the-beam and out-of-beam regions. The maximum percentage difference for all cones is around 1% except for 12·5mm cones which are 2·53%. The mean percentage difference for the penumbra region for all cones is also higher as compared to the other two regions. The gamma analysis for this region also gives 100% results for 2%/0·2mm for all cones except the 12·5 mm cone. For this cone size, only 61·5% pass the gamma criteria.
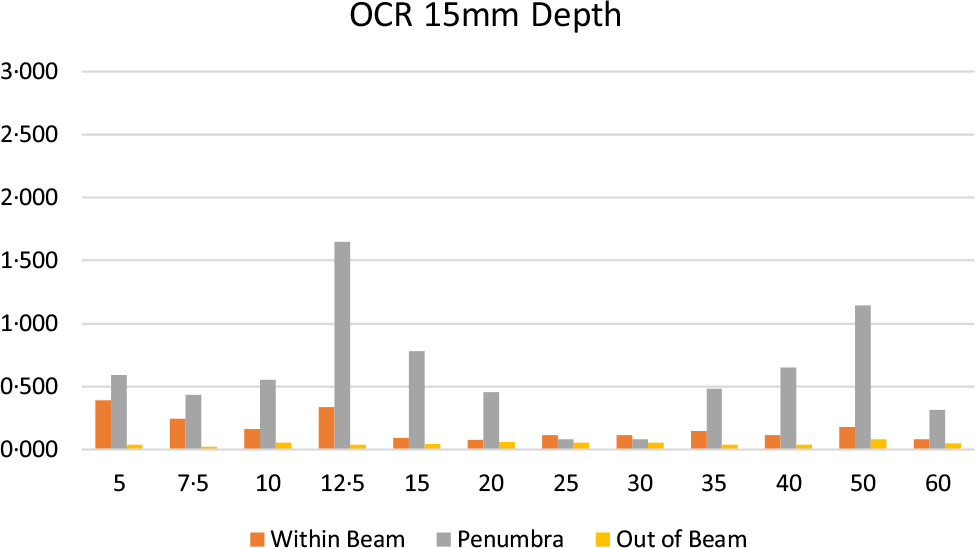
Figure 1 demonstrates the mean of the percentage difference between SSD and SAD setup for OCR-15mm. From the graph, it is clear that the mean percentage difference is higher for smaller cones as compared to larger ones. It is also evident that the mean percentage difference is higher for the penumbra region.
The mean percentage difference in OCRs measured with SSD and SAD setup at depth of 15mm for within-beam, penumbra and out-of-beam regions for all cones.

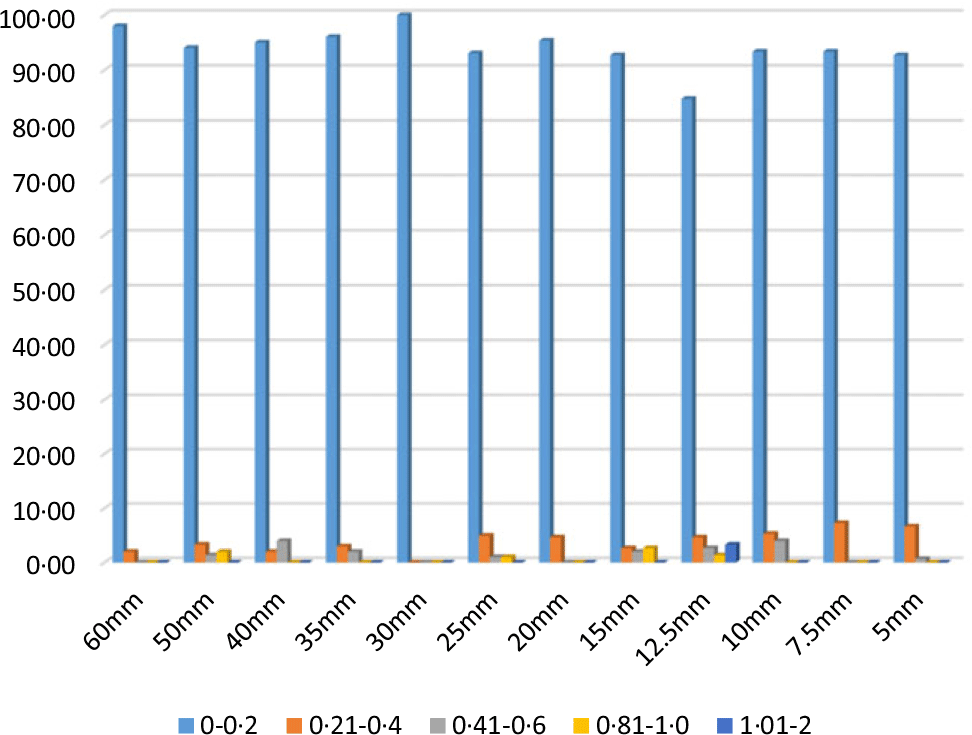
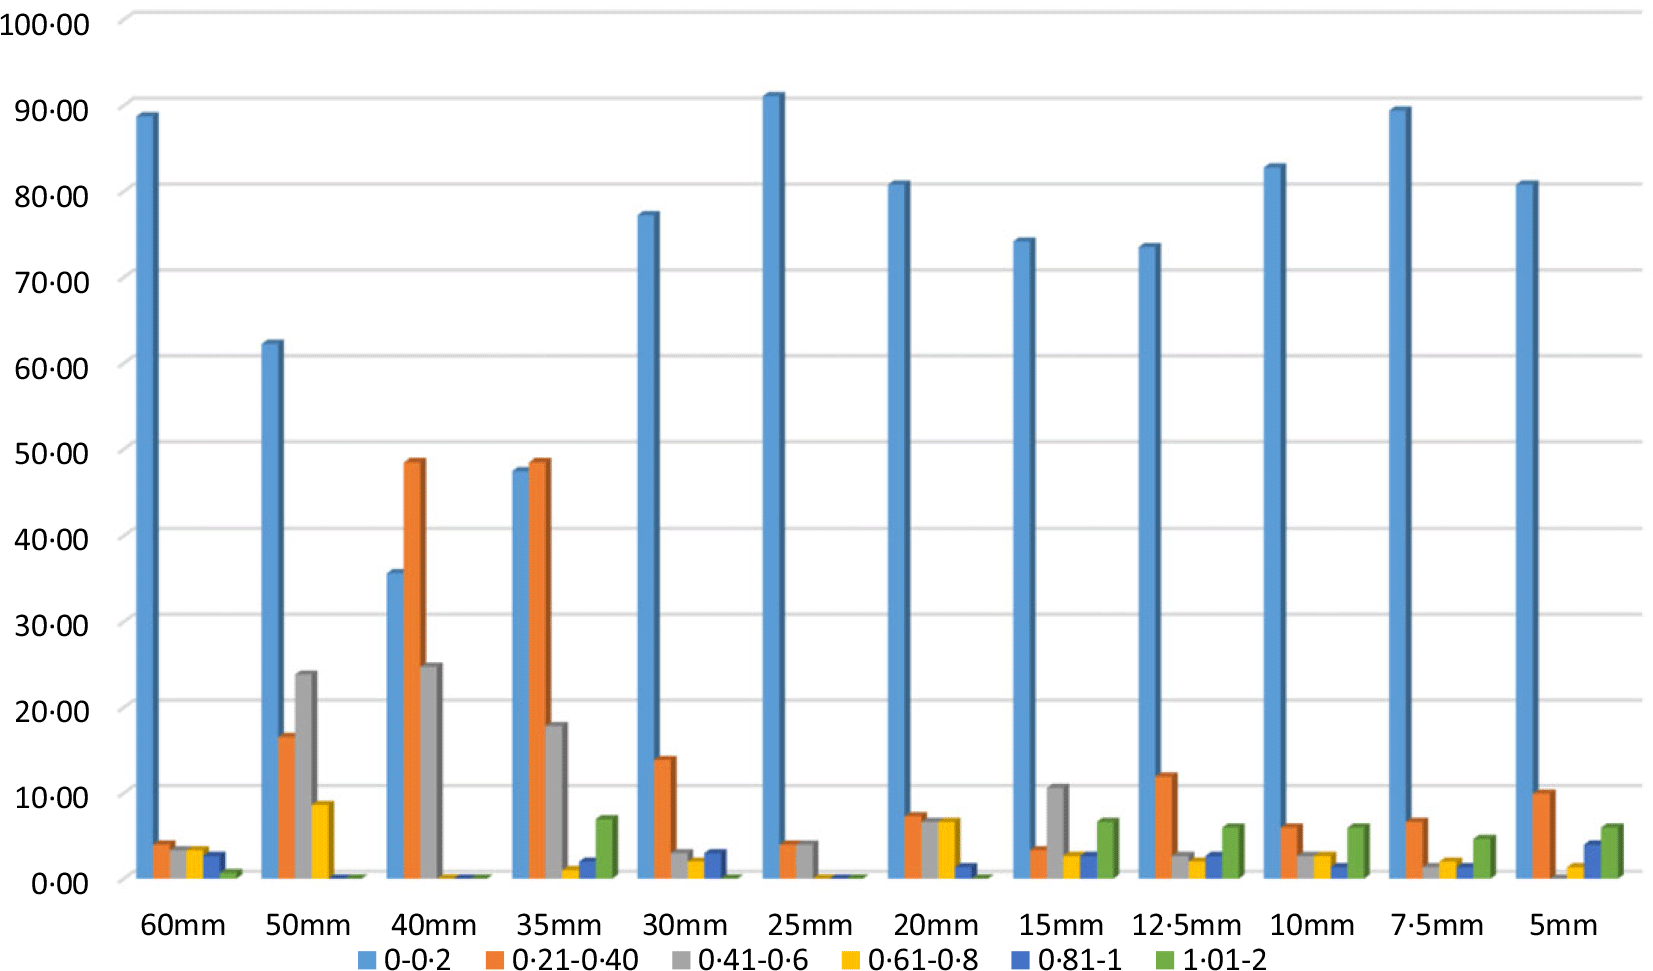
Figure 2 is the bar chart for the percentage of gamma indices in a specific range of values for 2%/0·2mm gamma criteria. For all cones, more than 90% of the gamma index values lie in the 0–0·2 range. A small percentage of points has a value in higher ranges. For larger cones, the percentage of gamma indices in ranges higher than 0·2 is a bit higher than for the smaller cones.
The percentage of gamma indices falling into a specific range of values for all cones for the OCRs measured at a depth of 15mm. For all cones, a significant number of gamma indices fall in the 0–0·2 range.

100 mm depth OCR
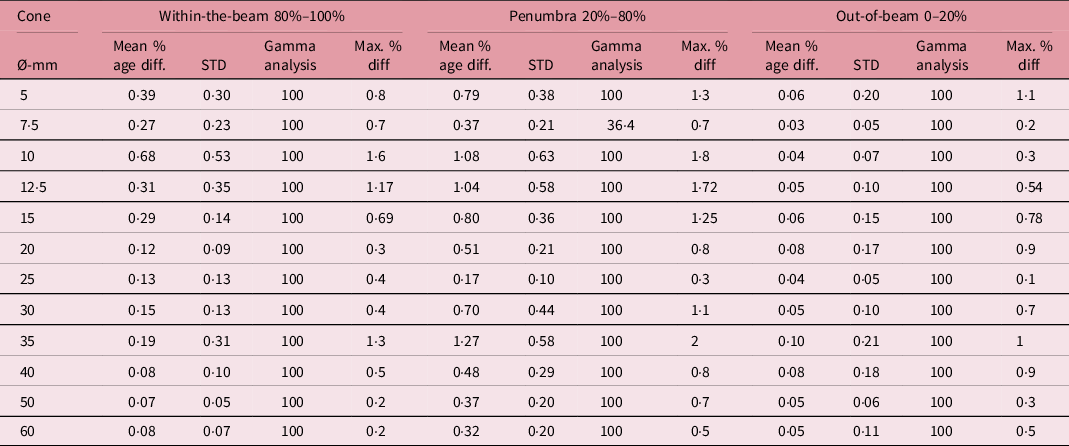
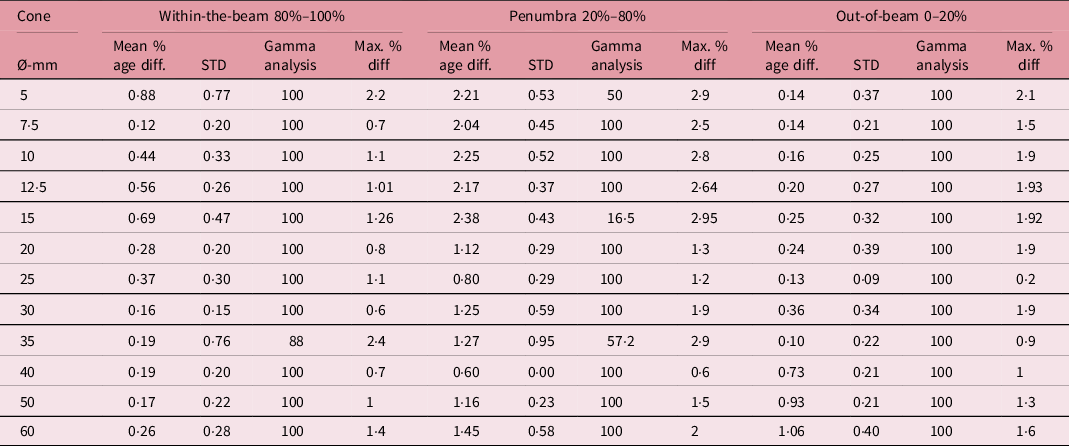
For the penumbra region of OCRs at 100mm depth, all cones except 7·5 mm cone, pass the gamma criteria of 2%/0·2mm. For a 7·5mm cone, only 36·4% of points have a gamma value smaller than 1. The mean percentage difference is also as high as 1·27 with a standard deviation of 0·58. The individual point difference could go up to more than 1·5% for some cones.
For region within the beam and outside of the beam, the mean and standard deviation is lower than the penumbra region. It remains under 0·5 except for the 10 mm cone where it went as high as 0·68 with a standard deviation of 0·53. All the cones have 100% of the points passing the gamma criteria. Generally, smaller cones exhibit a larger difference in all three regions as tabulated in Table 2.
Comparison of OCR at depth 100 mm measured with fixed SAD and fixed SSD setup. The comparison parameters are the mean of the percentage difference and associated standard deviation, gamma analysis with gamma criteria 2%/0·2mm and maximum percentage dose difference

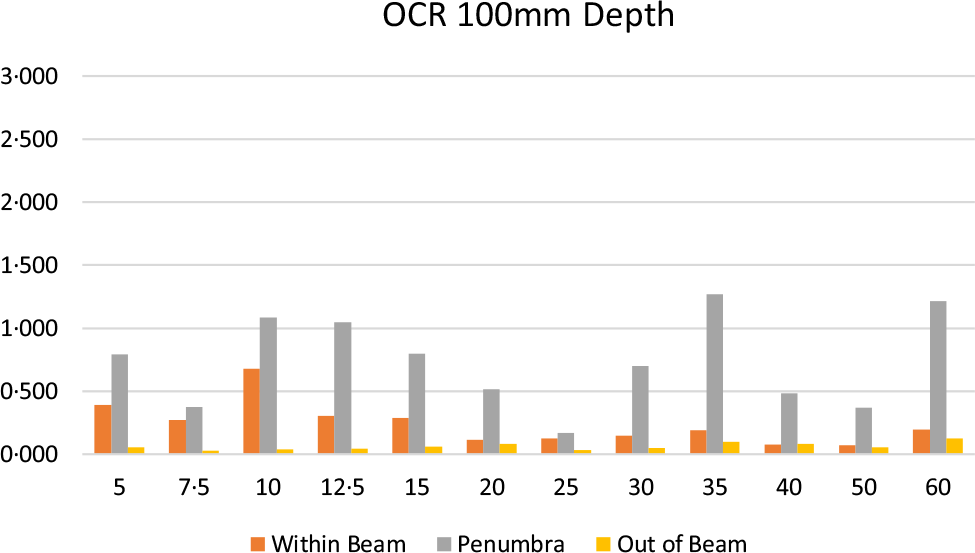
Figure 3 shows the mean percentage difference for all collimators as a bar chart for each region for an OCR depth of 100 mm. It also behaves similarly to OCR 15 mm depth. The smaller cones exhibit a larger mean difference for all three regions. The penumbra region also has a higher mean percentage difference as compared to the within-the-beam and out-of-beam regions.
The mean percentage difference in OCRs measured with SSD and SAD setup at depth of 100mm for within-beam, penumbra and out-of-beam regions for all cones.

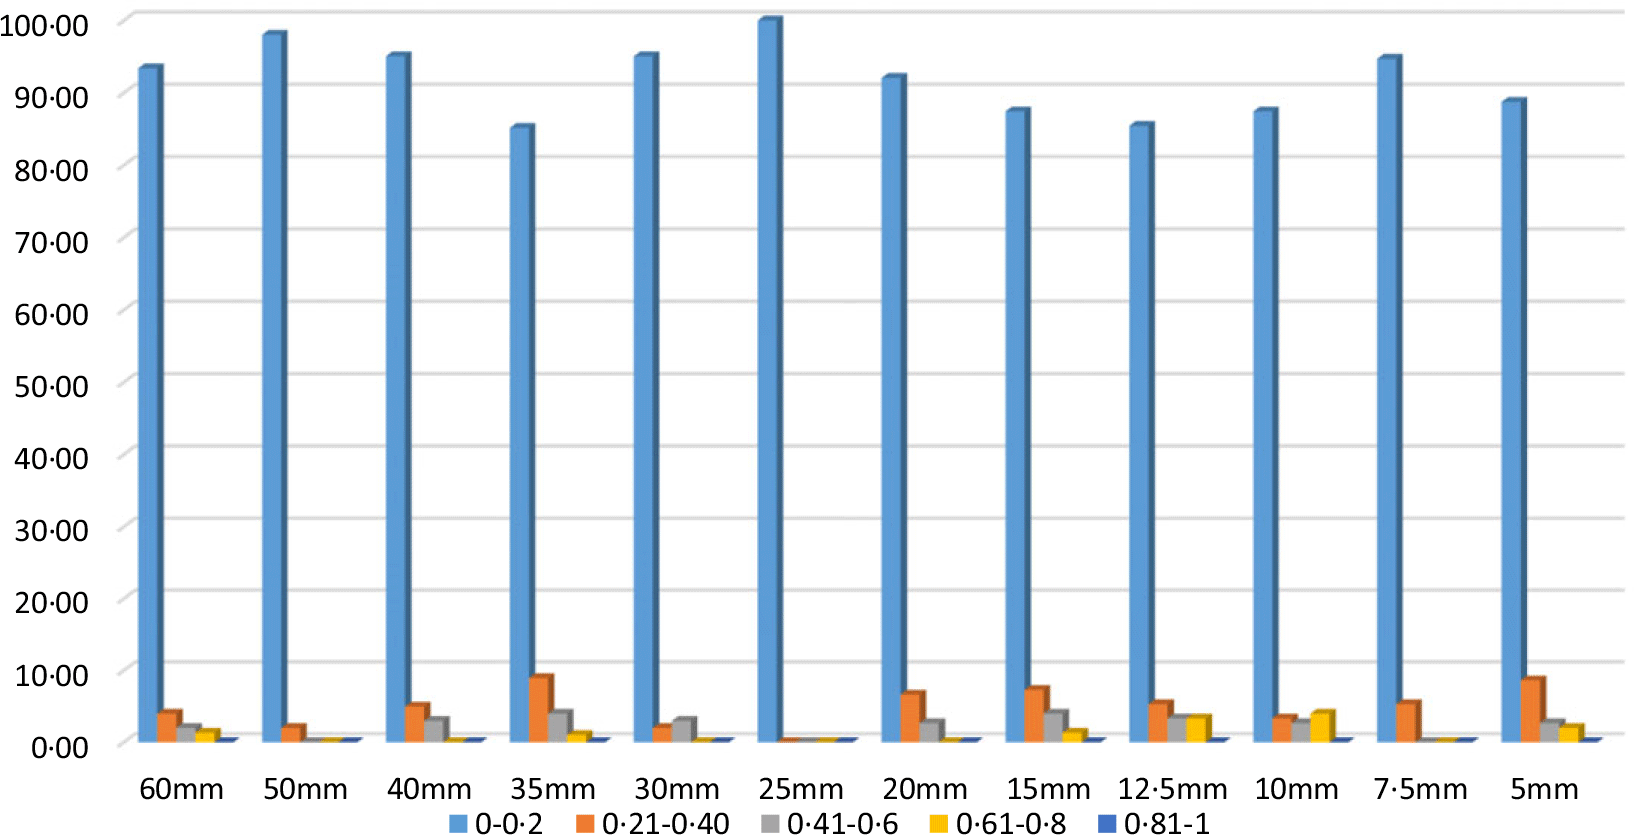
Figure 4 represents the results of gamma analysis with gamma criteria of 2%/0·2mm. For each cone, most of the points have gamma index values lying between the 0–0·2 range with a very small percentage of points in higher ranges. The number and hence percentage of points having a gamma index value of more than 1 are minimal.
The percentage of gamma indices falling into a specific range of values for all cones for the OCRs measured at a depth 100mm. For all cones, a significant number of gamma indices fall in the 0–0·2 range.

300 mm depth OCR
The mean percentage difference is quite high for the OCR at a depth of 300 mm as compared to the OCRs at a depth of 15 and 100mm. Table 3 has the tabulated values of mean percentage difference with standard deviation, gamma analysis for 2%/0·2mm and the highest value of percentage difference between SSD and SAD setup for each cone and three regions for OCR 300mm.
Comparison of OCR at depth 300 mm measured with fix SAD and fix SSD setup. The comparison parameters are the mean of the percentage difference and associated standard deviation, gamma analysis with gamma criteria 2%/0·2mm and maximum percentage dose difference

The mean of the percentage differences within the beam is higher for small cones with the highest being 0·88 ± 0·77% for a 5mm cone. Generally, the mean of percentage difference and standard deviations are higher for small cones within the beam region. For out-of-beam region, the mean percentage difference is higher for larger cones with 1·06 ± 0·4% for the 60 mm cone. In the penumbra region, the mean percentage difference is around 2% with the highest being 2·38 ± 0·43% occurring for the cone of 10mm diameter.
The individual percentage difference at any point is a bit higher for OCR-300mm within-the-beam and out-of-beam region as compared to the same points for OCRs of the other two depths. Generally, the percentage difference between OCRs measured with SSD and SAD setup at 300mm depth is higher for smaller cones than for larger cones. For smaller cones, it is close to above 2% for within-the-beam and out-of-beam region. For the penumbra region, it is just short of three % for some points, the highest being 2·95% for a cone 15mm and 2·64% for a 12·5mm cone.
For out-of-beam region, all cones are passing the gamma criteria of 2%/0·2mm. For within-the-beam region, 100 points passed the gamma criteria for all cones except cone 35mm for which the gamma index is 88%. The maximum difference between the SSD two OCRs occurred for the penumbra region where for cones 5mm, 15mm and 35 mm, gamma indices are 50%, 16·5% and 57·2%. For all other cones, 100% points are passing the gamma criteria.
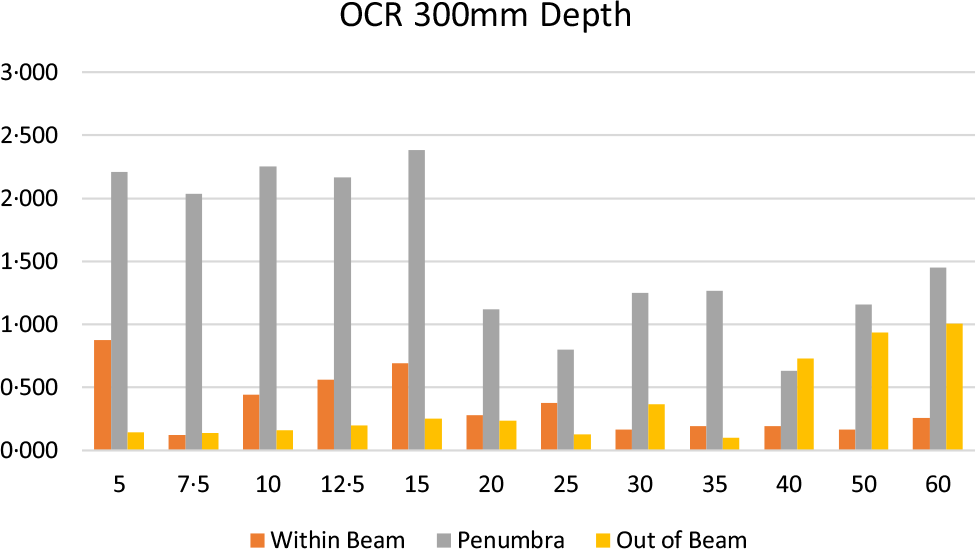
Figure 5 represents the average percentage difference in three regions for OCRs measured at 300 mm depth for all cones. It is quite clear that the maximum difference is in the penumbra region, while within-the-beam and out-of-beam regions, the mean percentage difference is quite low.
The mean percentage difference in OCRs measured with SSD and SAD setup at depth of 300mm for within-beam, penumbra and out-of-beam regions for all cones.

Figure 6 is a visual representation of the percentage of gamma indices falling in a specific range. For most of the cones, an overwhelming majority of gamma indices fall in the 0–0·2 range. For cones of diameter 50mm, 40 mm and 35mm, most of the points lie in a region of the values from 0–0·6. There is also a significant percentage of points having values close to or even greater than 1 for OCR of 300mm depth.
The percentage of gamma indices falling into a specific range of values for all cones for the OCRs measured at depth 300mm. For large cones, a significant number of gamma indices fall in the 0–0·2 range.

Discussion
As discussed in introduction section, the calculation algorithm in RayStation TPS requires the OCRs measured in SAD setting but the measurement setup for fix SAD setting requires more effort and time while the setup for fix SSD is relatively easy and less time-consuming. If the OCRs are measured with SSD setting for the TPS, their results ought to be coinciding with the results of fix SAD setup within an acceptable limit.
The percentage difference between OCRs measured with SSD and SAD setups is different for different regions with the highest in the penumbra region. For any cone and any depth measurement, the OCRs with both techniques do not differ more than 3%. For each region, the percentage dose is generally higher for small cones than for cones of larger diameter. For each beam and either of the depth, within-the-beam and out-of-beam region have minimal percentage difference between the two OCRs. For the penumbra region, the difference is a bit higher than the other two regions. The results are coincident with the findings of earlier work. Reference Vale, Campos and Ponte10
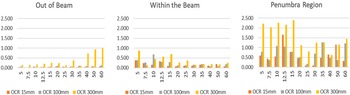
The analysis of the percentage difference concerning the depth of OCR reveals that the average percentage difference between the two setups, averaged over a region, is higher for larger depths of OCRs. This is true for every three regions of the OCR for each cone as evident from Figure 7.
The average percentage difference of SSD and SAD setups for each cone graph concerning the depth of OCR.

Conclusion
From the data in the result and discussion section, it can be concluded that the OCRs for the Accuray Precision TPS can be measured in SSD technique and using SSD correction. The percentage difference in OCRs measured with SSD and SAD techniques is minimal in regions other than the penumbra region and can be ignored for practical purposes. For the penumbra region, this difference can go a bit higher but not more than 3%. This concludes that we can measure OCRs with the SSD technique which required less time and labour. The use of a fixed SSD technique can bring the time of cyberknife commissioning down to weeks instead of months. For more emphasis on accuracy, the SAD technique may be considered for larger depths, for example 300 mm, while for smaller depths, for example 100 mm and 15 mm, OCRs can be measured with the SSD technique to save time and effort.
Acknowledgements
The authors acknowledge the contributions of Dr. Muhammad Basim Kakakhel (Pakistan Institute of Engineering and Applied Sciences) for his guidance and support in data analysis and preparation of the manuscript for this research. We are also in debt to Mr. Rizwan Hameed, Medical Physicist, Ghurki trust teaching hospital Lahore, Pakistan for his assistance and support during data acquisition and in general for the commissioning of the cyberknife.
Source of Financial Support
NIL.
Conflict of Interest
NIL.