Introduction
Since Seiyama reported SnO2 as a semiconductor materials in 1962 [Reference Seiyama and Kagawa1], SnO2 has been widely reported for lithium battery materials [Reference Zhu, Lu, Aruna, Aurbach and Gedanken2], sensors [Reference Yuasa, Masaki, Kida, Shimanoe and Yamazoe3], and photocatalyst [Reference Begum, Devi and Ahmaruzzaman4] due to its excellent optical properties, gas-sensing properties, low toxicity, poorly absorption by the body [Reference Begum, Devi and Ahmaruzzaman4], and chemical stability. SnO2 is also widely regarded as a very good semiconductor for photocatalytic degradation of organic matter [Reference Tammina and Mandal5]. Although pure SnO2 displays many advantages, it can only harvest ultraviolet light like TiO2 [Reference Liu, Hou and Qu6, Reference Paz, Luo, Rabenberg and Heller7] and ZnO [Reference Huber, Puchinger, Ahmad, Madel, Bauer and Thonke8] due to its large bandwidth 3.6–4.2 eV [Reference Bhattacharjee, Ahmaruzzaman and Sinha9]. On the other hand, the electrons excited from the valence band can easily combine with holes, thus decreasing its quantum efficiency. Therefore, to improve the visible photocatalytic activity of SnO2, it is deemed essential if the material is intended to be targeted for efficient use of the sunlight. To solve the abovementioned problems, semiconductor composition and band regulation are very important means. But in some cases, toxic metal oxide or noble metal was composited with SnO2 to improve its performance [Reference Yuasa, Masaki, Kida, Shimanoe and Yamazoe3]. It is worried that these materials applied in the environment can cause potential environmental problems, so it is urgent to find a nontoxic material to composite with SnO2.
Among many other semiconductor materials, Bi2O3 has attracted much interest because it is a p-type and no toxic semiconductor with the narrow band gap of 2.85 eV [Reference He, Xu, Cheng, Yu and Ho10] (monoclinic Bi2O3, α-Bi2O3) and 2.58 eV (tetragonal Bi2O3, β-Bi2O3) [Reference Qiu, Yang, Fan, Zuo, Shao, Xu, Yang and Yang11]. So both phase of Bi2O3 can absorb the visible solar light more effectively than SnO2 and is widely used in water splitting [Reference Hsieh, Lee, Chen, Chen, Ma, Horng, Chen and Wu12], gas sensing [Reference Gou, Li, Wang, Chen and Wexler13], and photocatalysis [Reference Maruthamani, Vadivel, Kumaravel, Saravanakumar, Paul, Dhar, Habibiyangjeh, Manikandan and Ramadoss14]. In our earlier work, a novel n–p SnO2/Bi2O3 composite was synthesized by template-free one-step solid-state reaction synthesis. The SnO2/Bi2O3 composite showed good photocatalytic activity, but such activity is exhibited only α-Bi2O3 phase [Reference Qiu, Liu, Cai, Zhou, Chen, Huang and Feng15]. Additionally, it is reported that β-Bi2O3 nanowires showed higher photocatalytic activity than that of Degussa TiO2 P25 and α-Bi2O3 nanowires [Reference Qiu, Yang, Fan, Zuo, Shao, Xu, Yang and Yang11]. Therefore, synthesizing a novel composite of n–p SnO2/Bi2O3 with β-Bi2O3 phase to promote the visible photocatalytic activity is highly necessary.
It is well known that crystal size, micromorphology, crystal structure, crystallization, and surface defects play key roles on photocatalytic capability of semiconductors. It is evident from literature that the above mentioned characteristics are modified due to the presence of template reagent. It is reported that the use of surfactants makes the crystalline phase of the composite more stable [Reference Li, Li, Zhang, Feng and Li16]. Polyvinyl alcohol (PVA) is a polymer that is odorless and nontoxic, and has a white or yellowish flocculate, flaky, or powdery solid appearance. PVA is often used as a dispersant to prevent particle agglomeration during the synthesis of samples [Reference Sarmah and Kumar17] and can also be used as a compacting and sintering aid [Reference Siegel, Ramasamy, Hahn, Li, Lu and Gronsky18]. Here, we report the synthesis of n–p SnO2/α-Bi2O3/β-Bi2O3 using PVA as dispersant by solid-state reaction. The influence of PVA addition on the microstructure characteristics of n–p SnO2/α ∼ Bi2O3/β ∼ Bi2O3 was investigated. It was found that small size (approximately 18 nm) with narrow distribution, well-dispersed, and well-crystallized composite formed only by one step. The micromorphology, microstructure, optical properties, and photocatalytic capability of the composite to Rh.B were studied in detail. To our knowledge, no study reported on the PVP modulating characteristics of n–p SnO2/α ∼ Bi2O3/β ∼ Bi2O3 nanoparticles prepared by solid-state synthesis method till now. The aim of this work was to prepare a novel n–p SnO2/α ∼ Bi2O3/β ∼ Bi2O3 with a better visible photocatalytic activity, and to better understand the mechanisms involved in the solid phase synthesis process that modulated by PVA.
Results and discussion
XRD spectrogram of samples
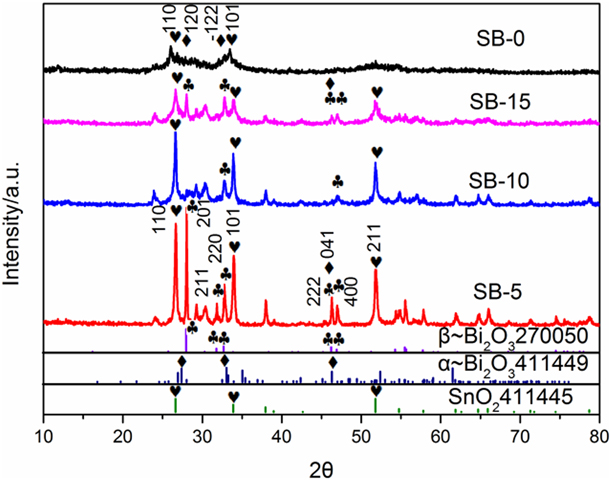
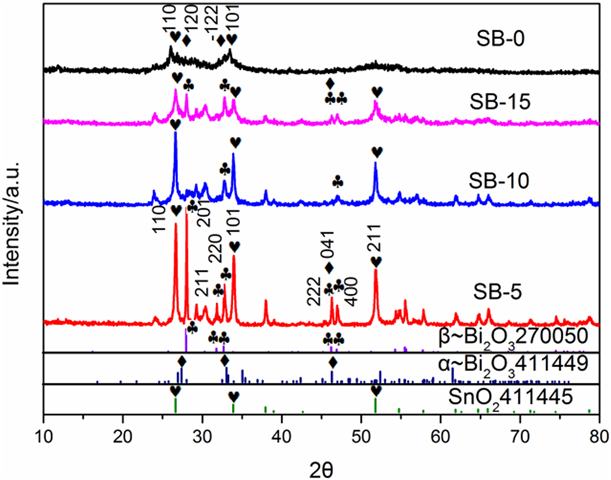
The X-ray diffraction (XRD) spectrogram of samples are shown in Fig. 1 where (220) (2θ = 32.691°), (201) (2θ = 27.946°), (211) (2θ = 30.283°), (222) (2θ = 46.218°), and (400) (2θ = 46.903°) of tetragonal Bi2O3 (β ∼ Bi2O3) are obviously observed, which are well indexed with JCPD card No. 27-0050; the space group is P-421c (114) and cell: 7.742 × 7.742 × 5.631. SnO2(110) (101) (211) (200) are well indexed with tetragonal rutile phase (JCPD card No. 41-1445); the space group is P42/mnm (136) and cell: 4.7382 × 4.7382 × 3.1871. Compared with SB-0, the use of PVA increased the crystallinity of the composite. The full width at half maximum of the XRD peaks first decreases and then increases with increasing of PVA dosage. There is a weak peak of α ∼ Bi2O3 (041) in SB-5 and SB-15 but it totally disappears in SB-10. Nevertheless, the presence of α ∼ Bi2O3 can be confirmed by high-resolution transmission electron microscopy (HR-TEM) analyses as shown in Fig. 2. Additionally, α ∼ Bi2O3 (120) and  $\left( {\bar{1}22} \right)$ of SB-0 can be observed but overlapped those of SnO2 (110) and (101) [Reference Qiu, Liu, Cai, Zhou, Chen, Huang and Feng15].
XRD spectrogram of the as-prepared samples.
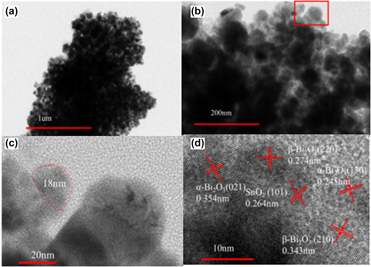
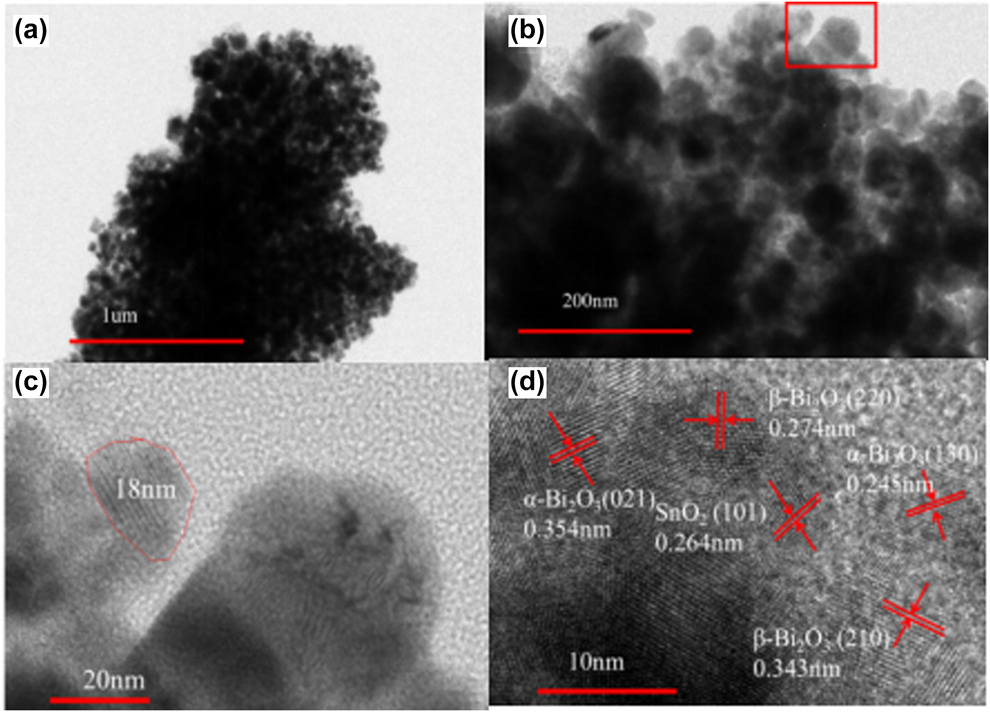
HR-TEM spectrogram of sample SB-15: (a) 1 μm magnification, (b) 200 nm magnification, (c) 20 nm magnification, and (d) 10 nm magnification.
The size and facet distance of nanoparticles can be calculated by Scherrer formula (1) and Bragg formula (2),
 $$D = {{K\lambda } \over {B\;\cos \;\theta }}\quad ,$$
 $$2d \cdot \sin \;\theta {\rm{\ }} = {\rm{\ }}n\lambda \quad ,$$
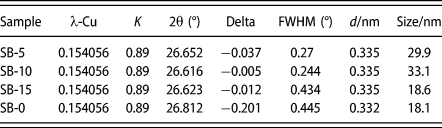
where D represents average particle size (nm), k = 0.89, θ is Brag angle of the peak, λ = 1.5406 nm, B is half-peak width, d is facet distance, and n is interference grade. SnO2 (110) (2θ = 26.611°) was selected to calculate the distance of the facets and the size of the particles. Compared with SB-0 as illustrated in Table I, the size of all the PVA modulated composites is larger than that without PVA. And it first increases and then decreases from 22.9 nm and 33.1 nm to 18.6 nm for SB-5, SB-10, and SB-15 respectively. These results indicate that the crystal size depends severely on the PVA dosage. Compared with the standard JCPD card No. 41-1445, the 2θ value of 26.611° for all the composites has a Stokes shift (as shown in Table I), which means some of bismuth ions entered the lattice of tin oxide. The absence of pure peaks of SnO2 confirms that Bi ions act as interstitial instead of substitutional dopant [Reference Gnanam and Rajendran19]. Compared with that of SB-0, the Stokes shift gets smaller with the usage of PVA (as shown in Table I), Delta is −0.201, −0.037, −0.005, and −0.012 for SB-0, SB-5, SB-10, and SB-15, respectively, the shift of 2θ value is related to the change of lattice constants.
The crystal size and full width at half maximum of the as-prepared samples.a

a Instruction: Delta is the error between the 2θ value of the synthesized sample and the 2θ value in the standard card.
High-resolution transmission electron microscopy
From high-resolution transmission electron microscopy [Fig. 2(a)], it clearly shows that spherical-shaped nanoparticles have been formed with the average size about 18 nm for sample SB-15, which is in well accordance with that calculated by Scherrer formula as shown in Table I where the size of the SB-15 calculated is 18.6 nm. The facet distance of SnO2(101) (d = 0.264), β ∼ Bi2O3(220) (d = 0.274), (210) (d = 0.343), and α ∼ Bi2O3(021) (d = 0.354), (130) (d = 0.245) clearly confirms that the composite of tetragonal structure of SnO2, β ∼ Bi2O3, and α ∼ Bi2O3 has been synthesized successfully. The coexisting of the three phase may herald special photocatalytic capability. Here PVA plays a key role in the formation of the three phase because the substitute of PVA with CTAB can only get SnO2/β ∼ Bi2O3 and that without any template can only get SnO2/α ∼ Bi2O3 in our test.
XPS analysis of the as-prepared samples
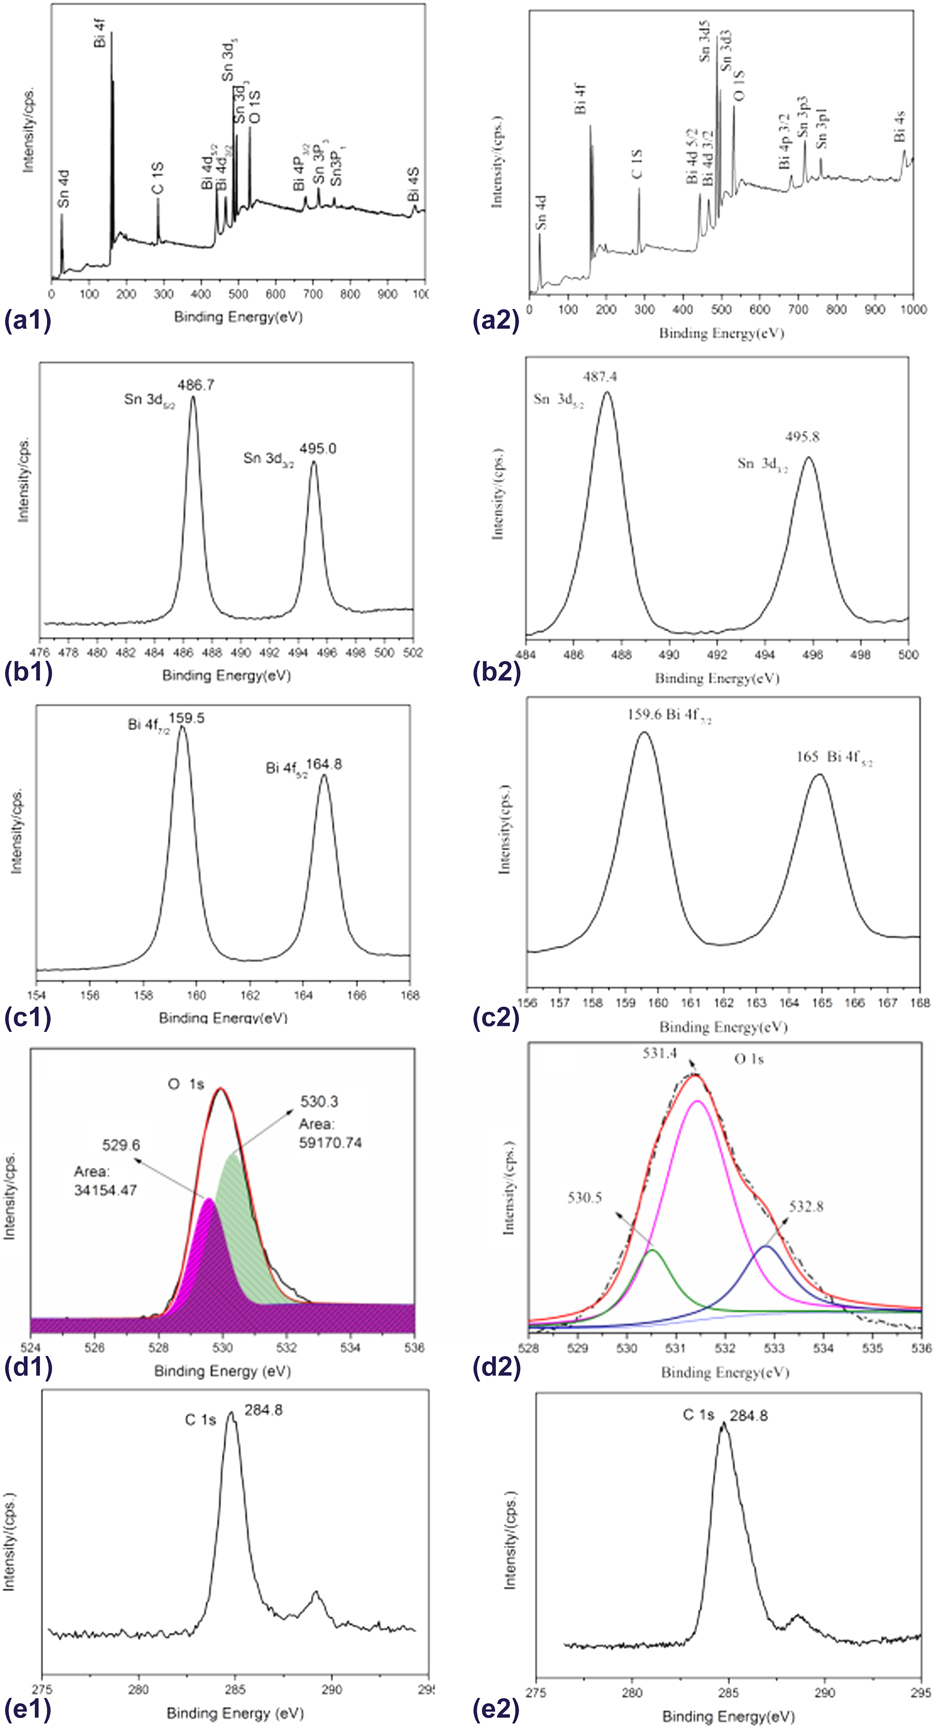
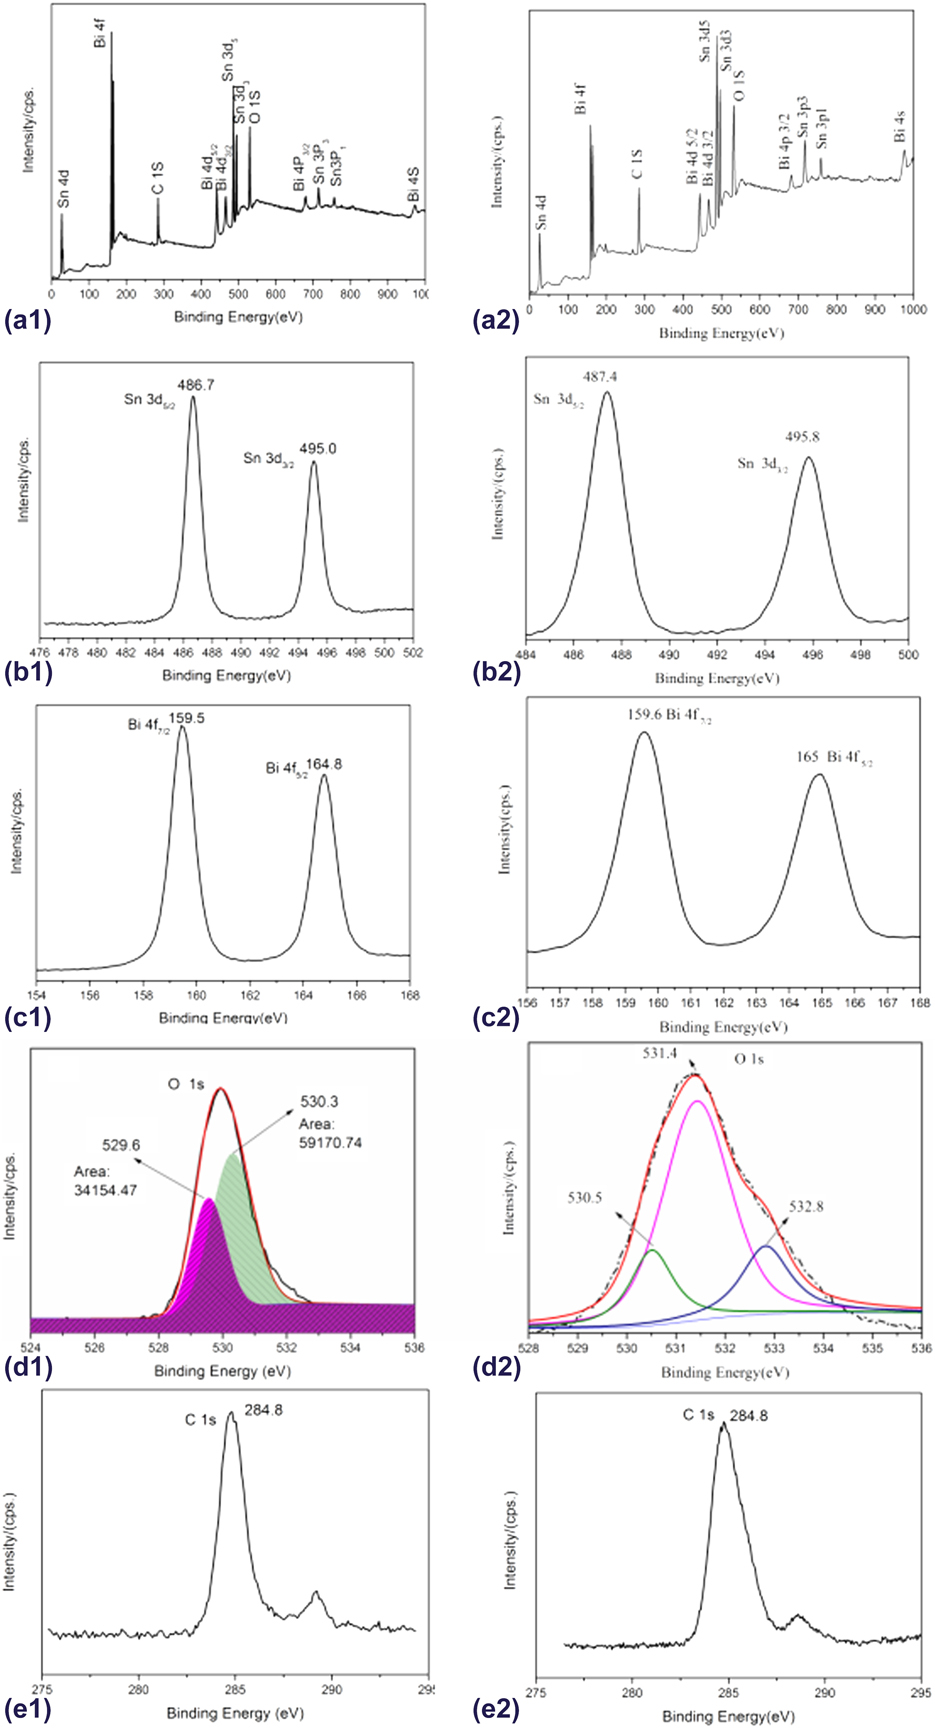
To further confirm the composition of the synthesized composites, SB-15 and SB-0 were selected for XPS characterization. Figures 3(a1) and 3(a2) represent full-spectrum scans of SB-15 and SB-0, respectively. The high-resolution scanning spectrum of Sn element is shown in Figs. 3(b1) and 3(b2). The 3d 5/2 binding energy of Sn element in SB-15 and SB-0 reduced from 487.4 to 486.7 eV, and the addition of PVA changed the morphology of SnO2 and lead to the coexisting of β ∼ Bi2O3 and α ∼ Bi2O3, so the contact interface among the three of them resulting in a change in binding energy. Binding energy of SB-15 located at 159.5 eV in Fig. 3(c1) is ascribed to Bi 4f 7/2 of β ∼ Bi2O3 and that of SB-0 located at 159.6 eV in Fig. 3(c2) is ascribed to α ∼ Bi2O3 [Reference Qiu, Liu, Cai, Zhou, Chen, Huang and Feng15]. The minor shift of binding energy confirms the existing of β ∼ Bi2O3. Figures 3(d1) and 3(d2) are high-resolution spectra of O 1s. It can be seen from Fig. 3(d1) that binding energy located at 529.6 eV is ascribed to Bi–O bond [Reference Hao, Huang, Guo, Du and Zhang20], whereas it cannot be observed in the sample SB-0 as shown in Fig. 3(d2), which may be ascribed that the use of 15% PVA makes the contact surface of SnO2 and Bi2O3 more distinct than that of SB-0 as shown in Fig. 4(d). Because XPS is a surface analysis technique, binding energy of Bi–O bond in SB-0 cannot be detected when most of Bi2O3 nanosheets are covered by SnO2 nanoparticles as shown in Fig. 4(a). The binding energy located at 531.4 eV in Fig. 3(d2) is ascribed to O–H bond [Reference Qiu, Liu, Cai, Zhou, Chen, Huang and Feng15] and 530.3 eV in Fig. 3(d1) and 530.5 eV in Fig. 3(d2) is ascribed to Sn–O bond [Reference Yang, Fan and Yang21] of SnO2 respectively. And that located at 532.8 eV in Fig. 3(d2) is ascribed to the surface loosely bound oxygen species [Reference Zhang, Xie, Zhang, Zhang and Xiong22]. The ratio of the O 1s peak area of the Sn–O bond to that of Bi–O bond is 59170.74:34154.47 = 1.73. So the n(SnO2:Bi2O3) = n(O–SnO2) × 1/2:n(O–Bi2O3) × 2/3 = 1.3:1; the ratio of Bi2O3 in the composite calculated is about 43.5%, which is in well accordance with the energy dispersive spectroscopy (EDS) analysis as shown in Table II, where the ratio of Bi2O3 calculated in the composite is about 43.2%. Figures 3(e1) and 3(e2) are high-resolution spectra of C 1s. The binding energy located at 284.8 eV is amorphous carbon.
XPS analysis of survey scanning (a1): Sn 3d (b1), Bi 4f (c1), O 1s (d1), and C 1s (e1) for sample SB-15, respectively, and XPS analysis of survey scanning (a2): Sn 3d (b2), Bi 4f (c2), O 1s (d2), and C 1s (e2) for SB-0, respectively.
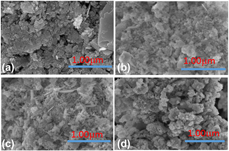
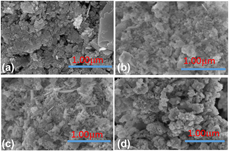
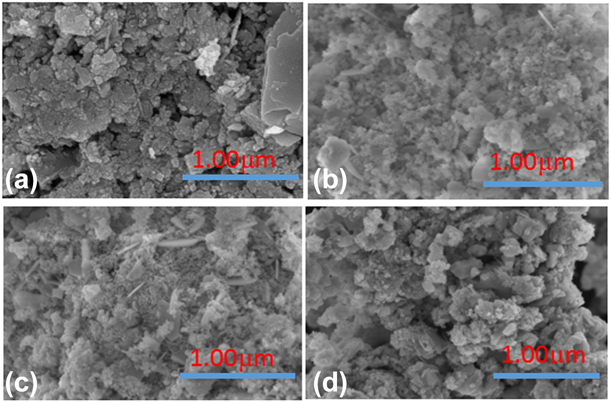
FE-SEM image of (a) SB-0, (b) SB-5, (c) SB-10, and (d) SB-15.
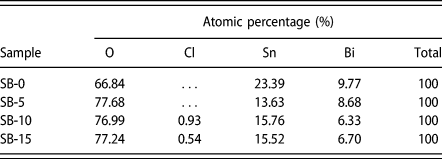
EDS analysis of as-prepared samples.
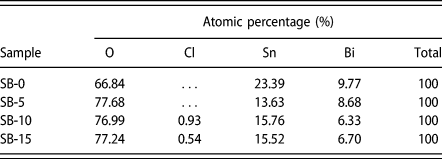
The analysis of FE-SEM spectrum and EDS of as-prepared samples
When the size of the particles decreases, the surface area increases rapidly, resulting in an increase in surface energy. In this case, the particles will aggregate to reduce surface energy. As we can see sample SB-0 from Fig. 4(a), most of SnO2 particles aggregated closely on the surface of α ∼ Bi2O3. Although there is no obvious change for PVA composite in crystal phase as observed from XRD but morphological change is obviously observed. The use of PVA reduced particle aggregation and made it change from flake-like particles as shown in Figs. 4(b) and 4(c) to polyhedron particles in Fig. 4(d), where the interface between SnO2 and Bi2O3 can be clearly observed. Although SB-0 has almost the same particle size (18.1 nm) as that of SB-15 (18.6 nm), the use of 15% PVA made the sample become high dispersion. The different particle size and morphology reveal the key role of dosage of PVA in controlling the nucleation especially to the morphology and structure of Bi2O3 in the composite.
FE-SEM–based EDS analysis is shown in S1. It confirms that the nanoparticles mainly consist of Sn, Bi, O, and Cl elements. At the end of the calcination process, the rest of PVA was decomposed from the composite under the 500 °C for 2 h. And the average Sn/Bi atomic ratio are 2.39:1, 2.48:1, and 2.32:1 for SB-0, SB-10, and SB-15, respectively, which are slightly higher than 2:1 of the theoretic value, which indicates a relatively higher SnO2 percentage at the surface of SnO2/Bi2O3 nanoparticles, whereas the average Sn/Bi atomic ratio is 1.57:1 for SB-5. The lower content usage of PVA is conducive to the generation of Bi2O3; in other words, PVA gives priority to regulate the formation of Bi2O3 when low dosage is used. It is in well indexed with XRD spectrogram in Fig. 1, where the facets (201), (220), (200) of β ∼ Bi2O3 diffractive peaks of the sample SB-5 are significantly stronger than that of SB-10, SB-15, and SB-0. The presence of a little chloride element from Fig. S1 is due to the fact that PVA caused a lot of foam in the precursor hindered the cleaning process. It is shown in Table II that in all samples modulated by PVA, the oxygen content is significantly higher than in samples that did not use PVA, which shows that as the crystallization of the composite increases, the oxygen defect decreases, leading to an increase of oxygen content.
Analysis of UV-Vis diffuse reflectance spectra
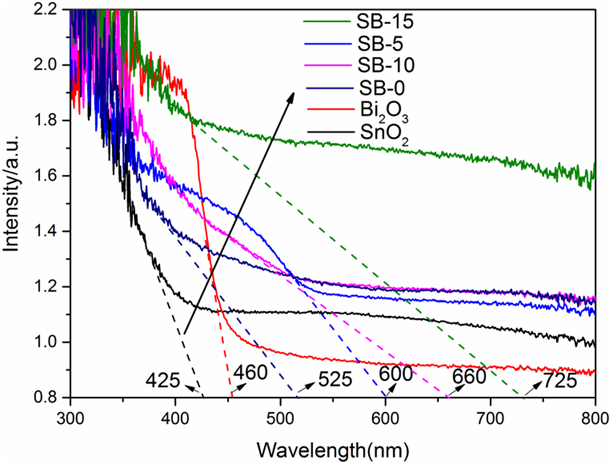
The optical properties of semiconductor materials depend on the energy gap, impurity centers, surface roughness, and their oxygen vacancies [Reference Tammina and Mandal5]. Figure 5 shows UV-Vis diffuse reflectance spectra of the as-prepared samples. Pure SnO2 shows the highest absorption at about 300 nm and the light absorption edge of it is 425 nm, and pure Bi2O3 shows very good visible light absorption capability at about 420–460 nm. Compared with pure SnO2 and Bi2O3, all the composites are red shift in the absorption spectrum. The light absorption edges are 525 nm, 600 nm, 660 nm, and 725 nm for SB-0, SB-5, SB-10, and SB-15 respectively. This analysis demonstrates that the composite of SnO2/α ∼ Bi2O3/β ∼ Bi2O3 heterojunction is effective for the photon absorption in the visible light. And this enhanced visible light absorption ability of as-prepared sample might herald the increase of the decolorization of Rh.B solution.
UV-Vis diffuse reflectance spectra of the as-prepared sample.
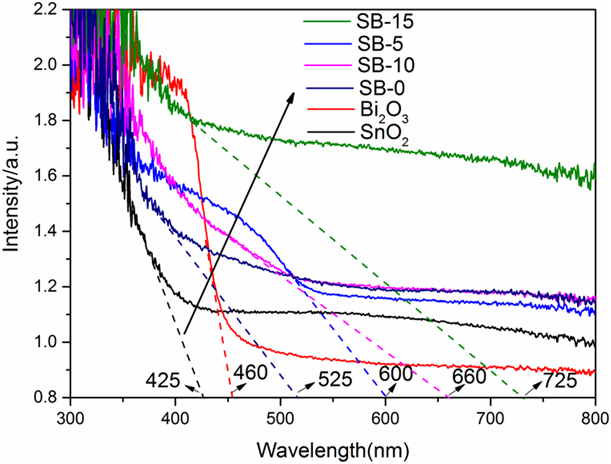
The band gap of semiconductor (energy gap, E g) can be calculated by Tauc plot by the following formula (3):
 $${\left( {ahv} \right)^{{1 / n}}} = A\left( {hv - {E_{\rm{g}}}} \right)\quad ,$$
where E g is the forbidden width of a semiconductor, a is the index of absorption, h is Planck constant, v is frequency, A is a constant, and for direct semiconductor: n = 1/2 and for indirect semiconductor n = 2.
In composite of SnO2/α ∼ Bi2O3/β ∼ Bi2O3, both α ∼ Bi2O3 and SnO2 are direct semiconductors [Reference Bian, Ma, Shang, Tan and Pan23]. So the direct energy gap of the composite can be calculated by taking n = 1/2. Taking (ahv)1/n as y axis and hv as x axis, extrapolating the straight part of (ahv)2 against hv plot to the point of x axis, the band gaps calculated are 2.41 eV, 2.71 eV, and 2.30 eV for SB-5, SB-10, and SB-15, respectively, as shown in Fig. S2(a). They are 3.50 and 2.85 eV for pure SnO2 and Bi2O3 as shown in Fig. S2(c) and 2.98 eV for SB-0 as shown in Fig. S2(d). Compared with others, the band gap of SB-15 becomes the smallest of all the composite. In composite of SnO2/α ∼ Bi2O3/β ∼ Bi2O3, β ∼ Bi2O3 is a kind of indirect semiconductor [Reference Dolocan and Iova24], so the indirect band gaps of the composites are calculated in the same way as that of the direct band gap ones but taking n as 2. The band gaps are 2.19, 2.34, and 2.00 eV for SB-5, SB-10, and SB-15 as shown in Fig. S2(b). Usually, the surface defects and distortion of the lattice will lead to the decrease of the band gap. It is deduced that SB-5 and SB-0 will have narrower band gaps. But based on the analysis of XRD spectrogram, Stokes shifts are smaller for SB-15 and SB-10 than that of SB-5 and SB-0, while both of them have narrower band gaps, which means here the surface defects and distortion of the lattice are not the main reason for the changes of the band gap. The particle size also has a significant influence on the band gap of semiconductors. As the size of the surface atoms increases, the nucleus must be rearranged to release energy from the system, resulting in a widening of the band gap [Reference Hafaiedh and Bouarissa25]. The particle size of SB-15 is 18.6 nm, which is smaller than that of others, so this is the reason why the band gap of SB-15 gets narrower than that of others. Although the particle size is 18.1 nm for SB-0, the Stokes shifts is bigger (Delta is −0.201 for SB-0), which makes SnO2 and Bi2O3 strongly influence each other as shown in Fig. 4 FE-SEM spectrogram where most of Bi2O3 nanosheets are covered by SnO2 nanoparticles. Therefore, the sample SB-0 showed more light absorption characteristics of SnO2. The decrease in the band gap reduces the energy required to stimulate electrons of the valence band and facilitates the use of light in a wider scope.
Analysis of photoluminescence spectrum of as-prepared samples
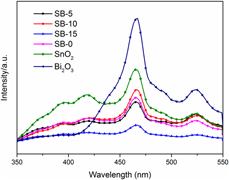
PL spectrum is the result of emission, which produced by the recombination of photoexcited carriers, and lower PL peak intensity means slower recombination [Reference Xie, Lü, Chen, Zhao, Song and Lu26]. The 270 nm (4.59 eV) excitation wavelength separated from the Xenon lamp is used to excite the composites. Figure 6 shows the room temperature PL spectrum of n–p SnO2/α ∼ Bi2O3/β ∼ Bi2O3 nanoparticles. All the composited samples exhibit lower emission peaks than that of pure SnO2 and Bi2O3. And the result also indicates the more efficient separation rate of the photoexcited electrons and holes in SB-15 structure than that of SB-5 and SB-10 composites, which suggests that a heterojunction structure is formed [Reference Seza, Soleimani, Naseri, Soltaninejad, Montazeri, Sadrnezhaad, Mohammadi, Moghadam, Forouzandeh and Amin27]. The PL spectrum shows a strong peak at blue emission close to 465 nm (2.6 eV). It has been speculated that if the emission wavelength is smaller than the energy of the bandwidth, the main reason for the light emission should be ascribed to the oxygen vacancy and the interstitial defect in the crystal [Reference Kim, Lee and Yoon28]. Since the emission values are lower than the band gap of SnO2 (E g = 3.55 eV) and α ∼ Bi2O3 (E g = 2.85 eV), but a little bit higher than that of β ∼ Bi2O3 (E g ≈ 2.58 eV), it is inferred that the broad blue emission to electron transition is partly mediated by defect levels in the band gap such as oxygen vacancies and tin interstitials. Jin et al. [Reference Jin, Choi, Chang, Dong, Jin, Lee, Park and Song29] also reported that the PL peak at 2.4 eV was related to oxygen vacancies. In the present study, oxygen vacancy and lattice disorder at the interface and size reduction of the particle should be the main reason of the blue emission. As shown in Table I, for composite SB-15, the Stokes shifts is the smallest (Delta is −0.012) and the particle size is small (18.6 nm), which permits a facile transfer of the photoelectrons and holes to the surface of the composite, thus increasing the separation efficiency, so the emission peak is the lowest.
Photoluminescence spectrum of as-prepared samples.
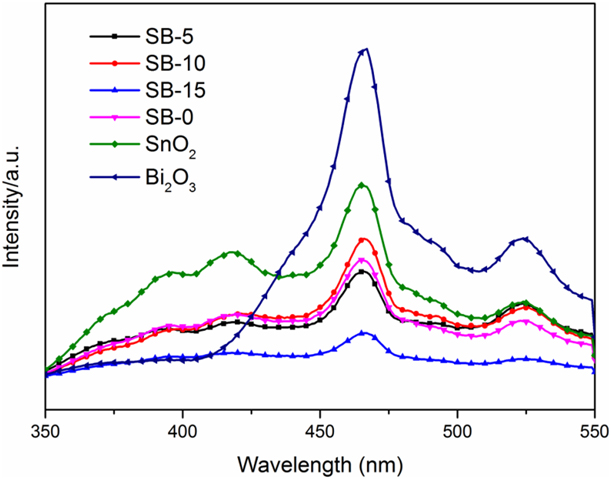
Analysis of photocurrent of as-prepared samples
To further confirm the separation effect of photocurrent carriers, photocurrent test was undergone on CHI1030B electrochemical workstation. As shown in Fig. S3, the photocurrent generated by the SB-15 sample under visible light is significantly higher than that of the SB-5, SB-10, and SB-0. Therefore, it is concluded that the appropriate amount of PVA is of utmost importance. The easily removed PVA polymer material can achieve surface charge regulation during photocatalysis and can also ensure the performance of n–p materials.
Analysis of Brunauer–Emmett–Teller (BET) surface area and BJH pore size
Figure S4(a) shows the nitrogen adsorption/desorption isotherm of the as-synthesized nanomaterials. Both SB-15 and SB-0 have a classic type IV isotherm with a type H3 hysteresis loop resulted from the quadratic capillary condensation at an intermediate relative pressure (p/p 0) of 0.4–0.9, which indicates the presence of a highly mesoporous structure [Reference Wang, Fei, Deng, Lou, Wang and Zhang30]. S4(b) and S4(c) shows the BJH pore size distribution plot of SB-15 and SB-0. Based on the desorption branch of the nitrogen adsorption isotherm, 4 nm and 10–15 nm pores take the highest proportion in SB-0, whereas there is about 4 nm and 5–10 nm pore size distribution in SB-15. The difference of the pore size distribution may lead to the difference of the adsorption capability. The surface area is 37.7 m2/g and 59.6 m2/g for SB-15 and SB-0, respectively.
Analysis of FTIR spectra of as-prepared samples
The FT-IR spectra of as-prepared samples in the wave number range 500–4000 cm−1 are shown in S5. The absorption band in the region 472 cm−1 is corresponding to Sn–O symmetric vibration [Reference Gu, Fen Wang, Song, Lü, Qi, Jun Zhou, Xu and Yuan31]. This is ascribed that the metal-oxygen vibrations on the surface layer lead to the forces on the atoms. Hence, FT-IR spectroscopy confirms the formation of SnO2. The 23 cm−1 blue shift from SB-0 (449 cm−1) to SB-15 (472 cm−1) means length of bond shortens and bounding energy of Sn–O increases with the dosage of PVA. This is in accordance with analysis of XRD spectra where it facilitates the formation of separate crystals. The wave number near 3400 cm−1 is attributed to stretching vibration of OH groups that comes from adsorption water molecules [Reference Parthibavarman, Vallalperuman, Sathishkumar, Durairaj and Thavamani32] and also attributed to the stretching vibrations of Sn–OH groups [Reference Bhattacharjee and Ahmaruzzaman33]. When increasing the dosage of temperature from 0 to 15% PVA, the intensity of the peak about 3400 cm−1 decreases. It implies that reaction (4) may take place when the dosage of PVA is increased thereby transforming the Sn–OH group into tin oxide.
 $${\rm{Sn}} - {\rm{OH\ }} + {\rm{\ Sn}} - {\rm{OH}} \to {\rm{\ Sn}} - {\rm{O}} - {\rm{Sn\ }} + {\rm{\ }}{{\rm{H}}_2}{\rm{O}}\quad .$$
The absorption peaks at about 1328–1362 cm−1 as shown in S5(a) and S5(b) are due to stretching vibration of Bi–O bond of Bi2O3 [Reference Maruthamani, Vadivel, Kumaravel, Saravanakumar, Paul, Dhar, Habibiyangjeh, Manikandan and Ramadoss14]. The 16 cm−1 blue shift from SB-5 (1328 cm−1) to SB-15 (1344 cm−1) means length of bond shortens and bounding energy of Bi–O increases with the dosage of PVA. The peaks at about 1641 cm−1 as shown in S4(b) are attributed to bending vibration of adsorbed water molecules [Reference Uchiyama, Shirai and Kozuka34].
Mechanism of the formation of as-prepared samples
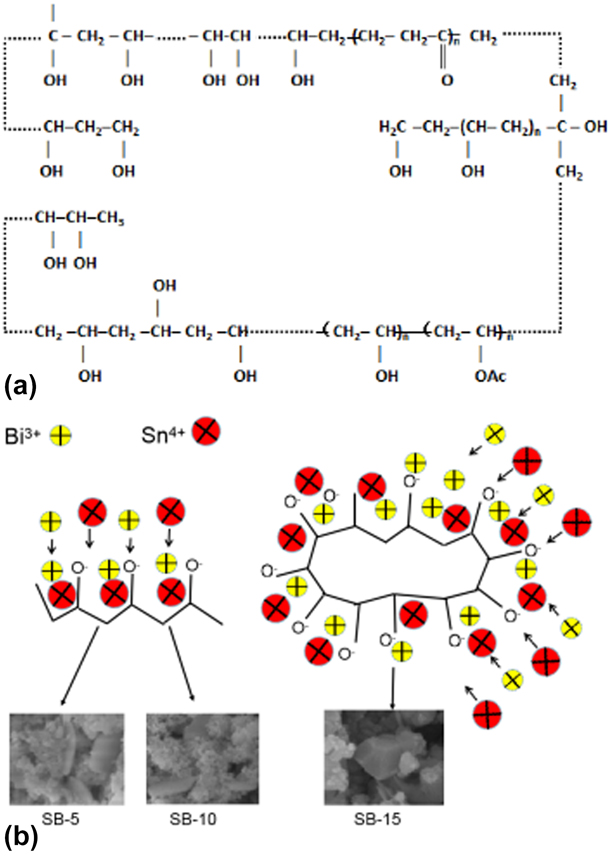
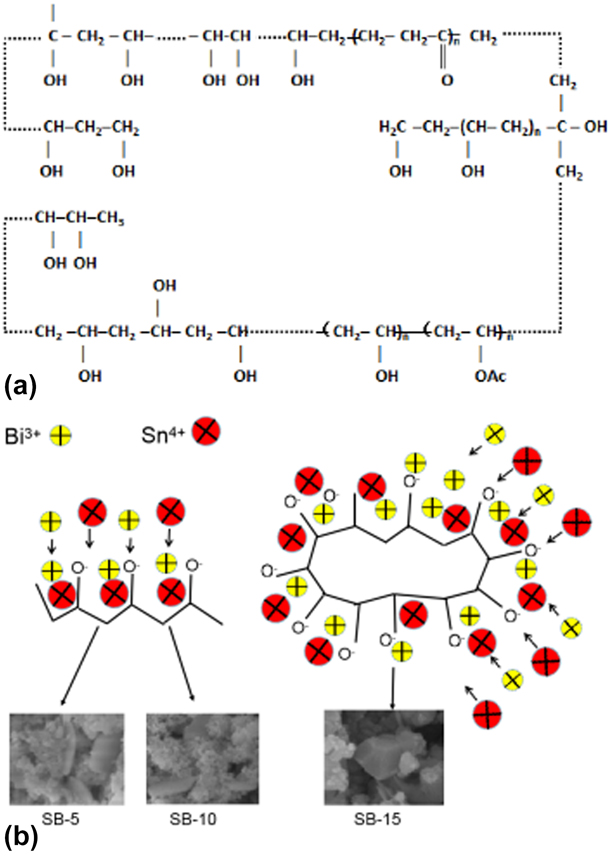
SnO2 can be formed by thermal decomposition of Sn(OH)4 as shown in formulas (5) and (6), when calcination temperature gets up to 350 °C as confirmed by our previous report [Reference Qiu, Liu, Cai, Zhou, Chen, Huang and Feng15]. Bi2O3 can be formed by the decomposition of BiOCl, which comes from Bi(OH)3 + Cl‒ → BiOCl + H2O as shown in formulas (7) and (8). Because the k sp of BiOCl is 1.0 × 10⁻³¹, which is less than that of Bi(OH)3 (k sp = 4.0 × 10⁻³⁰), Bi(OH)3 is cline to become BiOCl; with the increase of temperature, more Bi2O3 can be produced by BiOCl and OH–as shown in formula (9). According to literature [Reference Bian, Ma, Shang, Tan and Pan23], the calcination temperature 367 °C can make the phase transform from β ∼ Bi2O3 → α ∼ Bi2O3 as shown in formula (10), and calcination at 500 °C for 2 h can totally get n–p SnO2/α ∼ Bi2O3 composite and it is already confirmed by our previous research [Reference Qiu, Liu, Cai, Zhou, Chen, Huang and Feng15]. But in the present work, PVA makes β ∼ Bi2O3 as the main phase of n–p SnO2/α ∼ Bi2O3/β ∼ Bi2O3 even when the calcination temperature was kept at 500 °C for 2 h as shown in formula (11). PVA has hydrophilic groups and hydrophobic groups as shown in Fig. 7(a). Under alkaline conditions, the hydrophilic groups on the PVA side chain are ionized and negatively charged. Under electrostatic action, Sn4+ and Bi3+ in the precursor are close to O− and form coordination bonds. In this way, a large number of Sn4+ and Bi3+ are distributed along the PVA main chain. The number of hydrophilic groups is different with the concentration of the PVA in the mixture. Therefore the amount of binding to metal ions is also different. As the PVA dose increases, the metal ions are oriented. The precipitate begins to form when the ion concentration reaches the solubility product constant of the precursor. As shown in Fig. 7(b), when the PVA concentration is low, flake Bi2O3 and granular SnO2 are formed, and when the PVA concentration reaches up to 15%, the surfactants are arranged centrally from all directions to form polyhedral Bi2O3 and granular SnO2.
 $${\rm{SnC}}{{\rm{l}}_4} \cdot 5{{\rm{H}}_2}{\rm{O\ }} + {\rm{NaOH\ }} \to {\rm{\ Sn}}{\left( {{\rm{OH}}} \right)_4} + {\rm{NaCl}}\quad ,$$
 $${\rm{Sn}}{\left( {{\rm{OH}}} \right)_4} \to {\rm{Sn}}{{\rm{O}}_2} + {{\rm{H}}_2}{\rm{O}}\quad ,$$
 $${\rm{Bi}}{\left( {{\rm{N}}{{\rm{O}}_3}} \right)_3} \cdot 5{{\rm{H}}_2}{\rm{O\ }} + {\rm{NaOH}} \to {\rm{Bi}}{\left( {{\rm{OH}}} \right)_3} + {\rm{NaN}}{{\rm{O}}_3}\quad ,$$
 $${\rm{Bi}}{\left( {{\rm{OH}}} \right)_3} + {\rm{C}}{{\rm{l}}^ - } \to {\rm{BiOCl}} + {{\rm{H}}_2}{\rm{O}}\quad ,$$
 $${\rm{BiOCl}} + {\rm{O}}{{\rm{H}}^ - } \to {\rm{B}}{{\rm{i}}_2}{{\rm{O}}_3} + {\rm{C}}{{\rm{l}}^ - }\quad ,$$
 $$\beta \;\sim\;{\rm{B}}{{\rm{i}}_2}{{\rm{O}}_3} \to \alpha \;\sim\;{\rm{B}}{{\rm{i}}_2}{{\rm{O}}_3}\;\left( {367\;^\circ {\rm{C}}} \right)\quad ,$$
 $$\beta \;\sim\;{\rm{B}}{{\rm{i}}_2}{{\rm{O}}_3} + {\rm{PVA}} \to \beta \;\sim\;{\rm{B}}{{\rm{i}}_2}{{\rm{O}}_3} + \alpha \;\sim\;{\rm{B}}{{\rm{i}}_2}{{\rm{O}}_3}\;\left( {500\;^\circ {\rm{C}}} \right)\quad .$$
Microstructure of PVA (a); the formation mechanism of composites modulated by different dosage of PVA (b).
Photocatalytic assessments of as-prepared samples
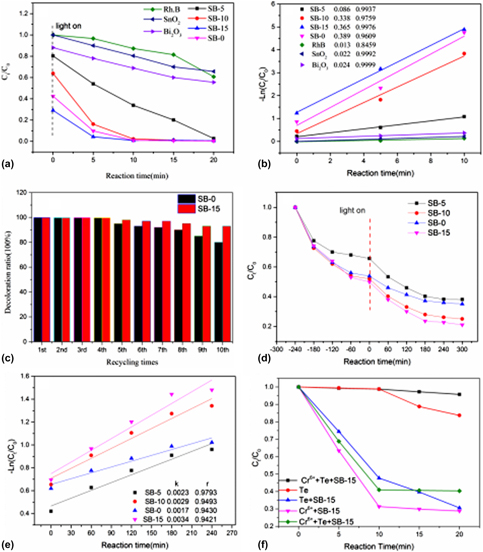
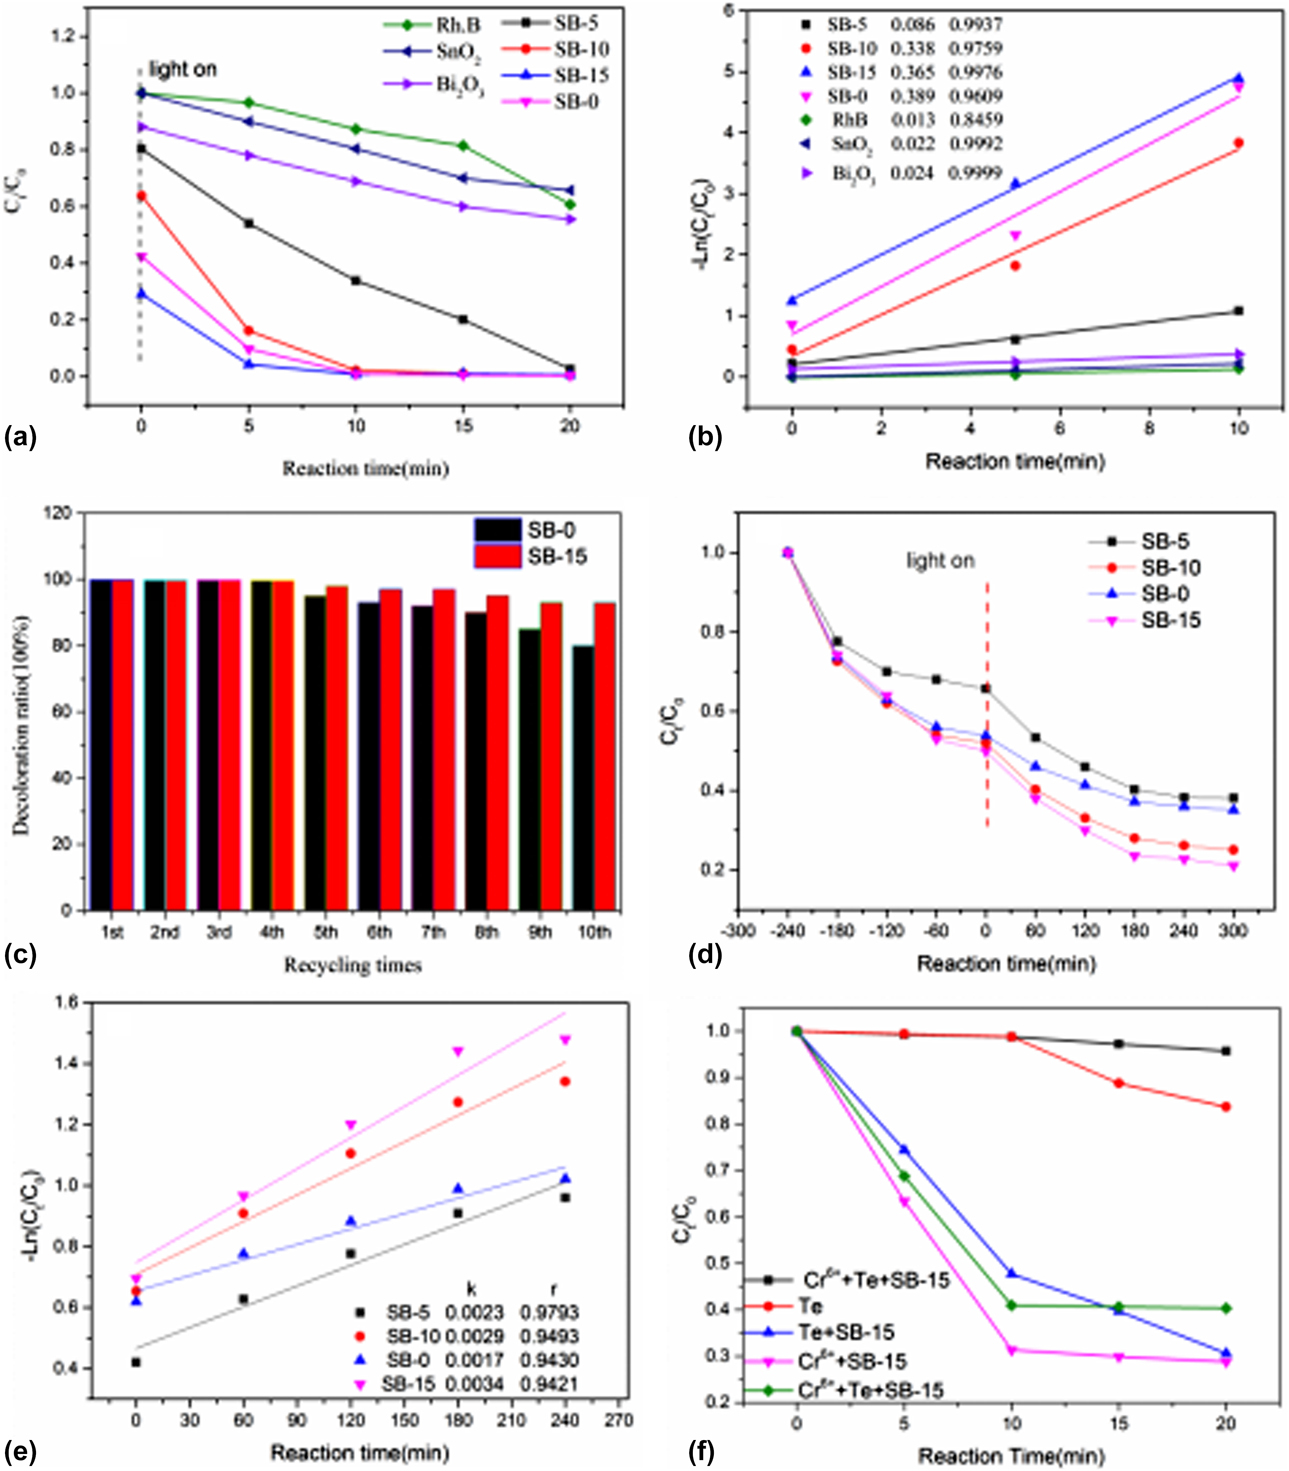
From Fig. 8(a), all the composited samples shows higher photocatalytic capability than that of pure SnO2 and Bi2O3 under gold halide irradiation. The adsorption capacity increased with the increase of PVA, and the order of adsorption capacity is SB-15 > SB-0 > SB-10 > SB-5 > Bi2O3 > SnO2. About 75% Rh.B was adsorbed on the surface of SB-15 and 99% Rh.B was decolorized in only 5 min. About 2 and 10% Rh.B was adsorbed on the surface of pure SnO2 and pure Bi2O3, and 30 and 40% Rh.B was decolorized in 20 min for SnO2 and Bi2O3, respectively. It indicates that the surface adsorption plays a key role in decolorization of Rh.B. Additionally, both the increases of the visible light absorption and the higher separation rate of photocarriers may be responsible for the higher photocatalytic capability of SB-15 composite than that of others.
Photocatalytic capability of as-synthesized samples under halide lamp (a), under xenon lamp (d); kinetics of photocatalytic degradation of Rh.B under halide lamp (b), under Xenon lamp (e); and recycling utilization of photocatalyst (c). Photocatalytic capability of Te and Cr6+ by SB-15 under irradiation of halide lamp (f). **The initial concentration of Rh.B is 5 mg/L and 10 mg/L under gold halide lamp and xenon lamp, respectively.
As shown in Fig. 8(b), most of the plots match well with the first-order reaction kinetics, and the rate of the reaction can be obtained as formula (12),
 $$- {\rm{Ln}}\;\left( {{{{C_t}} / {{C_0}}}} \right){\rm{\ }} = {\rm{\ }}{k_{{\rm{app}}}}t\quad ,$$
where k app is the rate constant determined by plotting −Ln (C t/C 0) versus the reaction time (t), and C 0 and C t are concentration before and after decolorization of dye, respectively. Figure 8(b) represents the plot of −Ln (C t/C 0) versus irradiation time (t) for Rh.B. The fitting results show that there is a high degree of linear correlation between them. The rate constants were calculated and the kinetics coefficient are 0.086 min−1, 0.338 min−1, 0.365 min−1, and 0.389 min−1 for SB-5, SB-10, SB-15, and SB-0, respectively, which are all higher than that of pure SnO2 (0.022 min−1) and Bi2O3 (0.024 min−1). Figure 8(c) shows the recycling utilization capability of the samples SB-15 and SB-0. It is obvious to see that after 10 times recycling utilization, decolorization ratio still kept 90% for SB-15, which is about 10% higher than that of SB-0. To test the decolorization capability of high concentration Rh.B under visible light, 50 mL Rh.B (with initial concentration 10 mg/L) solution was irradiated by 500 W Xenon lamp for 300 min with SB-15 dosage 1 g/L. As shown in Fig. 8(d), about 80%, 72%, 62%, and 60% Rh.B were decolorized in 300 min for SB-15, SB-10, SB-0, and SB-5, respectively. The kinetics coefficients are 0.0034 min−1, 0.0029 min−1, 0.0017 min−1, and 0.0023 min−1 for SB-15, SB-10, SB-0, and SB-5, respectively, as shown in Fig. 8(e), which means SB-15 shows better photocatalytic capability even under visible light. The high crystallinity and easier electrons transferring of SB-15 might be the main reason of it. To testify the degradation effect of SB-15 on other pollutants, tetracycline (marked as Te, with the initial concentration 20 mg/L) and Cr6+(with the initial concentration 5 mg/L) were irradiated under 400 W gold halogen lamp after adsorption and desorption equilibrium in the dark for 4 h. From Fig. 8(f), the degradation ratio of Te by Cr6+ is very limited (less than 5%) and that of Te without any catalyst is about 15%. When SB-15 was used in the solution, about 90% Te was degraded within 30 min (data not shown) and about 70% Cr6+ was degraded within 20 min, whereas it is only about 60% for Te in the coexisting system (Te with Cr6+ solution with the same concentration as above mentioned test), which is ascribed that Cr6+ is reduced to Cr3+ when obtaining photoelectrons from CB (conduction band) of SB-15, and when Cr3+ accumulates in the solution with time, it is oxidized to Cr6+ by holes of VB (valance band) of SB-15. This reversible process eventually allows Cr3+ and Cr6+ ions to reach a concentration equilibrium. Electrons are lost when Cr3+ is reoxidized to Cr6+. These electrons may be recombined with holes of VB of SB-15. Therefore, the photocatalytic capability of Te is reduced.
Photocatalytic mechanism of n–p SnO2/α ∼ Bi2O3/β ∼ Bi2O3
The active species scavenging experiments were acted according to literature [Reference Yang, Guo, Liu, Xing, Guo, Zhang, Wan and Huo35], where benzoquinone (BQ), ethylenediaminetetraacetic acid disodium salt (EDTA-2Na), and isopropanol (IPA) were used to detect superoxide radicals (•O2−), holes (h+), and hydroxyl radicals (•OH), respectively. A 10 mM scavenger was added to 50 mL Rh.B solution under the same condition as the photocatalytic test. And the degradation ability of Rh.B solution without any scavengers was compared. As shown in Fig. S6, solution with IPA had almost no influence on the degradation of Rh.B, whereas benzoquinone (BQ) and EDTA-2Na greatly suppressed the degradation of Rh.B, which means (•O2−), holes (h+) are the main active species.
In general, when a semiconductor is exposed to light radiation (h ν ≥ E g), electron and hole pairs (hVB+–eCB−) are generated and meanwhile the reverse reaction (recombination) happens, which will generate heat and thus the energy will be lost. Photocatalytic efficiency would be greatly improved if electron and hole pairs could be used as quickly as possible before they are recombined. This should occur quite effectively in the electric field formed at the interface of α-Bi2O3, β-Bi2O3, and SnO2. The photocatalytic mechanism is analyzed according to the position of the individual semiconductor [Reference Zhang, Wang, Xiao, Liu, Xu and Du36, Reference Wang, Hu, Dai, Zhang and Liang37]. As shown in Fig. S7, β-Bi2O3 acts as the recombination center because E VB of the β-Bi2O3 (+3.03 eV) is more negative than that of α-Bi2O3 (+3.17 eV) and SnO2 (+3.50 eV). And the E CB of the β-Bi2O3 (+0.45 eV) is more positive than that of α-Bi2O3 (+0.32 eV) and SnO2 (+0.00 eV) [Reference Qi, Cheng, Yu and Ho38]. So β-Bi2O3 will act as combination center of photocarriers, i.e., photoelectrons of α-Bi2O3 and SnO2 will migrate to the conduction band of β-Bi2O3 and meanwhile holes of them will migrate to the valence band of β-Bi2O3, which makes the separation of electron hole pairs (hVB+–eCB−) transfer more easily and it is clearly proved by analysis of PL spectra and photocurrent result. The Fermi level is denoted by EF, which is defined as the energy level in which 50% of the distribution of charge carriers. Normally the n-SnO2 and p-Bi2O3 semiconductors have different positions of the Fermi levels, and when n-SnO2 and p-Bi2O3 semiconductors form the n–p hetero junction, both of them have the same Fermi level after the charge equilibrium being built [Reference Movahedi, Hosseinian, Nazempour, Rahimi and Salavati39]. The increase of Fermi level may cause the oxidation of oxygen free radicals, which can oxidize the Rh.B due to their strong oxidation power as shown in Fig. S7. On the other hand, the photoinduced holes can also oxidize the Rh.B solution. Consequently, enhanced photocatalytic capability was achieved over n–p SnO2/α ∼ Bi2O3/β ∼ Bi2O3 composite.
Conclusions
A kind of novel n–p SnO2/α ∼ Bi2O3/β ∼ Bi2O3 composite was successfully synthesized with PVA as template by one-step solid-state reaction synthesis. The composite is mainly composed of a tetragonal phase of SnO2, β ∼ Bi2O3, and α ∼ Bi2O3. The n–p SnO2/α ∼ Bi2O3/β ∼ Bi2O3 composites modulated by 15% PVA extend the edge of absorbance to visible light region as far as 725 nm. On controlling the dosage of PVA, the phase, size, and band gap energy of nanoparticles can be tuned. The SB-15 composite shows a superior structural performance and excellent catalytic activity for the better composite crystallinity, higher efficient separation of photoelectrons and holes, and high chemical resistance. It showed an exceptional photocatalytic activity for the decolorization of Rh.B dyes as well as Te and Cr6+.
Experiments
Synthesis of (SnO2)1.3/(α ∼ Bi2O3)x/(β ∼ Bi2O3)1−x
Polyvinyl alcohol-350 (PVA; A.R, Shanghai Wokai Co., Ltd., China), tin(IV) chloride pentahydrate (A.R, Shanghai Wokai Co., Ltd., China), bismuth nitrate (A.R, Guangdong Guanghua Sci-Tech Co., Ltd., China), and sodium hydroxide (A.R, Xilong Chemistry, China) are of analytical grade and directly used without further purification. And 0.05 M SnCl4·5H2O and 0.025 M Bi (NO3)3·5H2O were put in a mortar and grinded completely, and then PVA was added to the mixture and grinded for about 10 min until the yellow precursor becomes even, after that 11 g NaOH was added and grinded vigorously for another 5 min. The prepared mixture was kept in an oven at about 150 °C for 1.5 h and then it was washed with ethanol and deionized water for several times by a vacuum filter till no Cl− was observed. Then the samples were dried at about 105 °C in an oven before calcined in the muffle atmosphere at 500 °C for 2 h. Pure SnO2 and Bi2O3 were synthesized for comparison in the same way without Bi (NO3)3·5H2O or SnCl4·5H2O and without any PVA. The samples modulated by PVA 5%, 10%, and 15% (gross weight) of the precursor are marked as SB-5, SB-10, and SB-15, and the sample without PVA was marked as SB-0.
Characterization
The crystallinity measurement of samples was performed by X-ray diffraction (XRD; DX-2700A Dandong Haoyuan Diffractometer, DanDong, LiaoNing, China) analysis at 40 kV and 30 mA with Cu Kα radiation (λ = 1.5406 Å). Microstructure was characterized by high-resolution transmission electron microscopy (HR-TEM; Titan G2 ETEM, FEI, Oregon) at an accelerating voltage of 300 kV. Microscopic appearance was characterized by field emission microscopy (SU8220, Hitachi, Japan). UV-Vis diffuse reflectance spectroscopy was characterized by UV-2501PC (Kyoto, Japan) using BaSO4 as a reference. Photoluminescence spectrum was characterized by Zhuo Li Han Guang Photoluminescence spectrum measurement system. Brunauer–Emmett–Teller (BET) surface area analysis was performed from the nitrogen adsorption isotherms using a NOVA4200E (Quantachrome, Boynton Beach, Florida). Samples were degassed at 300 °C under vacuum for 3 h. Average pore diameter (d av) and pore volume were calculated based on the Barrett–Joyner–Halenda (BJH) method. The specific surface area data were calculated through Brunauer–Emmett–Teller (BET) analysis. Fourier transform infrared test (FT-IR) was characterized by Nicolet iS50 (Thermo Fisher, Waltham, Massachusetts). Photocurrent test was undergone on CHI1030B electrochemical workstation under bias: 0 V (versus NHE), with light interval: 50 s (turn on 50 s, turn off 50 s), and 5 cycles. Light wavelength longer than 420 nm was separated from Xenon lamp to irradiate the FTO electrode. And 10 mg powder sample is dispersed in ultrapure water, and then 1 mL 0.5% Nafion ethanol solution is mixed evenly before 10 mL solution is added on the FTO glass. Then the FTO electrode was dried at room temperature for photocurrent testing. The test conditions are three-electrode system, that is, platinum electrode as counter electrode, saturated calomel as reference electrode, and FTO covered by the as-prepared samples as working electrode. And 0.5 mol/L sodium sulfate solution was used as electrolyte.
Photocatalytic tests
The photocatalytic capability was assessed by the degradation of Rh.B solution with the initial concentration 5 mg/L because it is often used as model organic pollutant [Reference Liu, Huang, Jiang, Liu and Yu40]. Photocatalytic test was undergone in the reactor (BL-GHX-V, ShangHai, China). And 0.05 g photocatalyst was added into quartz tube filled with 50 mL Rh.B, and then the quartz tubes were illuminated by a 400 W halide metal lamp after magnetic stirring for 4 h in the dark to get adsorption–desorption equilibrium. During the tests, about 5 mL solution was withdrawn every 5 min, and then a membrane filter was used to remove suspended photocatalyst in the solution. The concentration of Rh.B during the decolorization procedures was determined by a 722G UV–Vis (Shanghai Jingke, China) spectrometer at λ = 553 nm using Beer–Lambert law [Reference Huang, Chen, Zhong, Li, Hu, Li, Huang and Duan41]. The decolorization rate of Rh.B was calculated by formula (13),
 $$D = {{{C_0} - {C_t}} \over {{C_0}}} \times 100\% = {{{A_0} - {A_t}} \over {{A_0}}} \times 100\% \quad ,$$
where D was the decolorization ratio, and C 0 and A 0 were the initial concentration and absorbance of Rh.B, respectively, and C t and A t were those of Rh.B after irradiated for t minutes.
To test the stability and recycle capability of n–p SnO2/Bi2O3, the sample was reclaimed and washed with deionized water and ethanol till the complete removal of the residue of Rh.B and dried at 70 °C for 6 h in the oven after each photocatalytic test, and then the photocatalytic test was repeated for 10 times.
Supplementary material
To view supplementary material for this article, please visit https://doi.org/10.1557/jmr.2019.153.
Acknowledgments
This project was supported by the National Natural Science Foundation of China (51362003, 51762004), the Key Research Project of Hunan Provincial Department of Education (17A145), and the Key Research Project of Xinjiang Agricultural and Vocational Technical college (XJNZYKJ201502).