Implications
Fenugreek is an annual, single-cut legume crop introduced to Canada in the early 1990s with the potential to be included in dairy feeding programs. This study showed that inclusion of fenugreek haylage in dairy cow diets compared with alfalfa haylage reduced dry matter intake and milk production, but modified milk fatty acid composition in a manner that is beneficial to human health.
Introduction
Fenugreek is an annual single-cut legume forage traditionally cultivated in Southern Europe, Asia and Northern Africa, and introduced to Canada in the early 1990s (Acharya et al., Reference Acharya, Thomas and Basu2008). Studies have been conducted to evaluate seed production potential (Basu, Reference Basu2006), forage yield and nutrient composition (Mir PS et al., Reference Mir, Mir and Townley-Smith1993; Mir Z et al., Reference Mir, Mir, Acharya, Zaman, Tayior, Mears, McAllister and Goonewardene1998; Montgomery, Reference Montgomery2009) and pharmaceutical value (Srichamroen, Reference Srichamroen2007) of fenugreek grown on the Canadian prairies. Those studies have revealed the enormous potential of fenugreek as an alternative forage crop for areas with a temperate climate such as that of the Western Canadian prairie. Besides its use for forage production, the annual nature of fenugreek may provide producers an opportunity to use fenugreek as a break crop in crop rotations (Moyer et al., Reference Moyer, Acharya, Mir and Doram2003).
Fenugreek has the potential to produce high-quality forage suitable for ruminant animals. Indeed, fenugreek was traditionally used as a forage crop in the Mediterranean region (Acharya et al., Reference Acharya, Thomas and Basu2006), and the species name ‘foenum graecum’ means ‘greek hay’ (Petropoulos, Reference Petropoulos2002). The 15-year Western Canadian average (Acharya et al., Reference Acharya, Thomas and Basu2008) indicates that fenugreek produces reasonably high dry matter (DM) yields; 5.8 and 6.0 t/ha under dryland and irrigation conditions, respectively, compared with 7.8 t/ha for dryland grown alfalfa. However, for fenugreek grown in Edmonton, Alberta, Montgomery (Reference Montgomery2009) reported forage DM yields of only 2.9 and 2.5 t/ha, respectively, for Quatro and F70 fenugreek under dryland conditions. The lower DM yield for fenugreek grown in Edmonton, Alberta was likely due to low rainfall (34 mm v. the 30-year average of 58 mm) during the growing season of 2006. In addition, senescence of the fenugreek leading to reduced biomass may have been induced by spikes in the average daily temperature at the end of July and August (Montgomery, Reference Montgomery2009).
In terms of forage quality, Mir et al. (Reference Mir, Acharya, Mir, Taylor, Zaman and Mears1997) reported that fenugreek harvested at 19 weeks of age contained lower concentrations of neutral detergent fiber (NDF; 387 v. 439 g/kg DM) and crude protein (CP; 157 v. 182 g/kg DM) and higher in vitro DM digestibility compared with early bloom alfalfa, which is consistent with previous results reported by Mir et al. (Reference Mir, Mir and Townley-Smith1993). Mustafa et al. (Reference Mustafa, Christensen and McKinnon1996) compared ruminal degradability of fenugreek hay with full bloom alfalfa hay using an in situ method and reported that fenugreek hay DM, CP and acid-detergent fiber (ADF) had a higher rate of degradation.
There is a paucity of studies where fenugreek forage has been fed to cattle. Beef steers (initial weight of 237 kg) fed fenugreek silage supplemented with barley grain had similar DM intake (DMI), average daily gain and feed efficiency compared with steers fed alfalfa silage supplemented with barley grain (Mir et al., Reference Mir, Mir, Acharya, Zaman, Tayior, Mears, McAllister and Goonewardene1998). To our knowledge, there have been no studies that have examined the use of fenugreek forage for dairy cows. Therefore, the objective of this study was to evaluate fenugreek haylage relative to alfalfa haylage, harvested at the recommended stage of maturity, in terms of cow productivity, apparent total tract digestibility, rumen fermentation and fiber turnover rate in lactating dairy cows. It was hypothesized that inclusion of fenugreek haylage in the diet would improve milk yield as a result of higher apparent total tract digestibility and rumen fermentation and equivalent DMI.
Material and methods
Forages and haylage preparation
Two fenugreek cultivars, CDC Quatro and AAFC F70, and alfalfa (Medicago sativa L.) were used. CDC Quatro is a commercially released variety developed by the Crop Development Center (CDC), Saskatchewan, Canada in 1995. AAFC F70 is a breeding line from the crop development program at Agriculture and Agri-Food Canada (AAFC), Lethbridge, Canada and is not commercially available. The two fenugreek varieties were seeded on 5 May 2006 at the Edmonton Research Station (ERS, 53°25′N, 113°33′W), AB, Canada, at the rate of 23.6 kg/ha, using a row spacing of 18 cm and a depth of 5 cm (Fabro Enterprises Ltd, Swift Current, SK, Canada) on Orthic Black Chernozemic soil, which is typical of central Alberta (Alberta Agriculture Food and Rural Development, 2004). The two fenugreek varieties were each planted on two sites of the ERS (main ERS and West 240 ERS) approximately 2 km apart from each other. On the basis of soil tests, no fertilizer was applied to the main ERS site and 22% phosphorus (P) blend fertilizer (N at 9 kg/ha, P at 26 kg/ha, K at 9 kg/ha and S at 7 kg/ha) was applied to the West 240 ERS site (Montgomery, Reference Montgomery2009). The average rainfall and temperature during the growing season (May to October) of 2006 were 34.3 mm and 13.6°C, respectively (Montgomery, Reference Montgomery2009).
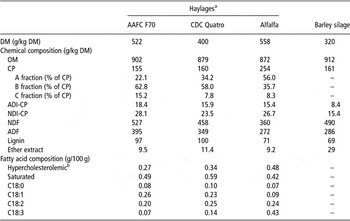
Fenugreek was harvested 15.5 weeks after seeding. Swathing and baling (John Deere 535 large round baler) of CDC Quatro and AAFC F70 from the West 240 ERS site and CDC Quatro from the main ERS site took place on 22 August 2006, but AAFC F70 from the main ERS site was baled on 24 August 2006. Second cut alfalfa (var. Beaver) from an established stand was harvested on 25 August 2006 and baled on 28 August 2006. Bales were wrapped (single layer tube wrapper) using a Tubeline TL5500-AX2 automatic round bale wrapper (FarmTech Machinery, Wodonga, Victoria, Australia). At harvest, the DM content of CDC Quatro was 370 g/kg and that of AAFC F70 was 480 g/kg. The plants were fully podded and had a leaf-to-stem ratio of approximately 0.6. Alfalfa was harvested at the 15% to 20% bloom stage of maturity with a DM content of 580 g/kg. On day 28 post-harvest, the pH of CDC Quatro, AAFC F70 and alfalfa haylage was 5.6, 5.8 and 5.8. Chemical composition of the haylages fed throughout the study is shown in Table 1.
Chemical composition of AAFC F70 and CDC Quatro fenugreek haylage, alfalfa haylage and barley silage

AAFC F70 = Agriculture and Agri-Food Canada F70; CDC Quatro = Crop Development Center Quatro; DM = dry matter; OM = organic matter; ADI-CP = acid-detergent insoluble CP; NDI-CP = neutral detergent insoluble CP.
aValues are the mean of 10 sample analyses.
bHypercholesterolemic = ∑(C12:0, C14:0, C16:0; Hayes et al., 1995).
Cows and experimental diets
A total of six, second lactation Holstein cows previously fitted with rumen cannulas (10 cm i.d., Bar Diamond Inc., Parma, ID, USA) were used for the study. Cows averaged 56 ± 8 (s.d.) days in milk (DIM), and weighed 559 ± 35 kg at the beginning of the experiment and 574 ± 44 kg at the end of the experiment. Cows were housed in individual tie stalls at the University of Alberta Dairy Research and Technology Center, and had free access to water throughout the trial. Cows were cared for according to the guidelines of the Canadian Council on Animal Care (1993) and all procedures were approved by the University of Alberta Animal Care and Use Committee, Livestock.
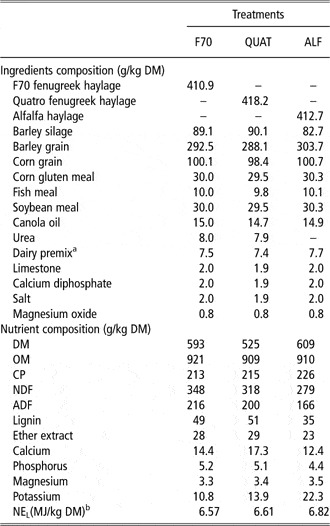
Cows were grouped based on DIM and milk yield and randomly assigned to one of three dietary treatments in a replicated three × three Latin square design with 18-day periods, the first 11 days for adaptation and the final 7 days for sample collection. Periods were limited to 18 days due to limited availability of the fenugreek haylages. The treatments consisted of three isonitrogenous diets containing either AAFC F70 haylage, CDC Quatro haylage or alfalfa haylage at 400 g/kg of dietary DM. In order to keep the diets isonitrogenous, two different concentrate mixes were used – one for the AAFC F70 haylage-based diet (F70) and CDC Quatro haylage-based diet (QUAT) and one for the alfalfa haylage-based diet (ALF). Diet composition is shown in Table 2. The diets were formulated to meet the nutrient requirements of a 600 kg second lactation cow at 75 DIM and producing 40 kg of milk daily (National Research Council (NRC), 2001). Cows were fed the diets as a total mixed ration (TMR) once daily at 0800 h for ad libitum intake allowing for 100 g/kg refusals. To determine DMI, the amount of feed offered and orts were weighed and recorded daily during the collection period.
Ingredient and chemical composition of the dietary treatments

F70 = Agriculture and Agri-Food Canada F70 fenugreek-based diet; QUAT = Crop Development Center Quatro fenugreek-based diet; ALF = alfalfa-based diet; DM = dry matter; OM = organic matter; NEL = net energy of lactation; DMI = DM intake.
aContained 1 g/kg Ca, 6 g/kg P, 3 g/kg Mg, 115 g/kg Na, 2.3 g/kg S, 6.2 mg/kg Co, 1170 mg/kg Cu, 80 mg/kg I, 3100 mg/kg Mn, 40 mg/kg Se, 5000 mg/kg Zn, 1 265 000 IU/kg vitamin A, 142 000 IU/kg vitamin D and 3800 IU/kg vitamin E.
bCalculated according to National Research Council (2001) using average DMI of 20 kg/day.
Sampling procedures
Haylage DM was determined weekly and the ratio of concentrate-to-forage adjusted to maintain the formulated diet DM composition. Ingredient samples were collected weekly and composited by period for analysis of DM, organic matter (OM), CP, NDF, ADF, lignin, ether extract and mineral content. Orts were collected two times per period on days 16 and 18 and analyzed as indicated above for the ingredients (with the exception of the minerals).
Cows were milked twice daily at 0500 and 1600 h with yield recorded at each milking. Milk samples (am and pm) were collected during the last 7 days of each period. One aliquot was preserved with potassium dichromate and sent to Canwest Central Milk Testing Laboratory (Edmonton, AB, Canada) for analysis of fat, protein and lactose content, and somatic cell count by infrared (IR) spectroscopy (Milk-O-Scan 605; Foss Electric, Hillerød, Denmark) and milk urea nitrogen (MUN) with an automated IR Fossomatic 400 milk analyzer (Foss North America, Brampton, ON, Canada). The second milk aliquot was stored at −20°C until analyzed for FA composition. Milk composition was proportionally corrected for the am and pm volumes.
Coccygeal blood samples were collected in 10 ml Vacutainer tubes containing sodium heparin (BD Franklin Lakes, NJ, USA) at 0730, 1430 and 2030 h on day 16 and immediately put on ice. The blood was centrifuged at 1500 × g for 20 min at 4°C within 1 h of sampling, and plasma was stored at −20°C for later analysis of cholesterol, glucose and triglycerides.
Chromic oxide was used as an inert external marker to determine apparent total tract digestibility (Holden et al., Reference Holden, Muller, Varga and Hillard1994; Oelker et al., Reference Oelker, Reveneau and Firkins2009). Seven grams of chromic oxide were weighed on to a filter paper and placed manually in the rumen mat via the rumen cannula on day 8 through day 16. The marker was placed in the rumen three times per day at 0800, 1500 and 2100 h. Feces were collected from days 13 to 17 by rectal sampling failing voluntary defecation in a design that equally represented the 96-h collection period as well as the 24 h day (Khorasani et al., Reference Khorasani, Okine and Kennelly1996). The sampling times were 0730, 1930, 0430, 1630, 0130, 1330, 1030 and 2230 h. At each sampling time, 200 g of feces were collected from each cow and stored at −20°C until analysis. Samples were pooled by cow by period.
Rumen fluid was sampled 12 times over a 24-h period beginning on day 18. Samples were obtained at 0730, 0810, 0830, 0900, 0930, 1000, 1200, 1400, 1600, 1800, 0200 and 0600 h. Rumen fluid was collected using a stainless steel strainer attached to a plastic tube that was inserted in the dorsal, middle and ventral sections of the rumen to obtain a representative sample (100 ml from each location). The liquid was extracted by applying vacuum to the end of the tube with a syringe (Khorasani and Kennelly, Reference Khorasani and Kennelly2001). One 4 ml aliquot for volatile fatty acid (VFA) analysis was placed in a test tube containing 1 ml 25% H3PO4 and stored at −20°C until analyzed. A second aliquot was placed in another test tube and stored at −20°C for ammonia–N analysis.
Rumen pH was continuously measured from days 12 to 15 using indwelling rumen pH probes as described by Penner et al. (Reference Penner, Beauchemin and Mutsvangwa2006). Ruminal pH readings were taken every 30 s and averaged every 60 s and were summarized daily for each cow as mean, minimum and maximum pH. The area (pH × h) and duration (h/day) that pH was below the thresholds of 5.8, 5.5 and 5.2 were also calculated.
Rumen digesta mass, weight of rumen liquid and rate of NDF passage and turnover were estimated using the rumen evacuation technique. Evacuations were conducted on four separate occasions (0700, 1300, 1800 and 0100 h) during days 15 and 16 of each period such that a representative sample for a 24 h period was obtained (Khorasani et al., Reference Khorasani, Okine and Kennelly1996). The first evacuation was done 1 h before feeding. All rumen contents that could be removed by hand (referred to as solid digesta) were placed in an insulated plastic container, weighed, and a representative sample taken; this sample was approximately 2 to 3 kg regardless of the total weight evacuated. Materials not removed by hand (referred to as rumen liquid) were bailed into a polyethylene container, weighed and a representative sample (1.0 to 1.5 l) taken. Rumen liquid and solid digesta were then returned to the rumen. Rumens were empty for 3 to 5 min during the procedure. A 1000 g representative sample was obtained by mixing the samples taken from the solid digesta and rumen liquid in proportion to their total weight. Samples were stored at −20°C until subsequent analysis.
Sample analysis
Before analysis, feed ingredients, orts, feces and rumen digesta samples were dried in a forced-air oven at 55°C for 48 h and then ground through a 1 mm sieve using a Wiley Mill (Thomas Co., Philadelphia, PA, USA). Analytical DM was then determined by drying at 100°C for 5 h (Association of Official Analytical Chemists (AOAC), 1990; ID 934.01). Neutral detergent fiber, ADF and lignin were determined by the procedure of Van Soest et al. (Reference Van Soest, Robertson and Lewis1991). Both ADF and NDF were reported inclusive of residual ash. Nitrogen (N) concentration was determined on a Leco carbon/N determinator (TruSpec CN, St. Joseph, MI, USA) and CP calculated as N × 6.25. Haylage protein fractions were determined using an in situ technique with ruminally cannulated lactating dairy cows that were fed the corresponding feed types as described by Montgomery (Reference Montgomery2009). Acid-detergent insoluble N and neutral detergent insoluble N were determined by the Central Testing Laboratory Ltd (Winnipeg, MB, Canada) using the Ankom 8/98 method (i.e. Dumas combustion methodology). Mineral concentrations were determined by the Central Testing Laboratory Ltd using modified AOAC 968.08 and 935.13A procedures (AOAC, 1995). Ether extract was determined using a Goldfisch extraction apparatus (Labconco, Kansas City, MO, USA; Wrolstad et al., Reference Wrolstad, Durst and Lee2005). Feed ingredient samples were placed in a 550°C furnace for 5 h to determine ash content (AOAC, 2002, ID 942.05).
Chromic oxide concentration in fecal samples was determined according to the procedure of Fenton and Fenton (Reference Fenton and Fenton1979). Briefly, feces were digested in a mixture of concentrated sulfuric acid and perchloric acid, and the concentration of chromium (Cr) oxide was quantified using flame atomic absorption (Varian AA240FS, Varian Inc., Palo Alto, CA, USA).
For milk FA analysis, milk fat was extracted (Folch et al., Reference Folch, Lees and Stanley1957) and after esterification, FA profiles were determined by gas chromatography using the procedure of Kramer et al. (Reference Kramer, Blackadar and Zhou2002). Total running time was 86 min and the gas chromatograph was fitted with an SP 2560 fused silica capillary (100 m × 0.25 mm × 0.2 μm film thickness; SUPELCO, Bellefonte, PA, USA).
Plasma glucose was determined as described by Silveira et al. (Reference Silveira, Oba, Beauchemin and Helm2007). Briefly, a colorimetric assay using glucose oxidase–peroxidase (P7119-10CAP, Sigma Chemical Co., St. Louis, MO, USA) and dianisidine dihydrochloride (no. F5803, Sigma Chemical Co., St Louis, MO, USA) was used with absorbance read on a SpectraMax 190 plate reader (Molecular Devices Corp. Sunnyvale, CA, USA). Plasma cholesterol and triglyceride concentrations were determined at the Central Laboratory for Veterinarians Ltd (Edmonton, AB, Canada) using a Dade Behring Dimension RXL Chemistry Analyzer (WS-DADERXL, Deerfield, IL, USA). For plasma cholesterol, a modified method of Stadtman (Reference Stadtman1957) was used in which cholesterol oxidase produces a colored end product whose absorbance is proportional to the amount of cholesterol in the sample. Plasma triglyceride was determined by incubating samples with lipoprotein lipase, which catalyzes the hydrolysis of the triglycerides. A series of reactions involving glycerol kinase and glycerol-3-phosphate-oxidase converts the glycerol to dihydroxyacetone phosphate and hydrogen peroxide. Through the catalytic action of peroxide, quinoneimine is formed from hydrogen peroxide. The change in absorbance due to the formation of quinoneimine is directly proportional to the total amount of glycerol and its precursors in the sample.
Ruminal ammonia–N concentration was measured as described by Fawcett and Scott (Reference Fawcett and Scott1960). For VFA analysis, rumen fluid samples were thawed and centrifuged at 1700 × g for 15 min and the resultant supernatant analyzed by gas chromatography as described by Khorasani et al. (Reference Khorasani, Okine and Kennelly1996).
Calculations and statistical analysis
Fecal output was estimated from the concentration of Cr in the fecal sample. Apparent total tract digestibility of DM, OM, CP, NDF and ADF was calculated from the daily intake of these components and the corresponding fecal output using the following calculation: (daily intake of component – daily fecal output of component)/daily intake of component.
DM turnover time was calculated according to Khorasani et al. (Reference Khorasani, Okine and Kennelly2001) as (rumen content DM (kg)/DMI (kg/day)) × 24 h/day. Rate of NDF passage in the rumen from rumen evacuation data was calculated from fiber flow and pool size in the rumen as described by Robinson and Kennelly (Reference Robinson and Kennelly1989). This model assumes steady state and first-order kinetics. Passage rate of NDF (proportion/h) = ((fecal NDF output (kg/day)/0.85)/ruminal NDF pool (kg))/24 h/day. Rumen turnover rate of NDF (proportion/h) was calculated using the equation (intake of NDF (kg/day)/rumen pool of NDF (kg))/24 h/day.
Milk yield and composition data from the last 7 days of each period were reduced to weekly means before statistical analysis. Milk yield, milk composition, DMI, apparent total tract digestibility, fiber turnover rate and rumen pH were analyzed as a replicated Latin square design using the MIXED procedure of SAS (SAS Institute Inc., Cary, NC, USA 2002) with the fixed effects of period, square and treatment and the random effect of cow within square. For rumen VFA and ammonia–N and plasma glucose, cholesterol and triglyceride concentrations statistical analysis was performed using the PROC MIXED procedure of SAS (SAS Institute Inc., Cary, NC, USA, 2002). The statistical model included square, period, treatment, time and treatment by time interaction. Time of sampling was the repeated measure. Cow within square was considered as a random effect. The best fit covariance structure was determined by Schwarz's Bayesian Information Criterion (BIC) with a lower BIC indicating the best fit. A Satterthwaite approximation was used to correct the denominator degree of freedom. Pre-planned orthogonal contrasts were used to determine the effect of FEN (the mean of F70 and QUAT) v. ALF and QUAT v. F70. Treatment effect was declared significant at P ≤ 0.05, and a tendency declared at 0.05<P ≤ 0.10.
Results
Diet composition, DMI, milk yield and composition and blood metabolites
The diets on average contained 218 g/kg DM CP. Because the alfalfa haylage was so high in protein (254 g/kg DM; Table 1) and solubility of the protein in alfalfa is very high it was impossible to formulate a diet that had a CP content of <200 g/kg DM that contained sufficient metabolizable protein (MP) to meet the cow's requirements. Thus, although 218 g/kg DM dietary CP (formulated concentration was 200 g/kg) is higher than that normally used in commercial settings it was the only means by which enough MP could be supplied to meet the requirements of the cow. In addition, protein fractions of the haylages (Table 1) were determined in a different study concurrent with the present one so the NRC default values were used when formulating the diets.
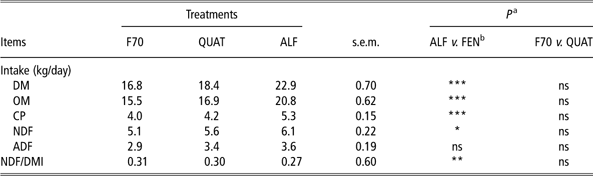
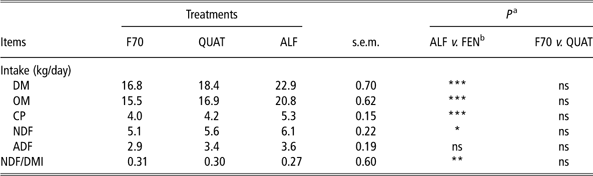
DMI was higher (P < 0.001) for cows fed the ALF diet compared with those fed FEN (22.9 v. 17.6 kg/day; Table 3). Similarly, NDF, CP and OM intake was higher for ALF fed cows than FEN fed cows (P < 0.05). There was no difference in DM and nutrient intake for cows fed the F70 and QUAT diets (P > 0.10).
Effect of dietary forage on nutrient intake of lactating dairy cows
F70 = Agriculture and Agri-Food Canada F70 fenugreek-based diet; QUAT = Crop Development Center Quatro fenugreek-based diet; ALF = alfalfa-based diet; FEN = fenugreek; DM = dry matter; OM = organic matter; DMI = DM intake.
a,***P ⩽ 0.001; *P ⩽ 0.05; ns = P > 0.05; **P ⩽ 0.01.
bFEN (average of F70 and QUAT).
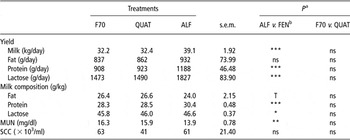
Milk yield was higher for cows fed ALF compared with those fed FEN (P < 0.001; Table 4), but was not different (P = 0.87) between F70 and QUAT, averaging 32.3 kg/day. Milk protein and lactose yields and content were higher with the ALF diet (P < 0.05) than the FEN diets, but fat yield and concentration were not different between ALF and FEN fed cows, averaging 877 g/day and 25.7 g/kg, respectively. MUN was significantly higher (P < 0.01) for cows fed FEN (16.1 mg/dl) than ALF (13.9 mg/dl). No differences were observed between F70 and QUAT fed cows for any of the milk production and composition parameters (Table 4).
Effect of dietary forage on milk yield and composition of lactating dairy cows

F70 = Agriculture and Agri-Food Canada F70 fenugreek-based diet; QUAT = Crop Development Center Quatro fenugreek-based diet; ALF = alfalfa-based diet; FEN = fenugreek; MUN = milk urea nitrogen; SCC = somatic cell count; T = tendency.
a,***P ⩽ 0.001; ns = P > 0.05; T = 0.05 < P ⩽ 0.1; *P ⩽ 0.05; **P ⩽ 0.01.
bFEN (average of F70 and QUAT).
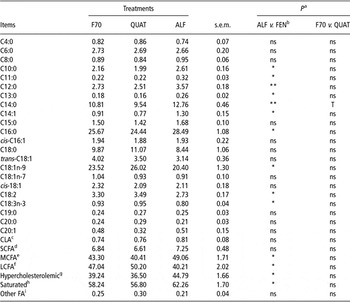
Treatment had a significant effect on milk FA composition (Table 5). Concentrations of C10:0, C11:0, C12:0, C13:0, C14:0, C14:1 and C16:0 were higher for cows fed ALF compared with FEN (P < 0.05). Conversely, the concentrations of C18:1n-9, C18:2 and C18:3n-3 were lower for ALF than FEN fed cows (P < 0.05). Milk FA composition was similar between the two FEN treatments, except for the concentration of C14:0, which tended to be higher for cows fed F70 than QUAT (P = 0.09). Medium-chain, hypercholesterolemic and saturated FA concentrations were higher (P ⩽ 0.01) for ALF fed cows than FEN, but did not differ between F70 and QUAT. Long-chain FA concentration was lower for ALF fed cows compared with FEN fed cows (P = 0.02), but similar for F70 v. QUAT (P = 0.26).
Effect of dietary forage on milk FA composition (% of total FA esters) of lactating dairy cows

FA = fatty acid; F70 = Agriculture and Agri-Food Canada F70 fenugreek-based diet; QUAT = Crop Development Center Quatro fenugreek-based diet; ALF = alfalfa-based diet; FEN = fenugreek; CLA = conjugated linoleic acids; SCFA = short-chain FA; MCFA = medium-chain FA; LCFA = long-chain FA; T = tendency.
ans = P > 0.05; *P ⩽ 0.05; **P ⩽ 0.01; T = 0.05 < P ⩽ 0.1.
bFEN (average of F70 and QUAT).
cCLA = consistent with CLA 9/11.
dSCFA = ∑(C4 through C11).
eMCFA = ∑(C12 through C16).
fLCFA = ∑(⩾C18).
gHypercholesterolemic FA = ∑(C12:0, C14 :0, C16:0; Hayes et al., 1995).
hSaturated FA = ∑(C4:0, C6:0, C8:0, C10:0, C11:0, C12:0, C13:0, C14:0, C15:0, C16:0, C18:0, C19:0, C20:0).
iOther FA = ∑(C22:0, C20:3n-6, C20:4, C20:5, C22:5 and C24:0).
Plasma glucose concentration was higher (P = 0.003) for cows fed ALF (3.78 mmol/l) compared with those fed FEN (3.62 mmol/l), but was not different (P > 0.10) between F70 (3.57 mmol/l) and QUAT treatments (3.66 mmol/l). Plasma cholesterol concentration tended to be higher (P = 0.08) for FEN (5.68 mmol/l) than ALF (5.31 mmol/l) fed cows, and was higher (P = 0.03) for cows fed QUAT (5.98 mmol/l) than for those fed F70 (5.38 mmol/l). Triglyceride concentration tended to be lower for ALF (0.15 mmol/l) v. FEN (0.17 mmol/l) and was not different between F70 (0.17 mmol/l) and QUAT (0.17 mmol/l).
Rumen volume, rumen fermentation and apparent total tract digestibility
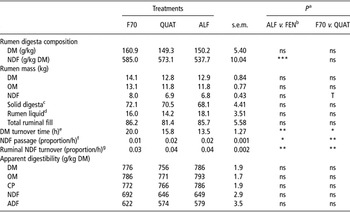
Total ruminal fill (84.4 kg) and rumen digesta DM (153.5 g/kg) were not affected by treatment (Table 6). Similarly, rumen pool size of OM, rumen liquid and solid digesta was not affected by treatment. Rumen digesta from ALF fed cows contained a lower concentration of NDF than from cows fed FEN (P < 0.001). Rumen DM turnover time was shorter for ALF v. FEN (P < 0.01) and QUAT v. F70 (P < 0.05). The rate of ruminal NDF turnover and rate of passage were higher for cows fed ALF than FEN (P < 0.05) and QUAT than F70 (P < 0.01). Apparent total tract digestibility of DM, OM, CP, NDF and ADF was not affected by treatment (Table 6).
Effect of dietary forage on ruminal fill, fiber turnover and apparent total tract digestibility

F70 = Agriculture and Agri-Food Canada F70 fenugreek-based diet; QUAT = Crop Development Center Quatro fenugreek-based diet; ALF = alfalfa-based diet; FEN = fenugreek; DM = dry matter; OM = organic matter; T = tendency; DMI = DM intake.
ans = P > 0.05; ***P ⩽ 0.001; **P ⩽ 0.01; *P ⩽ 0.05; T = 0.05 < P ⩽ 0.1
bFEN (average of F70 and QUAT).
cWet particulate material removed from rumen by hand.
dLiquid material remaining in the rumen after hand removal of solid mat and removed by a plastic cup.
eCalculated as: rumen content DM (kg)/DMI (kg/day) × 24 h/day (Khorasani et al., Reference Khorasani, Okine and Kennelly2001).
fCalculated as ((fecal NDF output (kg/day)/0.85)/ruminal NDF pool (kg))/24 h/day (Robinson and Kennelly, Reference Robinson and Kennelly1989).
gCalculated as (intake of NDF (kg/day)/rumen pool of NDF (kg))/24 h/day (Robinson and Kennelly, Reference Robinson and Kennelly1989).
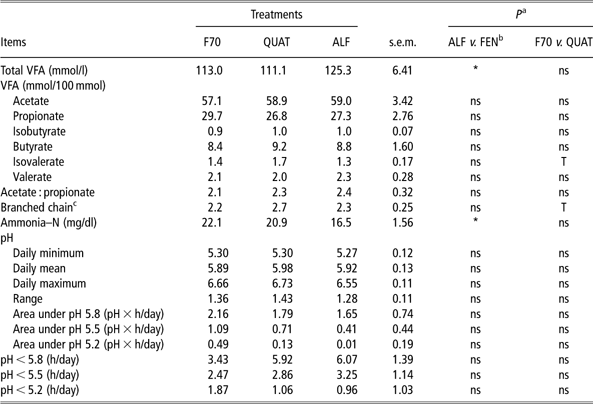
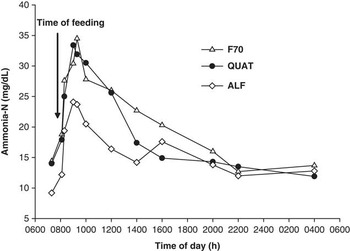
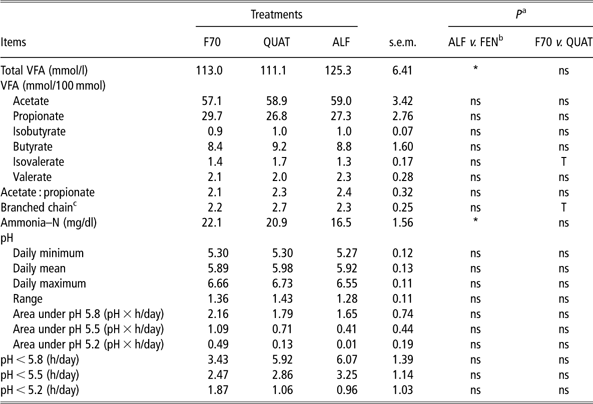
Total rumen VFA concentration was higher (P < 0.05) for ALF (125.3 mmol/l) than FEN (112.1 mmol/l), but did not differ between F70 and QUAT (P = 0.75; Table 7). Acetate, propionate and butyrate concentrations, expressed as a percentage of total VFA, were not different for cows fed ALF v. FEN or F70 v. QUAT diets. However, branched-chain FA (BCFA) tended to be higher (P = 0.06) for cows fed QUAT compared with those fed F70. Rumen ammonia–N concentration was higher (P < 0.05) for cows fed the FEN diets compared with ALF (21.5 v. 16.3 mg/dl). The diurnal pattern of rumen ammonia–N is shown in Figure 1; concentrations were lowest before feeding and highest between 1 to 3 h after feeding. Rumen pH ranged between 5.3 and 6.7. The daily minimum, mean and maximum rumen pH as well as the duration of time when rumen pH was <5.8, <5.5 and <5.2 were not affected by treatment (Table 7).
Effect of dietary forage on rumen fermentation and pH of lactating dairy cows
F70 = Agriculture and Agri-Food Canada F70 fenugreek-based diet; QUAT = Crop Development Center Quatro fenugreek-based diet; ALF = alfalfa-based diet; FEN = fenugreek; VFA = volatile fatty acids; T = tendency.
a,*P ⩽ 0.05; ns = P > 0.05; T = 0.05 < P ⩽ 0.1.
bFEN (average of F70 and QUAT).
cIsobutyrate + isovalerate.
Effect of dietary forage on diurnal pattern of rumen ammonia–N for lactating dairy cows. F70 = AAFC F70 fenugreek-based diet; QUAT = CDC Quatro fenugreek-based diet; ALF = alfalfa-based diet. The effects of treatment, time and their interaction (s.e.m. = 2.34) were significant (P = 0.03, P < 0.0001 and P = 0.04, respectively).

Discussion
Haylage composition
Fenugreek haylage composition used in this study (Table 1) was comparable with previous reports (Das et al., Reference Das, Arora and Luthra1979; Mir et al., Reference Mir, Acharya, Mir, Taylor, Zaman and Mears1997). Similar to that reported by Mir PS et al. (Reference Mir, Mir and Townley-Smith1993) and Mir Z et al. (Reference Mir, Acharya, Mir, Taylor, Zaman and Mears1997) ADF, NDF and degradable protein fractions (sum of fractions A and B) of fenugreek haylage were higher than alfalfa haylage. The fenugreek was harvested at 15.5 weeks post-seeding, in line with the recommendation of Mir et al. (Reference Mir, Acharya, Mir, Taylor, Zaman and Mears1997) for optimization of nutritive value. Those authors suggested that fenugreek has the ability to keep its nutritive quality regardless of maturity due to its indeterminate growth nature, thus allowing a wide window for harvesting. However, the results of Montgomery (Reference Montgomery2009) for F70 and Quatro grown in Edmonton, AB, Canada indicate that fenugreek quality starts to decline after 12 weeks post-seeding and continues to decline with advancing maturity. Therefore, further investigation is required to determine the appropriate stage of maturity for fenugreek forage to optimize both quality and yield.
DMI and production
The lower DMI of cows fed FEN (Table 3) may have been due to poor palatability of the fenugreek haylage as a result of its bitterness and strong characteristic smell (Petropoulos, Reference Petropoulos2002). In contrast to our results, no difference in DMI was reported by Mir et al. (Reference Mir, Mir, Acharya, Zaman, Tayior, Mears, McAllister and Goonewardene1998) for steers fed alfalfa and fenugreek silage (harvested at 17 weeks of age) supplemented with barley grain. It is possible that fenugreek refusal only occurs at high DMIs as seen in dairy cows, or that short-cut silage is more palatable than long-stemmed haylage. In addition, in this study the difference in DMI among treatments may partly be explained by the variation in dietary NDF concentration. NDF has been found to be one of the chemical predictors of DMI (Allen, Reference Allen2000) with high NDF associated with low DMI. However, when the NDF as a proportion of total DM consumed is examined (Table 3), the difference among treatments is considerably less compared with the difference among treatments of NDF as a proportion of diet DM (Table 2). This clearly shows that the cows selected against the FEN in the diet; in fact, NDF concentration was 144 g/kg DM higher in the orts than in the offered FEN diets and only 42 g/kg DM higher in the orts than in the offered ALF diet. The stems of the fenugreek were dried out due to very hot dry weather for the 24 h preceding harvest, and the cows clearly sorted the stems out of the TMR. Had sorting not occurred, NDF intake of the cows consuming F70 would have been 5.85 kg/day, whereas actual intake was 5.1 kg/day. Sorting was likely further exacerbated by the allowance of 100 g/kg refusals and the overall dryness of fenugreek.
Milk yield was higher for ALF fed cows compared with FEN fed cows as a result of their higher DMI, and because of similar OM and fiber digestibility among the diets (Table 6), greater net energy intake. The higher milk protein yield for cows fed ALF compared with those fed FEN (Table 4) likely resulted from their higher CP and energy intake. DePeters and Cant (Reference DePeters and Cant1992) and Hristov et al. (Reference Hristov, Price and Shafii2004) reported that CP intake is positively correlated with milk protein content and protein yield. A meta-analysis of published studies in which amino acids were infused showed that there is a stronger correlation between MP and milk protein yield than there is between CP and milk protein yield (Doepel et al., Reference Doepel, Lapierre and Kennelly2002), thus MP supply was calculated for each of the treatments. The MP supply for cows fed ALF was 2210 g/day, whereas for those fed FEN it was only 1792 g/day.
MUN has been used as a diagnostic of protein feeding in dairy cows (Nousiainen et al., Reference Nousiainen, Shingfield and Huhtanen2004). Synchrony between energy and N supply increases the use of available N by ruminal microorganisms and improves ruminal outflow of bacterial protein. This in turn increases the efficiency of use of dietary N for productive purposes. The lower MUN of the ALF fed cows suggests an improved synchrony of N and energy availability in the rumen that may have allowed for the more efficient use of dietary N relative to that of the FEN fed cows.
The increased milk lactose yield with the ALF treatment compared with the FEN treatments is a reflection of the higher milk yield and higher milk lactose concentration in the ALF fed cows. Lactose synthesis in the ALF cows compared with the FEN cows would be higher due to a greater availability of glucose as a result of higher DMI and CP intake, which could supply amino acids for gluconeogenesis.
The low milk fat percentage for all treatments is unusual and difficult to explain. Some values were extremely low (<2%) and the validity of these values were questioned. However, even when these values were removed from the statistical analysis, milk fat remained very low. Milk fat percentage for cows in the herd not on this study averaged 3.2% during the same time period. Thus, evidently the fat levels were associated with some unidentified factor in the diet. It is possible that the low-NDF content of the diet contributed to the low milk fat, but it certainly cannot account for the entire response. Fiber structure also contributes to milk fat concentration. The forage stem length, both of FEN and ALF, ranged from 50 to 100 mm, whereas the barley silage was cut to a theoretical particle length of 16 mm. Although sorting by the cows of the FEN diets led to low NDF intake increasing the probability of low milk fat levels, sorting of the ALF diet was minimal, thus effective fiber intake should have been adequate (NRC, 2001). The observed low milk fat percentage could also be related to the observed lower acetate-to-propionate ratio that ranged between 2.1 and 2.4 (Table 7; Grant et al., Reference Grant, Colenbrander and Mertens1990).
There is a great deal of interest in manipulation of the FA profile of milk fat as concerns exist about the role of specific FA in human health. In this respect, ruminant products have been criticized for their relatively high level of medium-chain saturated FA (mainly C12:0, C14:0 and C16:0) and low levels of polyunsaturated FA (Bauman et al., Reference Bauman, Lock, Corl, Ip, Salter and Parodi2006). The lower concentration of medium-chain FA (C12:0, C14:0, C16:0) for FEN fed cows is of interest as these FAs have been known to increase blood cholesterol and low-density lipoprotein concentration in humans (Yu et al., Reference Yu, Derr, Etherton and Kris-Etherton1995) increasing the risk of atherosclerosis (Steinberg et al., Reference Steinberg, Parthasarathy, Carew, Khoo and Witztum1989). The lower concentration of hypercholesterolemic FA in the milk fat of FEN fed cows could be the result of the low concentration of these FAs in the fenugreek haylage (Table 1). Regardless of their lower concentration in fenugreek haylage, especially F70 haylage, C18:2 and C18:3 were higher in the milk fat of FEN fed cows than ALF. This is a similar result to that of Shah and Mir (Reference Shah and Mir2004) who reported higher concentrations of C18:2 and C18:3 in milk of cows fed on diets containing fenugreek seed relative to those fed a control diet. The lower concentration of saturated FA as well as the higher concentration of C18:2 and C18:3 in the milk fat of FEN fed cows might also suggest an effect of fenugreek on biohydrogenation of unsaturated dietary FA in the rumen (Palmquist et al., Reference Palmquist, Lock, Shingfield and Bauman2005).
Plasma metabolites
Studies in rats (Al-Habori and Raman, Reference Al-Habori and Raman1998; Srichamroen, Reference Srichamroen2007) and humans (Sharma et al., Reference Sharma, Raghuram and Rao1990) indicated that fenugreek extract reduced plasma cholesterol and triglycerides due to the presence of steroidal sapogenins. In support of this, inclusion of fenugreek seed in dairy cow diets at 200 g/kg of DM reduced plasma cholesterol concentration (Shah and Mir, Reference Shah and Mir2004). In contrast to that study, plasma cholesterol concentration in this study was not reduced by the FEN diets and in fact tended to be higher for FEN than ALF fed cows. The absence of cholesterol reduction in this study could be due to the relatively low content of seed in the diet and the lower concentration of steroidal sapogenins in forage compared with seed (Taylor et al., Reference Taylor, Zaman, Mir, Mir, Acharya, Mears and Elder1997). The lower concentration of plasma glucose for FEN fed cows compared with ALF may be due to the lower DMI or may be a direct action of fenugreek itself, specifically the presence of 4-hydroxyisoleucine in fenugreek haylage that regulates insulin secretion (Broca et al., Reference Broca, Manteghetti, Gross, Baissac, Jacob, Petit, Sauvaire and Ribes2000).
Rumen fill, apparent total tract digestibility and rumen fermentation
The values for DM turnover time, rumen NDF mass and OM mass for ALF (Table 6) are in agreement with the values reported by Khorasani et al. (Reference Khorasani, Okine and Kennelly1996) who compared alfalfa silage with cereal silages using the rumen evacuation technique in lactating dairy cows. Although it is not clear whether increased rate of passage results in increased intake or increased intake causes an increased rate of passage (Huhtanen et al., Reference Huhtanen, Ahhvenjärvi, Weisbjerg and Nørgaard2006), the higher rate of ruminal NDF passage and shorter DM turnover time for ALF fed cows was associated with their higher DMI (Table 3). Robinson et al. (Reference Robinson, Tamminga and Van Vuuren1987) reported a linear relationship between NDF passage rate and DMI by using the rumen evacuation technique. In this study, cows fed FEN had longer ruminal residence time relative to cows fed ALF, which resulted in greater ruminal NDF content (579.1 v. 537.7 g/kg DM). This higher ruminal NDF content reflected the higher NDF content of FEN and also the lower rate of NDF passage and ruminal turnover (Table 6).
Apparent total tract nutrient digestibility (Table 6) was comparable with the total tract disappearance values reported by Montgomery (Reference Montgomery2009) using the mobile nylon bag technique. Upadhyay et al. (Reference Upadhyay, Gupta and Rekib1977) fed fenugreek forage to goats and reported similar apparent total tract digestibility for DM and CP. The lack of difference in total tract nutrient digestibility between ALF and FEN, in spite of the higher NDF with the FEN diets, can be attributed, at least in part, to differences in DMI. High DMI, especially for diets containing more digestible fiber, is usually associated with decreased total tract nutrient digestibility caused by reduced ruminal retention time and increased passage rate. Oba and Allen (Reference Oba and Allen1999) indicated that forage with high in situ or in vitro degradabilities might have a shorter retention time allowing greater DMI at the expense of total tract NDF digestibility. It is also possible that cows fed ALF had greater postruminal fermentation to compensate for the reduced rumen degradation resulting from the shorter rumen retention time (Huhtanen et al., Reference Huhtanen, Ahhvenjärvi, Weisbjerg and Nørgaard2006).
The similarity of individual major VFA concentrations and rumen pH among treatments is in agreement with Mir et al. (Reference Mir, Mir, Acharya, Zaman, Tayior, Mears, McAllister and Goonewardene1998) who reported no difference in rumen pH and acetic and BCFA concentrations for growing steers fed fenugreek- and alfalfa-based diets supplemented with different levels of barley grain. The higher concentration of total VFA for cows fed the ALF diet could be due to their higher energy intake. Daily mean pH values for ALF fed cows (5.9) was similar to the pH values reported by Kononoff and Heinrichs (Reference Kononoff and Heinrichs2003) for lactating dairy cows fed on alfalfa haylage, and the value reported by Khorasani et al. (Reference Khorasani, Okine and Kennelly1996) for lactating dairy cows fed on alfalfa silage.
Different factors contribute to the variation of rumen ammonia–N concentration such as the N and energy content of the diet, the solubility and digestibility of dietary CP (Van Soest, Reference Van Soest1994), and inclusion of urea in the diet (Cameron et al., Reference Cameron, Klusmeyer, Lynch, Clark and Nelson1991). Concentration of rumen ammonia–N usually increases when diets of lactating dairy cows are supplemented with urea (Cameron et al., Reference Cameron, Klusmeyer, Lynch, Clark and Nelson1991). Mir et al. (Reference Mir, Mir and Townley-Smith1993) reported that fenugreek forage at 50% seed fill stage had higher degradable CP and effective CP degradability than alfalfa at 10% bloom stage. Similarly, fenugreek haylage used in this study contains higher degradable protein compared with alfalfa haylage (Table 1). Thus, differences in rumen ammonia–N concentration, and consequently MUN, among the treatments were likely related to high CP rumen degradability and the presence of urea in the FEN diets.
Conclusion
Inclusion of fenugreek haylage in the diet resulted in lower DMI and milk yield compared with alfalfa haylage. However, FEN improved milk quality by reducing the concentration of saturated and hypercholesterolemic FAs and increasing the concentration of biologically important FA in milk fat. Despite its negative impact on DMI, milk yield and rumen fiber degradation, fenugreek haylage had no effect on apparent total tract digestibility, rumen fermentation and rumen pH relative to alfalfa haylage. Fenugreek harvested at the stage of maturity used in this study appears to be of lower feeding value than alfalfa. However, further studies are needed to determine which fenugreek varieties and ensiling techniques are optimal.
Acknowledgement
The authors would like to thank Dairy Farmers of Canada, Natural Sciences and Engineering Research Council of Canada (NSERC) and Alberta Agriculture and Food Council for their financial support of this project. We also thank the staff at the Dairy Research and Technology Center, University of Alberta, Edmonton, Canada for feeding and taking care of the experimental animals, Kelvin Lien for technical assistance and Surya Acharya for donating the F70 FEN seed.