Introduction
Synthesis of different noble metals into shape-controlled three-dimensional (3D) bimetallic structures can result in the development of novel high-performance catalysts as the electronic properties of each noble metal can collectively catalyze various reactions.[Reference Jiang, Kani, Iqbal, Abe, Kimura, Hossain, Anjaneyulu, Henzie and Yamauchi1, Reference Qiu, Dai, Zhu, Zhang, Wu, Tang and Wei2] Additionally, controlling the shape of structures with large aspect ratios can vary the specific surface area to improve porosity and catalytic performance for a broad range of applications.[Reference Liu, Pippel, Scholz and Gösele3] Techniques such as microemulsion synthesis, hard and soft-templating, and corrosion-based etching have been used to form various high surface area and hierarchical noble metal architectures/scaffolds.[Reference Xu, Zhang, Wang, Xu, Bian, Ma and Ding4–Reference Victor, Hamed, Hongjing, Bo, Cuiling, Ho and Yusuke6] Pt-based nanostructures and its alloy forms have the unique capability to catalyze the oxidation and reduction of chemical species for numerous industrial processes.[Reference Peng and Yang7] The different crystal faces of Pt have different electronic structures, thus variable catalytic activity for the same reaction.[Reference Stamenkovic, Fowler, Mun, Wang, Ross, Lucas and Marković8] Therefore, it is critical to control the elemental composition, crystal structure, surface composition and morphology of catalysts to enhance the overall kinetics for specific reactions.
Shape control and scalability of 3D noble metal architectures from aqueous solution, however, still remains a challenge.[Reference Burpo, Nagelli, Morris, McClure, Ryu and Palmer9] Moreover, the integration of dissimilar noble metals into scalable shape-controlled 3D structures from aqueous solution has received limited attention, though there has been some progress in the synthesis of bimetallic platinum- and palladium-based nanostructures with other non-precious metals for electrocatalysis.[Reference Liu, Pippel, Scholz and Gösele3, Reference Ding, Wang, Li, Liu, Zhao, Su and Tong10–Reference Shih, Wang, Xu and Chang12] For instance, porous Pt-Cu and Pd-Cu alloy nanoparticles have increased the electrocatalytic oxidation of methanol for direct methanol fuel cells.[Reference Eid, Wang, He, Wang, Ahamad, Alshehri, Yamauchi and Wang11, Reference Shih, Wang, Xu and Chang12] Further, it has been shown that bimetallic Pt–Pd catalysts have enhanced catalytic activity compared with pure Pt or Pd catalysts from the enhanced synergistic preferential binding of adsorbates to the noble bimetallic surface interacting with the electronic structure.[Reference Zhang, Jin and Xia13, Reference Wu, Li, Pan, Warren, Yin and Yang14] These Pt–Pd catalysts have been shown to enhance the kinetics for oxygen reduction, methanol oxidation, and formic acid oxidation, which are critical to advance fuel cell technologies.[Reference Zhongwei, Mahesh, Wenzhen and Yushan15–Reference Winjobi, Zhang, Liang and Li17] Thus, the synthesis of noble bimetallic structures into an interconnected hierarchal 3D structure would leverage their synergy to catalyze specific reactions in a high surface area material.
In 1813, Vauquelin discovered pink salt needle formation with oppositely charged square planar palladium salts, and later Magnus discovered analogous green platinum salt needles.[Reference Vauquelin18] The combination of different square planar noble metal salts to form high aspect ratio Magnus’ salt-derivative needles as a nanostructure synthesis template offers an opportunity for bimetallic and alloy noble metal materials development. Recently, salt crystals used in the synthesis of metal and metal oxide nanostructures, to include the use of a salt template to achieve Pt macrotube structures forming scalable 3D films, was demonstrated.[Reference Burpo, Nagelli, Winter, McClure, Bartolucci, Burns, O'Brien and Chu19–Reference Xiao, Yu, Jin, Wu, Fang, Sun, Hu, Li, Wu, Huang, Gogotsi and Zhou21] The platinum macrotubes 10s to 100s of micrometer in length exhibited hollow cavities with porous sidewalls composed of interconnected nanofibrils approximately 5 nm in diameter. These porous macrotubes were synthesized from Magnus’ salt needles that result from the combination of oppositely charged platinum square planar ions.[Reference Magnus22]
Here we present an aqueous solution-based method to control and assemble hierarchical bimetallic porous macrobeams from Magnus’ salt-derivative templates. Combining [Pt(NH3)4]2+ ions with varied concentrations of [PtCl4]2− and [PdCl4]2− results in a bimetallic salt template with lengths between 15 and 300 µm. Subsequent chemical reduction of the platinum–palladium salts formed porous Pt–Pd macrobeams with square cross-sections that conform to the length of the initial salt template. The bimetallic porous macrobeams consist of side walls and internal structure composed of primary Pt and Pd nanoparticles 8–16 nm in diameter, or fibrils 4–7 nm in diameter, depending on the ratio of platinum to palladium ions in the salt template. The crystalline bimetallic structure was confirmed with x-ray diffractometry (XRD) analysis. The Pt–Pd macrobeam-specific capacitance determined with electrochemical impedance spectroscopy (EIS) varied with salt template ion ratio, and was as high as 11.73 F/g with an electrochemical accessible-specific surface area of 26.6 m2/g. Bimetallic salt templates enable the integration of a range of noble metal ions for subsequent chemical reduction to 3D hierarchical structures to provide high surface area catalysts.
Experimental
Synthesis of Pt–Pd macrobeams
Magnus’ salt needle derivatives were prepared by mixing 100 mM square planar cation complexes to anion complexes. The 100 mM platinum and palladium salts used were Pt(NH3)4Cl2, K2PtCl4, Pd(NH3)4Cl2, and Na2PtCl4 (Sigma Aldrich, St. Louis, MO, USA). Salt needle templates were formed by combining solutions in stoichiometric ratios of 1:1:0, 2:1:1, 3:1:2 for Pt2+:Pd2−:Pt2− and Pd2+:Pt2−:Pd2− combinations. A total of 1 mL salt solution was prepared, and then reduced with sodium borohydride (NaBH4) (Sigma Aldrich) in a 1:50 (v/v) salt needle solution to reducing agent. Reduced platinum–palladium macrobeams were rinsed in excess deionized water and dried at 100°C.
Characterization
Polarized optical microscopy
Polarized optical microscopy (POM) of Magnus’ salts was performed with an Amscope PZ300JC polarized light microscope (Irvine, CA, USA). Salt needle lengths were measured using ImageJ.[Reference Schneider, Rasband and Eliceiri23]
Scanning electron microscopy
A FEI Helios 600 scanning electron microscope (SEM) (Hillsboro, OR, USA) was used with an accelerating voltage of 15 kV and 43 pA beam current. Energy-dispersive x-ray spectroscopy (EDS) was performed using the Helios 600, and a Bruker Quantax 70 EDX as part of a Hitachi TM-3000 SEM.
X-ray diffractometry
XRD analysis was performed with a PANalytical Empyrean (PANalytical, Almelo, The Netherlands) diffractometer to identify the material phase and crystallite size. XRD scans were performed at 45 kV and 40 mA with CuKα radiation (1.54060 Å), a 2θ step size of 0.0130°, and 20 s per step for diffraction angles (2θ) from 5° to 90°. XRD spectra analysis was performed with High Score Plus software (PANalytical). Crystallite size (D) was determined with the Debeye–Scherrer formula D = Kλ(Bcosθ)−1 with the shape factor (K), full width at half maxima (B), radiation wavelength (λ), and Bragg angle (θ). A shape factor of K = 0.9 was used.
X-ray photoelectron spectroscopy
X-ray photoelectron spectroscopy (XPS) measurements were performed on a ULVAC PHI VersaProbe III (Physics Electronics, Chanhassen, MN, USA) with monochromatic AlKα source energy of 1486.6 eV. The spot size for x-rays was 100 µm with an x-ray power of 25 W. The pass energy was set at 224 and 55 eV for surveys and high-resolution scans, respectively. All scans were shifted to align the adventitious C1s peak to 284.8 eV. The relative Pd and Pt compositions were evaluated for each Pt–Pd alloy in this study using the peak areas after a Shirley background subtraction (BGS), and relative sensitivity factors calibrated to Ag and Au. Prior to determining the relative atomic percentage (at.%), a b-spline BGS of a 100% Pt sample was performed to separate the Pt3d and Pd4d components due to peak overlap.
Macrobeam electrochemical characterization
For electrochemical analysis, Pt–Pd macrotubes were hand-pressed into a film between glass slides with approximately 200 kPa of pressure. A Biologic VMP-3 potentiostat (Knoxville, TN, USA) was used to perform EIS and cyclic voltammetry (CV) with 1.0 M KNO3 and 0.5 M H2SO4 electrolytes, respectively. A three-electrode cell was used with an Ag/AgCl reference electrode, a platinum wire counter-electrode, and a lacquer-coated platinum wire working electrode in contact with the macrobeam-pressed film. EIS measurements were conducted at open circuit potential with a 400 µA amplitude sine wave across a frequency range of 140 kHz–1 mHz. EIS scans were performed before and after CV tests. CV measurements at voltage ranges of 0.1–0.4 V (versus Ag/AgCl) in KNO3, and −0.2 to 1.2 V (versus Ag/AgCl) in H2SO4 were performed at 100, 75, 50, 25, 10, 5, 1, 0.5, and 0.05 mV/s scan rates. The voltage range with KNO3 electrolyte was used to avoid hydrogen adsorption and desorption and the redox properties of the respective of the metals. EC-Lab (Biologic) was used to perform electrochemical analysis.
Results and discussion
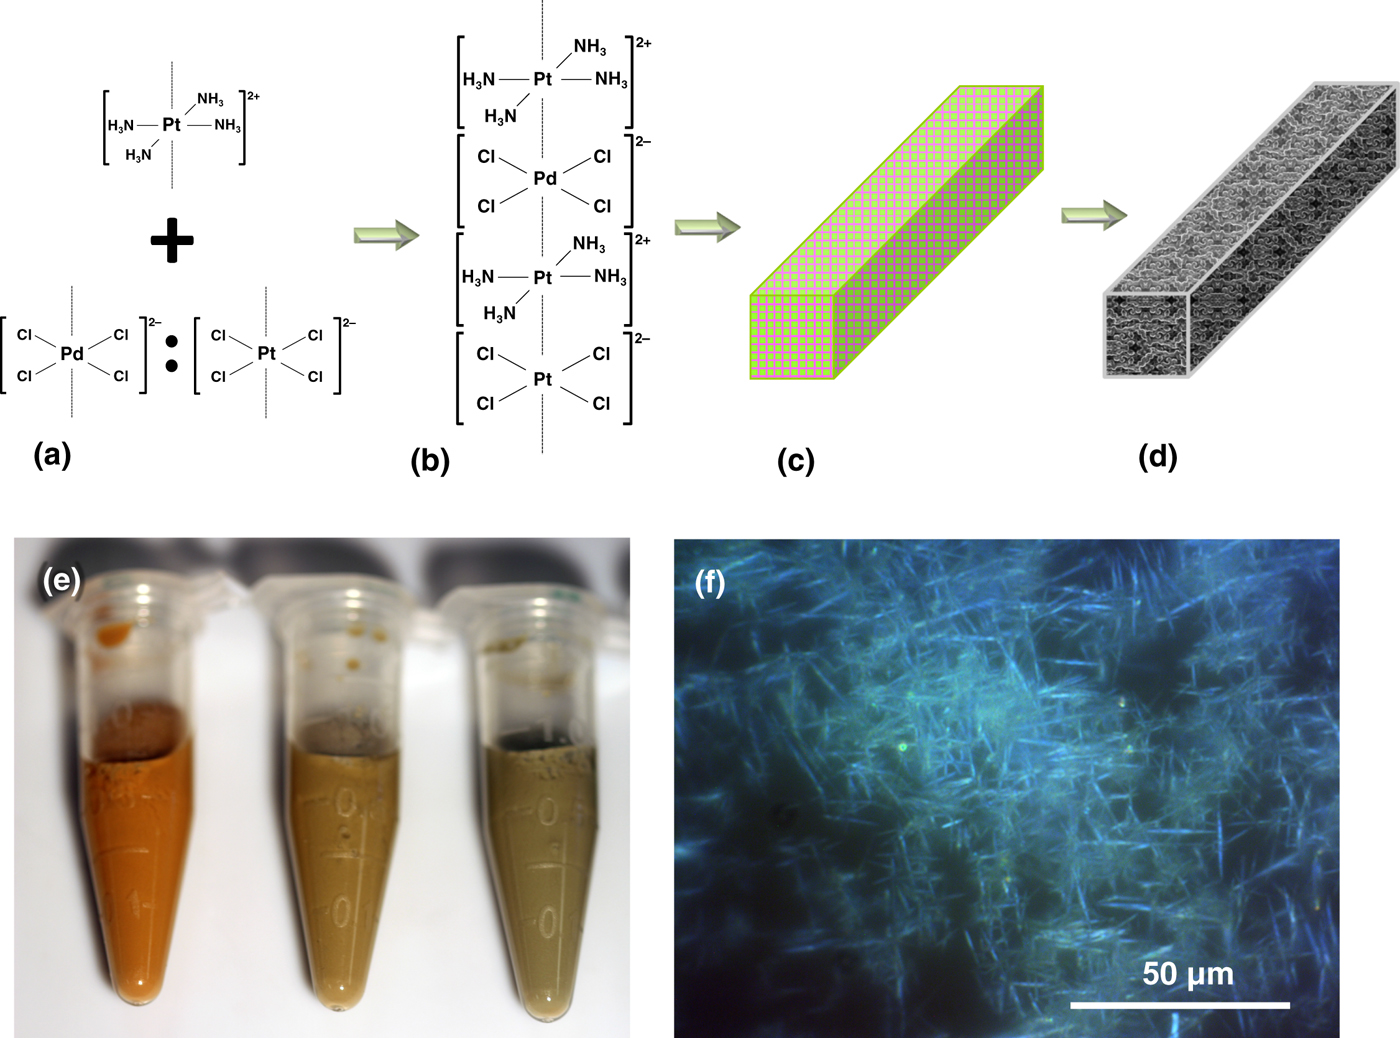
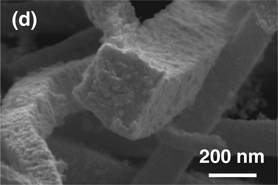
The scheme in Fig. 1. depicts the synthesis route to yield platinum–palladium porous macrobeams. Oppositely charged platinum and palladium square planar ions, when mixed together, rapidly precipitate due to electrostatic binding, forming salt needles via linear stacking of the ions [Figs. 1(a)–1(c)]. In this study, Pt(NH3)4Cl2, Pd(NH3)4Cl2, Na2PdCl4, and K2PtCl4 salts were used with corresponding square planar cations of [Pt(NH3)4]2+ and [Pd(NH3)4]2+, and anions [PtCl4]2− and [PdCl4]2−. For simplicity of notation, these ions will be referred to as Pt2+, Pd2+, Pt2−, and Pd2−, respectively. When exposed to a reducing agent such as sodium borohydride, commonly used for noble metal nanoparticle synthesis, the Magnus’ salt-derivative needle templates form porous metal macrobeams [Fig. 1(d)].
Pt–Pd macrobeam synthesis scheme. (a) Addition of [Pt(NH3)4]2+ with [PdCl4]2− and/or [PtCl4]2−. (b) Electrostatic attraction and linear stacking of square planar complex ions. (c) Formation of Magnus’ salt crystal derivatives. (d) Reduction of platinum–palladium salt needle template to square cross-section macrobeam. (e) Photograph of salt needle templates. Pt2+:Pd2−:Pt2− ratios from left to right are 1:1:0, 2:1:1, and 3:1:2. (f) Polarized optical microscope images of salt needle templates formed from a Pt2+:Pd2−:Pt2− ratio of 1:1:0 with 100 mM salt solutions.

The combinations of ions used to form salt needle templates were Pt2+:Pd2−:Pt2− and Pd2+:Pt2−:Pd2−, both with stoichiometric ratios of 1:1:0, 2:1:1, 3:1:2. The relative platinum-to-palladium ratios are 1:1, 3:1, and 5:1 for the salt needles formed from the Pt2+:Pd2−:Pt2− ion combination. In the case where platinum and palladium are reversed, the relative palladium-to-platinum ratios are 1:1, 3:1, and 5:1 for the salt needles from the Pd2+:Pt2−:Pd2− ion combination (Figs. S1–S5). The results that follow are for the Pt2+:Pd2−:Pt2− ion combinations. The photograph in Fig. 1(e) shows the Pt2+:Pd2−:Pt2− salt needles formed from the ratios from left to right of 1:1:0, 2:1:1, and 3:1:2. The corresponding colors range from red-orange for 1:1:0, changing to red-brown, and then green-brown for 2:1:1 and 3:1:2. These salt needle colors are different than the green color reported for Magnus’ salts formed from [Pt(NH3)4]2+ and [PtCl4]2− ions.[Reference Magnus22, Reference Bremi, Brovelli, Caseri, Hähner, Smith and Tervoort24] Vauquelin's salts formed from [Pd(NH3)4]2+ and [PdCl4]2− ions result in a pink color. The colors observed for the platinum and palladium salt ratios appear as a combination of the platinum or palladium only salts, changing from pink to green as the relative stoichiometric ratio of platinum to palladium increases as seen in Fig. 1(e). POM was used to image the salt needles and determine their length. Figure 1(f) shows POM images of Pt2+:Pd2−:Pt2− for the 1:1:0 ratio. For the 1:1:0 ratio, salt needles range from approximately 50–300 µm, 2:1:1 salts range from 15 to 70 µm, and the 3:1:2 salts range from 15 to 40 µm (Fig. S1). Photo and POM images for salts formed from Pd2+:Pt2−:Pd2− ratios are shown in Fig. S3 and exhibit pink hues consistent with palladium-based Vauquelin's salts.[Reference Vauquelin18]
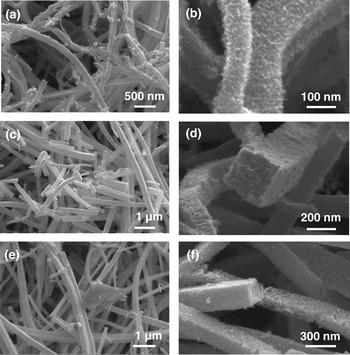
The surface morphology of the reduced porous macrobeams was imaged using SEM as shown in Fig. 2. In general, the macrobeams conform to the same length as the salt needle template ranging from 10s to 100s of micrometer, and exhibit flat side walls with square cross-sections ranging from approximately 100 to 300 nm wide. The macrobeam surface distinctly varies with the salt ion ratio. For the 1:1:0 ratio, sidewalls present an interconnected fibril arrangement, with fibrils approximately 4–7 nm in diameter based on image analysis of Figs. 2(a)–2(b). The observed fibrils are similar to those observed for platinum hollow macrotubes previously reported.[Reference Burpo, Nagelli, Winter, McClure, Bartolucci, Burns, O'Brien and Chu19] The 2:1:1 sample is composed of compact nanoparticles 8–16 nm on the macrobeam surface and throughout the cross-section as seen in Figs. 2(c)–2(d), where the 3:1:2 ratio results in similar sized nanoparticles, but more porous throughout the cross-section [Figs. 2(e)–2(f)].
Scanning electron microscope images of Pt–Pd macrobeams with templates formed from Pt2+:Pd2−:Pt2− salt template ratios of (a)–(b) 1:1:0, (c)–(d) 2:1:1, and (e)–(f) 3:1:2, with 100 mM salt solutions and reduced in 100 mM NaBH4.

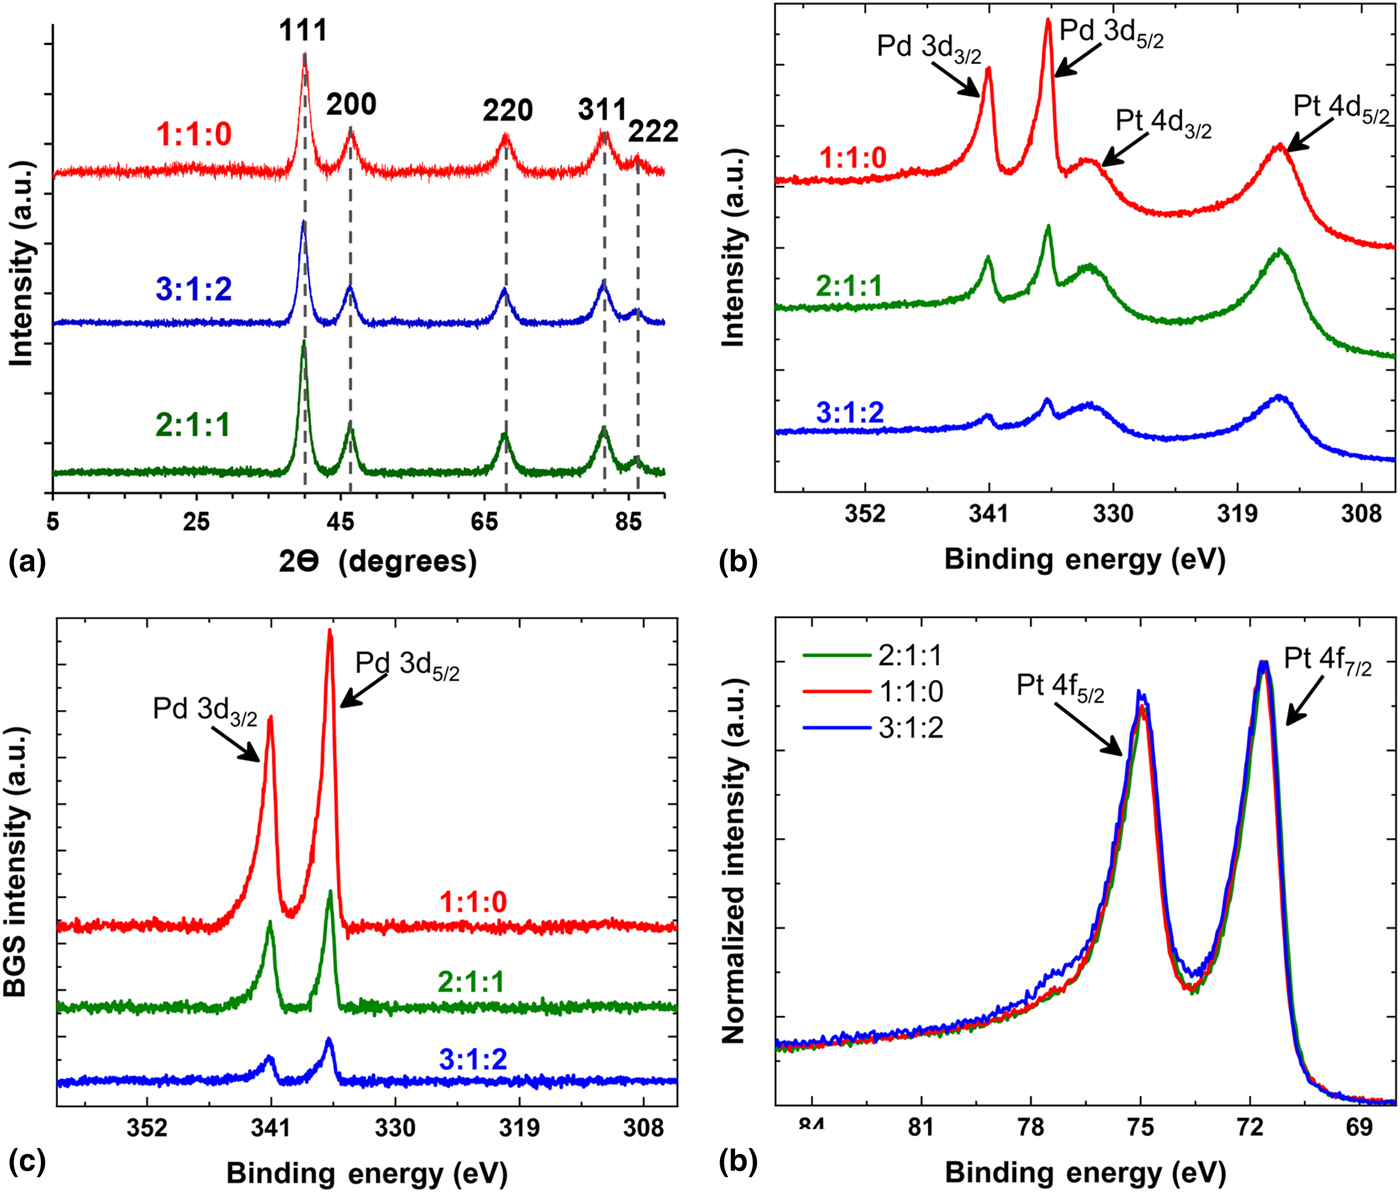
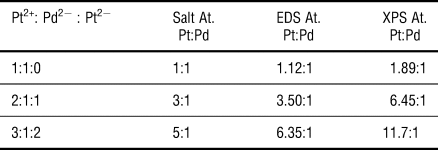
Bulk elemental compositions of the macrobeams were obtained with EDS for the Pt2+:Pd2−:Pt2− samples with salt ratios of 1:1:0, 2:1:1, and 3:1:2. The stoichiometric platinum-to-palladium ratios are 1:1, 3:1, and 5:1, respectively, with corresponding metal macrobeam atomic ratios determined by EDS to be 1.12:1, 3.50:1, and 6.35:1, respectively. The close correspondence between the salt ratios and metalized macrobeam atomic ratios indicates the ability to control the Pt and Pd metal content of the macrobeams via stoichiometric ion ratios by salt templating. Macrobeams were analyzed with XRD with resulting spectra shown in Fig. 3(a). Peaks for macrobeams for all Pt2+:Pd2−:Pt2− sample ratios were indexed to Joint Committee on Powder Diffraction Standards (JCPDS) reference number 03-065-6418 for platinum–palladium alloy, 00-004-0802 for platinum, and 01-087-0643 for palladium. The peak index positions for the three phases are very similar. For instance, the (111) positions are 40.053°, 39.764°, and 39.925° for platinum–palladium, platinum and palladium, respectively. Index scores using High Score Plus (PANalytical) were similar for all three phases for the three sample ratios tested and indicated a cubic crystal system with an Fm-3 m space group. Crystallite sizes determined with the Debeye–Sherrer equation for the (111) crystal face were 6.66, 9.35, and 7.75 nm for the 1:1:0, 2:1:1, and 3:1:2 samples, respectively. These crystallite sizes generally correlate with the nanoparticle and fibril feature sizes observed in Fig. 2.
(a) X-ray diffraction spectra for Pt2+:Pd2−:Pt2− ratios of 1:1:0, 3:1:2, and 2:1:1. Peaks indexed to JCPDS reference number 03-065-6418 for platinum–palladium alloy, 00-004-0802 for platinum, and 01-087-0643 for palladium. Dashed gray lines indicate the similar peak positions for the three indexed phases. (b)–(d) X-ray photoelectron spectra (XPS) for Pt–Pd macrobeams synthesized with Pt2+:Pd2−:Pt2− salt template ratios of 1:1:0, 2:1:1, and 3:1:2. (b) Pt 4d5/2, Pt 4d3/2, Pd 4d3/2, and Pd 4d5/2 peaks. (c) Pd 3d5/2 and Pd 3d3/2 peaks after background subtraction (BGS) of the Pt4d peaks shown in (b). (d) Normalized Pt 4f7/2 and Pt 4f5/2 peaks.

To further assess macrobeam phase composition, XPS was performed on each of the three Pt–Pd alloys. Survey and high-resolution scans show Pd3d, Pt4d, and Pt4f peaks (Fig. 3). Figure 3(b) clearly shows overlapping Pd3d and Pt4d contributions with an increase in the Pd content as follows for the 1:1:0 > 2:1:1 > 3:1:2 samples. The increasing Pd3d5/2 and Pd3d3/2 signals (CPS) are observed at binding energies of approximately 335 and 341 eV, respectively. In addition, Fig. 3(b) shows overlapping Pt4d5/2 and Pt4d3/2 peaks at binding energies of approximately 315 and 332 eV, respectively. In order to deconvolute the Pt and Pd components, BGS of the Pt4d contribution [i.e., derived from Fig. 3(b)] was performed to separate the Pd3d contribution yielding the deconvoluted contribution as shown in Fig. 3(c). After BGS, the peak area of the Pd3d contribution was obtained. The peak area of the Pt4f contribution was determined from Fig. 3(d) and used for determining the relative atomic percentage (at.%). The Pd surface content increased for the 1:1:0 > 2:1:1 > 3:1:2 samples with Pd at.% of approximately 34.5%, 13.4%, and 7.8%, respectively. (Note: the balance is Pt.) Interestingly, the Pt4f7/2 binding energy peak position did not change significantly for compositions ranging ~7–35 Pd at.%, which prompted further investigation into the valence band spectra (VBS) of the Pt–Pd macrobeams. The VBS of the different Pt–Pd alloys are shown in Fig. S6. For the 1:1:0 Pt–Pd macrobeams, the VBS shows a minor decrease in density-of-states (DOS) at binding energies of ~4.75 eV with a concomitant increase in the DOS near ~2 eV. The increase in DOS near the Fermi level (E F), i.e., the 0 eV binding energy in Fig. S6, and decrease in DOS at higher binding energies indicates a modest shift in the d-band center of the Pt–Pd alloy toward lower energies. The shift toward lower binding energies has been previously shown to be useful for various electrocatalytic applications.[Reference Zhou, Lewera, Larsen, Masel, Bagus and Wieckowski25] The d-band center assumes most of the populated states originate from the d orbitals for contributions near the E F. For compositions <~13 at.%, the VBS change is small, which suggests small quantities of Pd do not alter the overall d-band center to a significant degree. Comparison of the EDS and XPS results for the Pt2+:Pd2−:Pt2− sample ratios, and platinum-to-palladium atomic ratios based on salt stoichiometry are shown in Table 1. The elemental Pt:Pd composition determined from EDS shows the trend of 6.35:1 > 3.50:1 > 1.12:1 for the 3:1:2 > 2:1:1 > 1:1:0 sample ratios. Whereas XPS Pt:Pd ratios follow the same general trend with 11.7:1 > 6.45:1 > 1.89:1 for the 3:1:2 > 2:1:1 > 1:1:0 sample ratios. The difference in platinum content determined with EDS bulk material and XPS material surface techniques is attributed to the kinetically more facile reduction of the [PdCl4]2− ion compared with the platinum square planar ions. It is posited that the higher relative platinum on the macrobeam surfaces also results from the dissolution of positively charged [Pt(NH3)4]2+ ions to maintain solution electroneutrality with chloride ions entering solution after the initial reduction of [PtCl4]2− and [PdCl4]2−.[Reference Burpo, Nagelli, Winter, McClure, Bartolucci, Burns, O'Brien and Chu19] The subsequent reduction of the [Pt(NH3)4]2+ ions may enrich platinum on the macrobeam surface relative to palladium.
Atomic ratio composition of Pt–Pd macrobeams synthesized from Pt2+:Pd2−:Pt2− salt ratios of 1:1:0, 2:1:1, and 3:1:2 determined from salt stoichiometry, energy-dispersive x-ray spectroscopy (EDS), and x-ray photoelectron spectroscopy (XPS)

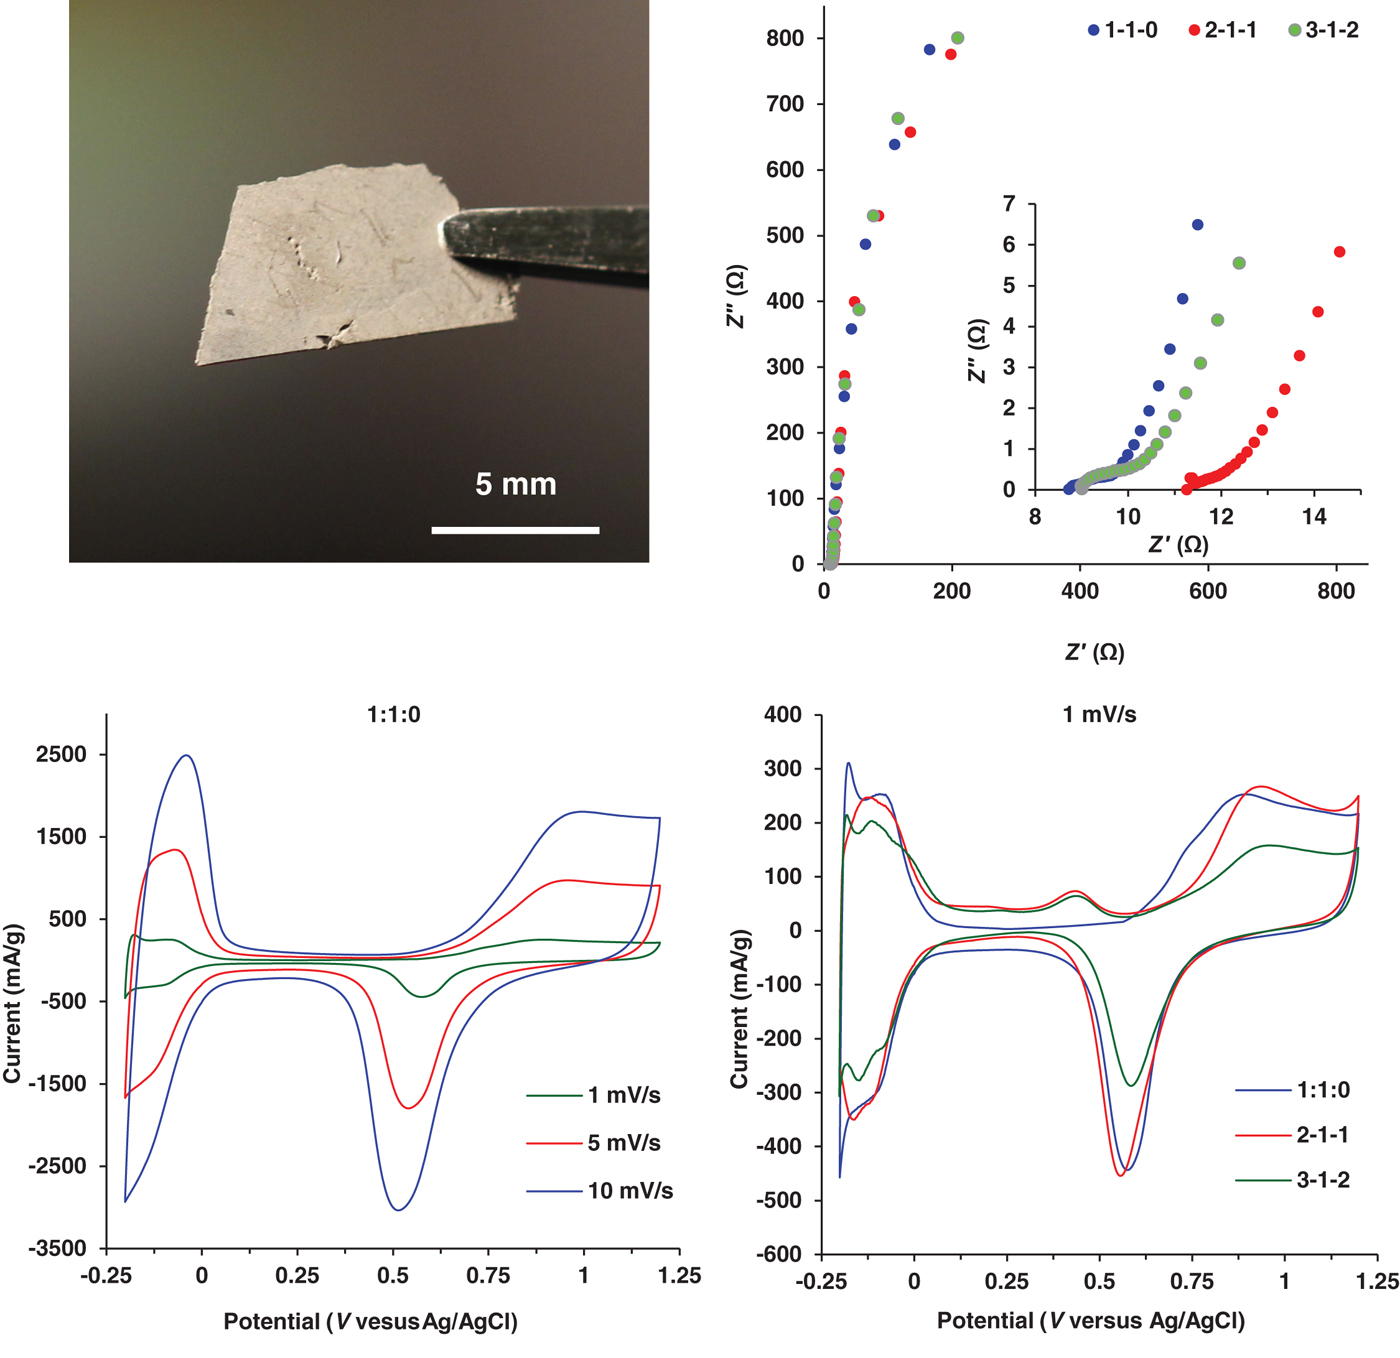
The Pt–Pd macrobeams synthesized from the chemical reduction of Magnus’ salt-derivative needle templates at Pt2+:Pd2−:Pt2− ratios of 1:1:0, 2:1:1, and 3:1:2 were pressed into free-standing films for electrochemical characterization as shown in Fig. 4(a). EIS was performed in 1.0 M KNO3 across a frequency range of 140 kHz–1 mHz, with the resulting Nyquist plots shown in Fig. 4(b). All three metal ratios exhibit capacitive behavior throughout the frequency range, especially at the mid-to-low frequency range. Figure 4(b) (inset) depicts the high-frequency response associated with all three Pt–Pd macrobeam films showing a depressed semi-circle and approximately 45° phase angle before quickly rising vertically suggesting a capacitive transmission line behavior associated with porous materials.[26] The difference in the Z′ axis intercept values is attributed to differences in contact resistance between the macrobeam films and the working electrode. Specific capacitance was determined from the low-frequency region of the EIS spectrum [Fig. 4(b)] using the relation,
 $$C_{{\rm sp}} = 1/(2\pi fZ^{\prime\prime} m),$$
(a) Photo of freestanding film with macrobeams synthesized from a Pt2+:Pd2−:Pt2− ratio of 1:1:0. (b) Electrochemical impedance spectroscopy (EIS) in 1.0 M KNO3 of Pt–Pd macrobeams synthesized from Pt2+:Pd2−:Pt2− ratios of 1:1:0, 2:1:1, and 3:1:2 for frequencies of 140 kHz–10 mHz; (inset) high-frequency EIS spectra from (b) for frequency range of 140 kHz–4 Hz. (c) Cyclic voltammetry (CV) in 0.5 M H2SO4 at scan rates of 10, 5, and 1 mV/s for Pt–Pd macrobeams synthesized from a Pt2+:Pd2−:Pt2− salt template ratio of 1:1:0. (d) CV scans at 1 mV/s for macrobeams synthesized from Pt2+:Pd2−:Pt2− salt template ratios of 1:1:0, 2:1:1, and 3:1:2.

where f is the frequency, Z″ is the imaginary component of impedance, and m is the sample mass. At 4 mHz, C sp for the Pt–Pd macrobeam films is 9.58 F/g for 1:1:0, 8.98 F/g for 2:1:1, and 11.73 F/g for 3:1:2. With an average metal capacitance value of 40 µF/cm2, the specific capacitances indicate specific surface areas of 24.9, 23.2, and 26.7 m2/g for the 1:1:0, 2:1:1, and 3:1:2 samples, respectively.[Reference Lukaszewski27] Using the ratio averaged densities of the 1:1:0, 2:1:1, and 3:1:2 samples, the specific capacitances and surface areas correspond to idealized nanoparticle sizes of 14.6, 13.6, and 11.4 nm and correlate well with the features observed in Fig. 2 SEM images.
CV of the three different Pt–Pd macrotube films was conducted in 0.5 M H2SO4 at scan rates of 1, 5, and 10 mV/s and shown in Fig. 4(c) for 1:1:0 (CV scans for 2:1:1 and 3:1:2 are shown in Fig. S7). The CV scan in Fig. 4(d) compares the three different Pt–Pd macrotube films at a 1 mV/s scan rate. The CVs indicate characteristic hydrogen adsorption and desorption peaks for platinum and palladium between −0.2 and 0 V (versus Ag/AgCl), along with the oxidation–reduction peaks more positive than +0.6 V (versus Ag/AgCl) associated with the bimetallic Pt and Pd. The oxidation peak observed at 0.45 V (versus Ag/AgCl) in Fig. 4(d) for the 2:1:1 and 3:1:2 samples is attributed to residual unreduced salt in the needle template, with the reduction half-cell reaction of:
 $$\lsqb {{\rm PtC}{\rm l}_{\rm 6}} \rsqb ^{2-} ({\rm aq}) + 2\,{\rm e}^-\to {\rm} \lsqb {{\rm PtC}{\rm l}_4} \rsqb ^{2-} ({\rm aq}) + 2\,{\rm C}{\rm l}^- ({\rm aq})\quad E^\circ = + 0.48\,{\rm V(Ag/AgCl)}{\rm.} $$
The more distinct current peaks between −0.2 and 0 V (versus Ag/AgCl) observed for the hydrogen adsorption and desorption events in 3:1:2 Pt–Pd macrotubes are attributed to an increased Pt composition (as seen with EDS and XPS) and to the higher electrochemically active surface area. Hydrogen adsorption and desorption current peaks normalized to sample mass (mA/g) at <0 V (versus Ag/AgCl) show the 1:1:0 and 2:1:1 samples produce higher current levels likely owing to the decreased molar mass of palladium.
Electrochemically accessible specific surface areas (ECSA) were calculated from the hydrogen adsorption peaks of the Fig. 4(d) 1 mV/s CV scans in 0.5 M H2SO4, correcting for double-layer capacitance, and using 210 µF/cm2 as the nominal capacitance per area for platinum.[Reference Biegler, Rand and Woods28] The resulting ECSA values were 21.1, 23.9, and 26.6 m2/g for the 1:1:0, 2:1:1, and 3:1:2 samples, respectively, and correlates well with specific surface area values determined with EIS in 1.0 M KNO3 electrolyte. The corresponding idealized nanoparticle sizes were 17.1, 13.2, and 11.4 nm, respectively, and correlates with feature sizes observed in Fig. 2 SEM images. Table S2 shows the specific capacitances, surface areas, and idealized particle sizes determined from EIS and CV in both 1.0 M KNO3 and 0.5 M H2SO4 electrolytes. The specific surface areas determined for the Pt–Pd porous macrobeams are similar to those found in Pt–Pd alloy nanoflower and Pt–Pd alloy graphene porous structure studies with values of 18.56 and 4.0–49.3 m2/g, respectively.[Reference Fu, Wu, Lin, Tang, Chen, Zhou and Lu29, Reference Hien, Thanh, Chuong, Hui, Kim and Lee30]
Conclusions
In this work, we demonstrated the synthesis of porous bimetallic macrobeams templated from the combination of Magnus’ and Vauquelin's salts. The combination of [Pt(NH3)4]2+ ions with varied concentrations of [PtCl4]2− and [PdCl4]2− is a method to assemble Pt–Pd salt templates, which after chemical reduction yield porous Pt–Pd macrobeams with square cross-section. This shape-controlled platform for the synthesis of bimetallic 3D hierarchical structures can lead to innovative design of 3D electrodes with tunable noble metal composition and catalytic properties. XPS and XRD indicated the presence of polycrystalline Pt and Pd and the ability to control elemental composition with the ratio of ions in the salt template. Specific capacitance as high as 11.73 F/g, and corresponding specific surface area of 26.6 m2/g of electrochemically active free-standing films, demonstrates the potential of salt templates as a synthesis method for shape-controlled bi-metallic micro- and nano-structures for electrocatalysis applications.
Supplementary material
The supplementary material for this article can be found at https://doi.org/10.1557/mrc.2018.217
Acknowledgments
This work was funded by a United States Military Academy Faculty Development Research Fund grant. We appreciate the assistance with polarized optical microscopy from Lance Richardson from the Department of Chemistry and Life Science at the United States Military Academy.