Risk factors for Clostridium difficile infection (CDI) include advanced age,Reference Halabi, Nguyen, Carmichael, Pigazzi, Stamos and Mills 1 – Reference Campbell, Beere, Wilcock and Brown 4 prior antimicrobial use, 5 – Reference Brown, Khanafer, Daneman and Fisman 11 underlying severity of illness,Reference Kyne, Sougioultzis, McFarland and Kelly 12 , Reference Loo, Bourgault and Poirier 13 and the patient’s environment.Reference Weber, Anderson and Rutala 14 – Reference McFarland, Mulligan, Kwok and Stamm 16 In terms of environmental risk factors for CDI, longer lengths of stayReference Palmore, Sohn, Malak, Eagan and Sepkowitz 6 and hospital units with more colonization pressure (higher rates of cases)Reference Dubberke, Reske and Olsen 17 are associated with CDI. When considering environmental CDI risk factors, the environment is usually defined at a local level—as a unitReference Dubberke, Reske and Olsen 17 or a room.Reference Weber, Anderson and Rutala 14 , Reference Shaughnessy, Micielli and DePestel 18 For example, the risk for CDI is higher for a patient occupying a room where a previous occupant had CDI.Reference Shaughnessy, Micielli and DePestel 18 However, patients travel to different rooms, to different units, and also to different hospitals. Thus, perhaps, a more expansive definition of the environment is needed—a health-system-level risk factor—to take into account how hospitals are connected to other hospitals via patient transfers.
Hospitals commonly share patients with other hospitals via direct transfers and indirectly via readmissions. Thus, patient sharing between hospitals may serve as a means for the dissemination of CDI and other healthcare-associated infections. Alternatively, patient transfers may indicate a level of increased severity of illness and thus hospitals with more transfers may be associated with a greater percentage of patients at risk for CDI, owing to their underlying disease state. Although simulation studies have helped support the notion that healthcare-associated infections disseminate via patient transfers,Reference Karkada, Adamic, Kahn and Iwashyna 19 – Reference Donker, Wallinga and Grundmann 23 to date, there has been less empirical work focused on measuring the potential for spreading healthcare-associated infections via patient transfers or specifically how the structure of transfer networks affects health care infection rates at included hospitals. The purpose of this article is to determine whether and to what extent the burden of CDI at hospitals is related to the hospital’s connectivity to other hospitals.
METHODS
Data
The Healthcare Costs and Utilization Project State Inpatient Database for California was the primary data source for this project. The Healthcare Costs and Utilization Project is a project of the Agency for Healthcare Research and Quality, and the State Inpatient Database provides event-level information for every inpatient stay in a nonfederal hospital for a given state and year. We used the 7 years 2005–2011, which include a set of variables for tracking and identifying revisits/readmission for a given patient. In total, the analyzed database comprises 24,110,945 records representing more than 9,652,292 unique patients in 480 unique hospitals.
Transfer Identification and Graph Construction
We considered patients with at least 2 records because patients with only 1 stay would not have a defined interval between stays. The records were ordered by admission date, and discharge date was computed using the length of stay. For each record, we computed the interval between the current record’s admission date and the discharge date of the most recent, non-overlapping stay.
Transfers were identified as a pair of stays with zero days between the discharge date of the first stay and the admission date of the second, and where the hospital in the first stay and second stay differed. We constructed 28 networks, one for each of the quarters from 2005 to 2011. We connected hospitals that shared patients via transfers and constructed a network graph. The connections between hospitals were weighted by the number of transfers between the 2 hospitals during the given quarter.
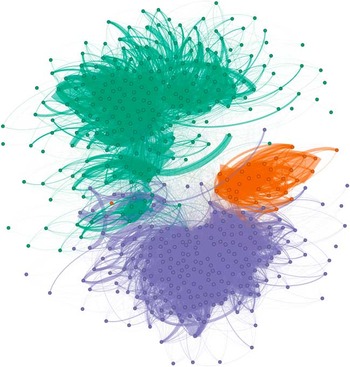
The connections between hospitals were used to construct a force-layout graph. The force-layout graph treats each hospital like a magnet that repels other magnets and each connection as a spring that draws them together. On the basis of the connections, we used a community-detection technique to identity network-based clusters.Reference Blondel, Guillaume, Lambiotte and Lefebvre 24
Network Properties
The network location of a given hospital was characterized by the hospital’s centrality in the network for that quarter. Specifically, we were interested in indegree (the number of unique hospitals from which transfers originate) and weighted indegree (the number of total patients transferred into a hospital) as predictors. We compute these 2 measures for each of the 28 quarters between 2005 and 2011.
Modeling
We modeled the mean number of cases of CDI for each hospital by quarter. We used a negative binomial generalized linear model with a log link. The negative binomial model distribution accommodates the unique properties of a discrete count response variable. Moreover, unlike the more restrictive Poisson distribution, the negative binomial distribution allows the variance to exceed the mean, which may be important for the accurate assessment of standard errors. We considered 3 models, 1 that is “network naive” and 2 that incorporate network information.
All models included 3 categories of predictor variables. First, we included variables that represent a hospital’s CDI risk stemming from patient mix, namely the log of the fraction of patients more than 65 years of age and the log of the hospital’s median length of stay. In addition, we included a set of 479 indicator variables as hospital identifier fixed-effects and 27 indicators for the number of quarters, starting with the first quarter of 2005. These 2 sets of indicators were included to account for unobserved differences between hospitals, namely practice style and residual heterogeneity in patient populations, and temporal patterns in the CDI rate. Finally, in order to control for hospital size, each model included an offset defined as the log-transformed number of admissions to the hospital in a particular quarter. In the generalized linear model framework, an offset is simply a variable included as a predictor with the corresponding regression coefficient fixed at 1. Note that an offset differs from a usual predictor in that the coefficient is fixed a priori and is not estimated from the data. In our generalized linear models, the inclusion of the offset permits the interpretation of the outcome as a rate, defined in terms of the mean CDI count relative to admissions for a particular quarter.
The first model (model 1) was simply based on the aforementioned covariates whereas the other 2 models added centrality estimates as predictors. Specifically, model 2 added log indegree and model 3 added log weighted indegree to the basic set of predictors in model 1. We did not fit a model with both log indegree and log weighted indegree owing to the extremely high correlation between these measures (r=0.91).
We compared the Akaike information criterion (AIC) of each fitted model. AIC is a measure that evaluates the quality of fit for a proposed model, penalizing for the number of predictors. Although it does not provide evidence of global lack-of-fit, AIC does provide a useful means for comparing fitted models on the basis of how well they balance the competing objectives of fidelity to the data and parsimony. As a general rule of thumb, a difference of 2 or more AIC units is considered meaningful in evaluating fitted model quality.
RESULTS
We identified 2,752,639 pairs of records separated by zero days. This amounts to 11% of all discharges. Over the 7 years of the study period, 21,256 unique connections or 9.2% of all possible connections are realized at least once. When aggregated to the hospital quarter level, there are 12,490 observations. This is slightly less than the expected 13,356 if all hospitals were included for each of the 28 quarters. The difference between the expected and the actual number of observations occurs owing to openings, closings, and other gaps in a hospital’s operation.
A force layout graph showing these connections is shown in Figure 1. The force layout graph shows the clusters that emerge from the interconnections of the hospitals. Each hospital is represented as a colored circle; the color reflects the “cluster membership.” The solid lines that connect the circles are transfers and act to draw hospitals closer together. This layout is an equilibrium state between the hospital’s tendency to repel other hospitals and the transfer’s tendency to draw them together. As such, the most highly connected hospitals are located toward the center of each cluster’s mass.
Map of hospitals (dots) and transfers (dark lines) in a force layout projection of the California data. Three major clusters in the California network, colored separately (San Diego in orange, Los Angeles in purple, and San Francisco and Northern California in green), were detected using network modularity clustering. This graph shows how tightly connected hospitals in California are.

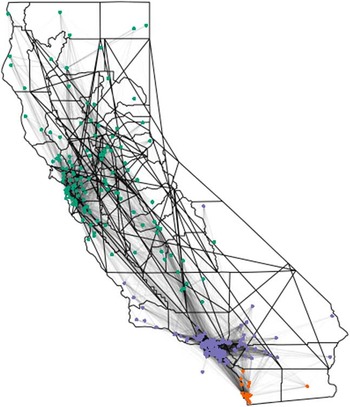
Figure 2 shows the same cluster membership and connections but on a map of the state. The clusters intuitively map to the large urban areas of California (San Diego, Los Angeles, and San Francisco and Northern California). However, the map does clearly show that these clusters are not strictly isolated from each other and, in fact, share many connections.
Map of hospitals (dots) and transfers (dark lines) on a map of California. The same connections from Figure 1 are projected onto a map of California. Major clusters are colored separately (San Diego in orange, Los Angeles in purple, and San Francisco and Northern California in green), and the map shows how transfers create closely connected hospitals, despite geographic distance.

Summary values for the number of cases, stays, and predictors are provided in Table 1. All of the variables exhibit highly skewed distributions, with a propensity toward low numbers. The degree of skew, especially in the network variables, is readily evident by comparing the mean and median numbers. The vast majority of hospitals accept a very small number of transfers per quarter (median, 13) from a small number of hospitals (median, 6). However, nearly 15% of hospitals have more than 30% of their admissions in the form of patient transfers and bring in hundreds of transfers from a large set of hospitals.
Hospital-Level Summary Statistics for Response and Predictor Variables

NOTE. The mean, minimum, and maximum value of each of the key variables is included. Because many of these variables are skewed, the 1st quartile (25th percentile) and 3rd quartile (75th percentile) are also given. CDI, Clostridium difficile infection; LOS, length of stay.
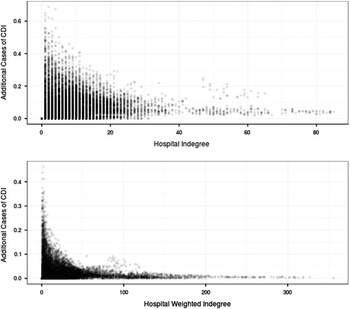
The effect estimates of increasing indegree or weighted indegree are both statistically and clinically significant. The first model indicates that a 1 unit increase in the log of the indegree, after controlling for other factors, is associated with a 4.8% (95% CI, 2.3%–7.4%) increase in the mean number of CDI cases. Likewise, using the second model, a 1 unit increase in the log of the weighted indegree is associated with a 3.3% (95% CI, 1.5%–5.2%) increase in the mean number of CDI cases. To transform these results to a more interpretable form, for each observed hospital over each of the 28 quarters, Figure 3 shows the expected increase in the number of cases of CDI corresponding to an increase of 1 in the indegree (1 additional connected hospital) and weighted indegree (1 additional transfer). Because of the log link, we are predicting a multiplicative change in the incidence of a hospital (eg, 3.3% increase). Consequently, the effect of an additive single unit increase in a predictor is not a constant increase in the mean number of cases but rather a constant multiplier of the mean baseline incidence. As such, when considering various baseline incidence values for different hospitals over the 28 quarters, there is a distribution of possible increases for a single unit increase as opposed to one fixed value.
Additionally, a fitted model that does not consider the network connections has an AIC of 63,543. However, adding indegree and weighted indegree reduces the AIC to 63,531 and 63,534, respectively. This reflects decreases of 9 to 14 AIC units when the network variables are added to the model. Including information about the hospital’s connectivity improves the quality of the fitted model relative to a naive model. This result suggests that network parameters, in the form of indegree and weighted indegree, contain information about a hospital’s CDI rate that is not already contained in the hospital fixed effects, quarter fixed effects, patient age, or length of stay.
DISCUSSION
Our results demonstrate that CDI burden at a hospital level can be better understood by knowing how a hospital is connected to other hospitals in terms of patient transfers. Specifically, we find that hospital-level CDI is related to 2 measures of patient transfers—one that considers the number of hospitals (indegree) and one that considers number of patients or volume of flow (weighted indegree). The purpose of this article was to demonstrate that transfers are a significant predictor of CDI, and not to compute an effect size for a specific hospital. Nevertheless, associated with increases in indegree and weighted indegree, we estimate increases in mean CDI that are both statistically and clinically significant. The partial test P values for the estimated effects from these models, combined with the model selection information from the AIC, strongly suggest that CDI incidence is related to transfer volume.
In practice it may not be either possible or desirable to decrease the number or direction of transfers for the sole purpose of preventing CDI. However, our results have broader implications for health policy and infection control. Recently, reimbursement rates have been tied to quality metrics with the assumption that healthcare-associated infections are in part preventable. However, if CDI rates are affected by connectivity, then risk adjustment models that consider only the factors at a given hospital will produce inaccurate results. If the connectivity and the behavior at the connections are outside of the influence of a hospital, imposition of penalties on that hospital may not bring about the desired result. In other words, if healthcare-associated infection rates are, in part, “regionally” determined as opposed to exclusively “locally” determined, these policies may need to consider a hospital’s region and connectivity to avoid inaccurately rewarding or penalizing hospitals.
Our results also have implications for infection control for infections beyond CDI. Hospital transfers can be a mechanism for the transmission of a broad range of infectious agents across healthcare facilities. Routinely, MRSA is likely spread through patient transfers.Reference Lesosky, McGeer, Simor, Green, Low and Raboud 20 , Reference Lee, Bartsch and Wong 25 In addition, the spread of multidrug-resistant gram-negative organisms has been documentedReference Kay, Vandevelde and Fiorella 26 , Reference Hobson, MacKenzie and Gould 27 and will continue to be an infection-control threat. Emerging infections can quickly spread through populations via healthcare environments, especially when patients who are colonized and/or in an asymptomatic phase of the disease are transferred. In addition, transferred patients may be symptomatic but undiagnosed. Transfers may dramatically affect the spread of diseases that are difficult to treat—for example, Ebola. In 2003 severe acute respiratory syndrome spread across hospitals in Toronto, and the transmission of the disease was maintained in healthcare facilities.Reference Svoboda, Henry and Shulman 28
Understanding how healthcare workers move and interact with patients within hospitals can help inform both disease surveillance approaches and infection-control interventions.Reference Curtis, Hlady, Kanade, Pemmaraju, Polgreen and Segre 29 – Reference Polgreen, Tassier, Pemmaraju and Segre 32 Understanding how patients move throughout a state will help inform both disease surveillance approaches and infection-control interventions for a wide range of infections. For example, in our hospital graph, the clustering identified 3 distinct clusters, yet all the clusters are also linked by hospital transfers. A relatively small number of hospitals in our network serve as bridges between the clusters. Thus, these are the hospitals that may be especially important to consider in terms of statewide infection-control efforts. Also, our results suggest that hospitals that are more connected are important to consider for surveillance. Thus, understanding the transfer pattern may help allocate scarce surveillance and infection-control resources more effectively.
Although it is possible that transfers and CDI are related mechanistically—that is, CDI is introduced by transferred patients, it is also quite possible that we are measuring something else. Indeed, the hospitals that are more connected may have higher CDI rates for some other reason. For example, highly connected hospitals may have patients with a much higher severity of illness. Accordingly, higher CDI rates could be caused by a greater proportion of patients at a higher risk of developing CDI owing to their underlying severity of illness. However, we did control for differences among hospitals with hospital identifier fixed effects. Furthermore, even if our results simply represent an association, and transfers themselves are not directly causing higher CDI rates, our results are still important for infection control: hospital infection rates are related to a hospital’s position in the network.
As with any empirical work, our models are not without limitations. First, the Healthcare Costs and Utilization Project data set does not include information about specific nursing homes or long-term care facilities. These facilities may act as intermediates between hospitals and may serve to strongly connect otherwise weakly connected hospitals via indirect transfers.Reference Lee, Bartsch and Wong 25 Second, we are relying on administrative data, which does not include any microbiologic data. Nor does it include drug data—for example, antibiotics. However, our hospital identifier fixed effects partially serve to control for differences in diagnosing CDI and antibiotic use among hospitals. Third, we are able to measure only CDI cases that are identified either on admission or during a hospital stay. Clearly, many cases occur after a patient’s stay.Reference Kuntz and Polgreen 33 Future work should explore alternative data sources with postdischarge information in an attempt to correctly attribute possible community cases to institutions and further investigate the role of a hospital’s centrality as a risk factor for CDI. Fourth, network centrality is a risk factor for CDI primarily in only the more-connected hospitals. Finally, our modeling framework accommodates the heterogeneity among hospitals using fixed effects as opposed to random effects. Mixed effects models, based on the latter approach, were considered. However, mixed effects modeling requires the random effects be uncorrelated with the predictors. It is unlikely that the random effects are truly uncorrelated with the indegree of a hospital and, as such, mixed effects models would not accurately estimate the effect of indegree. The fixed effects approach avoids this potential problem because the correlation of the hospital indicator fixed effects with the predictors is permitted.
Despite the limitations of our work, we demonstrate that hospital transfers are associated with CDI rates. These results have implications for understanding how CDI is spread and for conceptualizing how to attribute CDI risk to hospitals. This may facilitate the design of better infection-control programs, not only for CDI, but also for other hospital-associated infections. Although most infection-control programs are promoted at the hospital level, our results provide evidence that infection-control issues related to CDI cross hospital boundaries. In order to understand how CDI is spread and ultimately how the disease can be better controlled, it is important to explore how the interconnectedness of hospitals affects the spread of CDI and other infectious diseases. Finally, our approach has implications for designing hospital-based surveillance and may ultimately lead to statewide infection-surveillance-and-control programs.
Increase in expected Clostridium difficile infection (CDI) incidence with a 1 unit increase in indegree (top) or weighted indegree (bottom), adjusted for the observed hospital characteristics. The x-axis represents the initial indegree/weighted indegree and the y-axis represents the increase in the number of expected cases of CDI per quarter for that hospital. The value is the difference between the predicted number at the starting value of indegree/weighted indegree and the predicted number of cases at 1 plus the starting value.

ACKNOWLEDGMENTS
Financial support. American Foundation for Pharmaceutical Education (dissertation fellowship to J.E.S.), the National Heart, Lung and Blood Institute (grant 1K25HL122305-01A1 to L.A.P.), and the UI Health Care eHealth and eNovation Center (P.M.P.).
Potential conflicts of interest. All authors report no conflicts of interest relevant to this article.