Introduction
Retinitis pigmentosa (RP) comprises a group of inherited retinal disorders characterized by progressive loss of retinal function and represents a major cause of blindness (Hartong et al., Reference Hartong, Berson and Dryja2006). More than 100 distinct mutations in the rhodopsin gene have been identified, accounting for 30–40% of autosomal dominant (ad) RP (https://sph.uth.tmc.edu/retnet/disease.htm). One of the most common rhodopsin mutations is the proline-to-histidine substitution at codon 23 (P23H), accounting for approximately 10% of all adRP cases in the United States (Dryja et al., Reference Dryja, Hahn, Cowley, McGee and Berson1991). The P23H line 3 (P23H-3) transgenic albino rat carries this human RP mutation and undergoes a gradual photoreceptor loss that is generally characteristic of human adRP, providing a model to investigate the cellular mechanisms that lead to photoreceptor loss and possible therapeutic strategies (LaVail et al., Reference LaVail, Yasumura, Matthes, Drenser, Flannery, Lewin and Hauswirth2000; Machida et al., Reference Machida, Kondo, Jamison, Khan, Kononen, Sugawara, Bush and Sieving2000; Aleman et al., Reference Aleman, LaVail, Montemayor, Ying, Maguire, Laties, Jacobson and Cideciyan2001; Jensen, Reference Jensen2012). Following a rapid loss of photoreceptors between weeks 4 and weeks 8, by ∼P140, a further gradual photoreceptor death leads to ∼45% cell loss in the P23H-3 rat retina compared to the control retina (Machida et al., Reference Machida, Kondo, Jamison, Khan, Kononen, Sugawara, Bush and Sieving2000). The electroretinographic results show a photoreceptor response reduction of approximately 1 log unit (using an a-wave criterion response), with no measureable difference in postreceptoral responses (using a b-wave criterion response) at 29 weeks (Machida et al., Reference Machida, Kondo, Jamison, Khan, Kononen, Sugawara, Bush and Sieving2000). Although reduced, there is still a detectable photoreceptor response at 13 months (Aleman et al., Reference Aleman, LaVail, Montemayor, Ying, Maguire, Laties, Jacobson and Cideciyan2001). Aleman et al. (Reference Aleman, LaVail, Montemayor, Ying, Maguire, Laties, Jacobson and Cideciyan2001) also reported a discrepancy in the amount of loss in photoreceptor versus bipolar cell response and suggested altered circuitry (increased sensitivity in the photoreceptor-to-bipolar cell signaling).
Many studies have evaluated the underlying mechanisms by which the P23H mutation leads to the death of photoreceptors (Traverso et al., Reference Traverso, Bush, Sieving and Deretic2002; Yu et al., Reference Yu, Cringle, Valter, Walsh, Lee and Stone2004; Yu & Cringle, Reference Yu and Cringle2005; Acosta et al., Reference Acosta, Shin, Ready, Fletcher, Christie and Kalloniatis2010). Yu and colleagues reported that the oxygen environment in the P23H-3 retina was altered by 15–20 weeks, a stage when a significant number of photoreceptors are lost (Yu et al., Reference Yu, Cringle, Valter, Walsh, Lee and Stone2004; Yu & Cringle, Reference Yu and Cringle2005). Notably, the remaining photoreceptors were left in a chronically hyperoxic environment which the authors proposed could lead to accelerated photoreceptor death via oxidative stress. In the developing P23H-3 retina, photoreceptor apoptosis was accompanied by increased metabolic activity, including elevated levels of lactate dehydrogenase, ATPase activity, and ATP, representing a potential cause of photoreceptor death (Acosta et al., Reference Acosta, Shin, Ready, Fletcher, Christie and Kalloniatis2010). An increase in dark-adapted photoreceptor cAMP levels was also observed in the P23H rats, which was potentially toxic and capable of promoting cell death (Traverso et al., Reference Traverso, Bush, Sieving and Deretic2002). In two rodent models of retinal dystrophy, the Royal College of Surgeons (RCS) rat and the rd1 mouse, the organic cation agmatine (1-amino-4-guanidobutane, AGB) has been shown to label photoreceptors destined to degenerate (Kalloniatis et al., Reference Kalloniatis, Tomisich, Wellard and Foster2002; Acosta et al., Reference Acosta, Fletcher, Azizoglu, Foster, Farber and Kalloniatis2005). The implication of this work in the RCS and rd1 rodent models is that unregulated cation entry is a precursor to photoreceptor death. We therefore wanted to fully characterize AGB labeling in the P23H-3 retina.
Anatomical remodeling of neurons of the inner retina is known to occur in retinal diseases involving photoreceptor dysfunction (Fariss et al., Reference Fariss, Li and Milam2000; Lewis et al., Reference Lewis, Charteris, Sethi, Leitner, Linberg and Fisher2002; Jones et al., Reference Jones, Watt, Frederick, Baehr, Chen, Levine, Milam, Lavail and Marc2003, Reference Jones, Kondo, Terasaki, Lin, McCall and Marc2012; Marc et al., Reference Marc, Jones, Watt and Strettoi2003; de Souza et al., Reference de Souza, Kalloniatis, Polkinghorne, McGhee and Acosta2012). Marc et al. (Reference Marc, Jones, Watt and Strettoi2003) describe three general stages of remodeling: Phase 1 is the rod degeneration phase where massive rod death and photoreceptor anatomical remodeling occur. Phase 2 is the cone degeneration stage involving greater anatomical remodeling including the formation of the glial seal followed by Phase 3 reflecting further anatomical remodeling (Marc et al., Reference Marc, Jones, Watt and Strettoi2003). Within the inner retina of the P23H-1 rat, synapses and neuronal connectivity undergo significant alterations (Cuenca et al., Reference Cuenca, Pinilla, Sauve, Lu, Wang and Lund2004; Pinilla et al., Reference Pinilla, Lund and Sauve2005). These changes involve a reduction of postsynaptic metabolic glutamate receptor staining, continued loss of bipolar dendrites, and atrophy of their axons (Cuenca et al., Reference Cuenca, Pinilla, Sauve, Lu, Wang and Lund2004). A reduced and disorganized AII amacrine cell population was evident in the thinning inner plexiform layer after P270 (Cuenca et al., Reference Cuenca, Pinilla, Sauve, Lu, Wang and Lund2004). The anatomical remodeling described by Jones et al. (Reference Jones, Watt, Frederick, Baehr, Chen, Levine, Milam, Lavail and Marc2003) occurs after all photoreceptors are lost: by P372 in the P23H line 1 rat retina.
Bipolar cells loose functional glutamate drive in models of retinal dystrophy when all photoreceptors are lost and express aberrant functional glutamate receptors when some photoreceptors are present (Marc et al., Reference Marc, Jones, Anderson, Kinard, Marshak, Wilson, Wensel and Lucas2007). This neurochemical and functional remodeling also referred to as “reprogramming” has also been described in other models of RP, such as rd1 and rd10 models (Chua et al., Reference Chua, Fletcher and Kalloniatis2009; Puthussery et al., Reference Puthussery, Gayet-Primo, Pandey, Duvoisin and Taylor2009). In the rd1 mouse inner retinae, bipolar cells and amacrine cells undergo selective remodeling of glutamate receptors during early phases of retinal degeneration (between P12 and P40) when cone photoreceptors are still present (Chua et al., Reference Chua, Fletcher and Kalloniatis2009). ON cone bipolar cells that normally express metabotropic glutamate receptors, aberrantly express functional ionotropic receptors responsive to kainic acid, KA and α-amino-3-hydroxy-5-methyl-4-isoxazolepropionic acid, AMPA (Chua et al., Reference Chua, Fletcher and Kalloniatis2009). We wanted to fully characterize the inner retinal neurons response to ionotropic glutamate receptor application during photoreceptor degeneration in the P23H rat retina. Characterizing functional remodeling is critical for the success of therapeutic interventions, such as stem cell transplantation or prosthetic device implantation, as they depend on the intact and functionality of inner neural circuitry downstream of the disease locus. Intervention measures will be better targeted and provide better clinical outcomes if we understand the time course and the specific neurotransmitter receptors affected when aberrant functional glutamate receptor function remodeling occurs.
The aim of the present study was to evaluate neurochemical modifications in the P23H-3 retina and investigate photoreceptor cation channel permeability and glutamate receptor activation in distinct populations of bipolar, amacrine, and ganglion cells in the P23H-3 rat retina as a function of development and degeneration. In particular, we wanted to determine whether aberrant functional glutamate receptors were present during the photoreceptor degeneration phase and before major anatomical remodeling would occur (beyond P372 for P23H-1 rat: Jones et al., Reference Jones, Watt, Frederick, Baehr, Chen, Levine, Milam, Lavail and Marc2003). The function of glutamate receptors were assessed by tracking an organic cation, AGB, which permeates through nonspecific cation channels (Marc, 1999a,Reference Marcb; Marc et al., Reference Marc, Kalloniatis and Jones2005).
Materials and methods
Animal models
Sprague–Dawley (SD) and proline-23-histidine line 3 (P23H-3) rats were obtained from the University of Auckland Animal Research Unit. All experiments were conducted in accordance with the Association for Research in Vision and the Ophthalmology statement for the use of animals in ophthalmic and vision research. The institutional animal ethics committee in compliance with the code for animal handling approved all protocols.
Rats at various developmental ages, from postnatal day P0 (date of birth) to P138, were used. At each age point, tissue from 4 to 6 animals were collected. All rats were kept in a 12-h dark and 12-h low-light levels (60 lux) cycle. All animals were provided with standard food and water ad libidum. Adult animals were anaesthetized using a combination of 35 mg/kg Ketamine and 5 mg/kg Domitor. Neonates (P0 and P6) were placed on ice to anaesthetize by hypothermia and then were guillotined with a sharp blade. The globe was quickly dissected, conjunctiva and extraocular muscles removed, and an incision made 1–2 mm posterior to the limbus to remove the anterior part of the eye. The posterior eyecup was then mounted on metrical filter membranes (0.8 μm pore size, Gelman Sciences, Ann Arbor, MI). The sclera was gently peeled off from samples to allow for AGB incubation experiments as described in previously published protocols (Sun & Kalloniatis, Reference Sun and Kalloniatis2006; Yu et al., Reference Yu, Acosta, Ready, Cheong and Kalloniatis2007).
AGB tracking
AGB is an organic polyamine that enters nonselective cationic channels (Yoshikami, Reference Yoshikami1981; Kuzirian et al., Reference Kuzirian, Meyhofer, Hill, Neary and Alkon1986; Marc, 1999b) and has been used as a suitable marker to characterize the properties of cation channels (Kalloniatis et al., Reference Kalloniatis, Tomisich, Wellard and Foster2002; Acosta et al., Reference Acosta, Fletcher, Azizoglu, Foster, Farber and Kalloniatis2005; Marc et al., Reference Marc, Kalloniatis and Jones2005). There are two basic approaches to cation tracking: basal AGB labeling and ligand-activated AGB labeling. Basal AGB incubation reflects constitutively open cation channels when assessing photoreceptor AGB labeling or the endogenous glutamate drive within inner retinal neurons or their axons (Marc, 1999a,Reference Marcb; Kalloniatis et al., Reference Kalloniatis, Tomisich, Wellard and Foster2002; Fu & Sretavan, Reference Fu and Sretavan2012; Nivison-Smith et al., 2013). Ligand-activated AGB entry, involving pharmacological agents to activate ionotropic glutamate receptors, reflects the functionality of glutamate receptors in postreceptoral neurons (Kalloniatis et al., Reference Kalloniatis, Sun, Foster, Haverkamp and Wässle2004; Marc et al., Reference Marc, Kalloniatis and Jones2005; Sun & Kalloniatis, Reference Sun and Kalloniatis2006).
Each retinal sample was incubated for 5 min in a physiological medium containing either AGB (25 mM) alone or AGB (25 mM) with the receptors agonist, AMPA or KA (Marc, 1999a,Reference Marcb; Sun & Kalloniatis, Reference Sun and Kalloniatis2006; Chua et al., Reference Chua, Fletcher and Kalloniatis2009). The AGB incubation solution use a modified brain physiological buffer containing 125 mM NaCl, 2.5 mM KCl, 26 mM NaHCO3, 1.25 mM NaH2PO4, 10 mM dextrose, 2 mM CaCl2, and 1 mM MgCl2 (pH 7.4) (Edwards et al., Reference Edwards, Konnerth, Sakmann and Takahashi1989; Sun & Kalloniatis, Reference Sun and Kalloniatis2006). AGB was added to the incubation medium when an equimolar NaCl was reduced. The incubation buffer was bubbled in 95% O2/5% CO2 for at least 1 h at 37°C before addition of the glutamate receptor agonist (Marc, 1999a,Reference Marcb; Sun et al., Reference Sun, Rait and Kalloniatis2003; Kalloniatis et al., Reference Kalloniatis, Sun, Foster, Haverkamp and Wässle2004; Sun & Kalloniatis, Reference Sun and Kalloniatis2006). Pharmacological agents (30 μM AMPA and 50 μM KA) were added to a concentration that achieved near maximal activation of bipolar cells and amacrine cells as published previously. Retinas were incubated for 5 min at 37°C then aldehyde fixed and processed for immunocytochemistry.
Silver-intensified immunocytochemistry
For silver-intensified immunocytochemistry, retinae were fixed in 2.5% glutaraldehyde/1% paraformaldehyde in phosphate buffer. Detailed methods regarding the preparation of the tissue have been previously described (Marc et al., Reference Marc, Liu, Kalloniatis, Raiguel and van Haesendonck1990, Reference Marc, Murry and Basinger1995; Kalloniatis & Fletcher, Reference Kalloniatis and Fletcher1993; Sun et al., Reference Sun, Rait and Kalloniatis2003). Briefly, tissues were processed for resin embedding and resin blocks were sectioned at 500 nm using a Reichert-Jung Ultracut S microtome (Leica, Austria). Tissues were collected on water in 12-well teflon coated slides, air dried, and processed for removal of the resin and hydration before they were incubated with the antibody. The primary rabbit AGB polyclonal antibody was diluted in 1% goat serum in phosphate buffered saline at the working concentration of 1:600. The AGB antibody was a kind gift from Dr. Robert Marc (University of Utah, Salt Lake City, UT) and is commercially licensed to Signature Immunologics and available from Millipore (Temecula, CA) or Abcam (Cambridge, MA). After incubating overnight, the primary antibody was detected using a goat anti-rabbit IgG antibody adsorbed to 1 nm gold particles (Amersham Biosciences, Arlington Heights, IL) and visualized after applying a silver intensification protocol (Kalloniatis & Fletcher, Reference Kalloniatis and Fletcher1993). All samples that underwent quantitative analysis were processed, probed, and imaged in an identical manner.
Fluorescence immunocytochemistry
For fluorescence immunocytochemistry, tissues were fixed in 4% paraformaldehyde and 0.01% glutaraldehyde in 0.1 M phosphate buffer for 30 min at 4°C. Tissues were processed for cryoprotection in an increasing concentration series of sucrose solution up to 30%. A central area of the retina was then sectioned in the vertical plane with a thickness of 16 μm using a cryostat (Leica, Germany). Sequential sections were placed on superfrost precleaned microscope slides (Biolab scientific, New Zealand) and stored at −20°C. Retinal sections were blocked in 6% normal goat serum in 0.1 M phosphate buffer (pH 7.4) containing 1% bovine serum albumin (BSA) with 0.5% Triton for 1 h at room temperature. Primary antibodies were diluted in 3% goat serum, 1% BSA, and 0.5% Triton-X 100, and the tissue was left with primary antibodies overnight. The secondary antibodies (Alexa 488 conjugated goat anti-rabbit and Alexa 594-conjugated goat anti-mouse) were then applied after washing the slides with 0.1 M phosphate buffer. The tissues were incubated with secondary antibodies for 3 h at room temperature. The slides were then washed, cover slipped using citifluor, and stored at 4°C.
The specificity of the antibodies used in this study has been proven in the rat and mouse retina, which display high specificity with minimal cross reactivity (Haverkamp & Wässle, Reference Haverkamp and Wässle2000). Information of primary antibodies is outlined in Table 1. The AGB antibody recognizes only agmatine aldehyde coupled to a protein carrier using dot blot immunoassays (Marc, 1999b). Glial fibrillary acidic protein (GFAP) antibody labels retinal astrocytes in the nerve fiber layer and upregulation of GFAP expression in Müller cells is commonly used as an indicator of reactive gliosis in response to various retinal pathologies (Nork et al., Reference Nork, Ghobrial, Peyman and Tso1986; Ramirez et al., Reference Ramirez, Trivino, Ramirez, Salazar and Garcia-Sanchez1994; Lewis & Fisher, Reference Lewis and Fisher2003; de Souza et al., Reference de Souza, Kalloniatis, Polkinghorne, McGhee and Acosta2012). Both calretinin (CR) and parvalbumin (PV) belong to the EF-hand calcium-binding protein family. In the rat retina, CR immunoreactivity is found in a range of amacrine cells in the inner part of the inner nuclear layer, numerous cells in the ganglion cell layer, and three distinct bands in the inner plexiform layer (Pasteels et al., Reference Pasteels, Rogers, Blachier and Pochet1990; Mojumder et al., Reference Mojumder, Wensel and Frishman2008). PV is mainly expressed in AII amacrine cells in the inner nuclear layer, some ganglion cells, and displaced amacrine cells in the ganglion cell layer (Sanna et al., Reference Sanna, Keyser, Battenberg and Bloom1990; Wässle et al., Reference Wässle, Grünert and Rohrenbeck1993; Park et al., Reference Park, Park, Park, Chun and Oh2008). Protein kinase Cα (PKCα) is a well-established rod bipolar cell marker and the labeling pattern is identical to that previously reported (Greferath et al., Reference Greferath, Grünert and Wässle1990; Strettoi et al., Reference Strettoi, Pignatelli, Rossi, Porciatti and Falsini2003; Sun & Kalloniatis, Reference Sun and Kalloniatis2006; Acosta et al., Reference Acosta, Bumsted O’Brien, Tan and Kalloniatis2008). Islet-1 antibody is known to label rod and ON cone bipolar cells along with cholinergic amacrine cells and cells in the ganglion cell layer (Elshatory et al., Reference Elshatory, Deng, Xie and Gan2007).
List of antibodies used in the silver intensified or fluorescence immunocytochemistry

Apoptotic assay
Detection of cell death in the retinal specimens was achieved using the terminal deoxynucleotidyl transferase mediated fluorescein dUTP nick end labeling (TUNEL) technique (Gavrieli et al., Reference Gavrieli, Sherman and Ben-Sasson1992). This technique uses the In Situ Cell Death Detection Kit from Roche Applied Science (Penzberg, Germany). Retinal sections were processed for TUNEL following the supplier procedure. Retinas were immunolabeled using the AGB antibody and the TUNEL technique was applied 1 h before completion of the secondary antibody labeling.
Image acquisition and quantification
For silver-intensified immunocytochemistry, digital images were acquired with a Leica DC500 camera, twain model V4.1.00 mounted on a Leica DC 500 microscope (Leica Microsystems Ltd, Wetzlar, Germany). Only the central area was used for all the quantification to minimize any variation in eccentricity-dependent photoreceptor degeneration. AGB positive photoreceptor cells were sampled in three separated areas of outer nuclear layer, which accounted for approximately 100,000 μm2 per retina. The area over which counting was performed was calculated using a calibrated grid placed over the retinal images. A person blind to the purpose of the experiment performed the quantification.
Fluorescent immunolabeled sections were observed first with the aid of a fluorescent microscope (Leica DRA2, Germany) and all micrographs were obtained using a confocal microscope (Leica TCS 4D) at 40× magnification using Argon–Krypton lasers. Images of 1 μm thickness were captured and a seven-image stack was created. The images were analyzed and brightness and contrast adjustment was made using Adobe Photoshop (6.0 Adobe systems, Mountain View, CA). No other digital image processing was performed. For the purpose of quantification, images were captured using a 20× objective on the Leica DRA2 microscope. Cells identified by specific macromolecular markers and number of cells with AGB or TUNEL labeling were counted per unit area. A distinct soma labeling above background levels was the main criteria used in the cell counting of faint labeled markers such as that resulting from AGB labeling. Samples from at least four retinas for each condition were acquired to allow for quantification of the data.
Statistical analysis
Regular two-way ANOVA followed by post hoc tests were applied on comparison of data obtained from SD and P23H-3 retina at several developmental ages (Figs. 1 and 4). Student t-tests were applied to data acquired from SD and P23H-3 retina at a particular activation condition (Fig. 5). A p-value below 0.05 was considered to be significant.
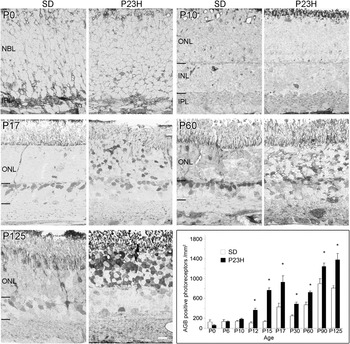
Bright field micrographs showing agmatine (AGB) labeling in the SD and P23H-3 rat retina and quantification of AGB positive photoreceptors as a function of age. SD retina showed a normal pattern of development, from uniform neuroblast layer at P0 to separation of outer and inner nuclear layers at P10. A few photoreceptors were labeled with AGB. P23H-3 retina at P0 and P10 was identical to SD. The number of AGB labeled photoreceptor cells steadily increased through the development of the SD and P23H-3 rat. Mean density of AGB positive photoreceptors was plotted into a graphic format. From P12, there was an increased number of AGB labeled photoreceptors in P23H-3 retina compared to SD. Significant values for individual ages are indicated with an asterisk (at least p < 0.05). Solid parallel lines indicate the borders of inner nuclear layer. Scale bar, 10 μm. Abbreviations: NBL—neuroblast layer, ONL—outer nuclear layer, INL—inner nuclear layer, IPL—inner plexiform layer.

Results
AGB labeling pattern in the developing retina
Evaluation of the basal entry of AGB into neurons of the retina reflects endogenous glutamate drive and can be used to identify dysfunctional photoreceptors (Marc, 1999a,Reference Marcb; Kalloniatis et al., Reference Kalloniatis, Tomisich, Wellard and Foster2002; Acosta et al., Reference Acosta, Fletcher, Azizoglu, Foster, Farber and Kalloniatis2005; Marc et al., Reference Marc, Kalloniatis and Jones2005; Yu et al., Reference Yu, Acosta, Ready, Cheong and Kalloniatis2007). To determine the cation channel permeability in the P23H-3 retina, we assessed the basal AGB labeling pattern of the normal SD and degenerative P23H-3 rat retinae from P0 to P125 (Fig. 1). AGB-labeled photoreceptors were quantified at each age group and compared between SD and P23H-3 rats.
At birth, the stratified structure of the retina was not evident and little cellular labeling of AGB was detected. Light labeling of the developing ganglion cells was observed. At P10, the outer plexiform layer became evident dividing the retina into outer and inner nuclear layers. There was no AGB labeling in the outer nuclear layer although a few AGB labeled horizontal and amacrine cells were observed in the inner nuclear layer. No difference in AGB labeling of developing photoreceptors between the SD and P23H-3 retinae was evident until P12, where the AGB labeling pattern started to deviate in the P23H-3 retina which showed more distinctly AGB labeled photoreceptor nuclei. As demonstrated at P17, the normal retina mainly exhibited AGB labeled cells in the inner nuclear layer predominantly reflecting bipolar cell labeling (Kalloniatis et al., Reference Kalloniatis, Sun, Foster, Haverkamp and Wässle2004). In the P23H-3 rat, similar AGB labeling was evident in the inner nuclear layer in addition to an obvious increase of AGB labeling of photoreceptors. At P60, AGB labeling of photoreceptors in the P23H-3 retina increased without major changes to the inner retina. A vast number of photoreceptors were heavily AGB labeled in the P23H-3 retina at P125. Statistical analysis (two-way ANOVA, P < 0.0001) showed that at all age groups from P12 to P125, the density of AGB positive photoreceptors (per unit area of outer nuclear layer) were significantly increased in the P23H-3 rats compared to the SD rats.
Photoreceptor TUNEL and AGB labeling and glial GFAP labeling
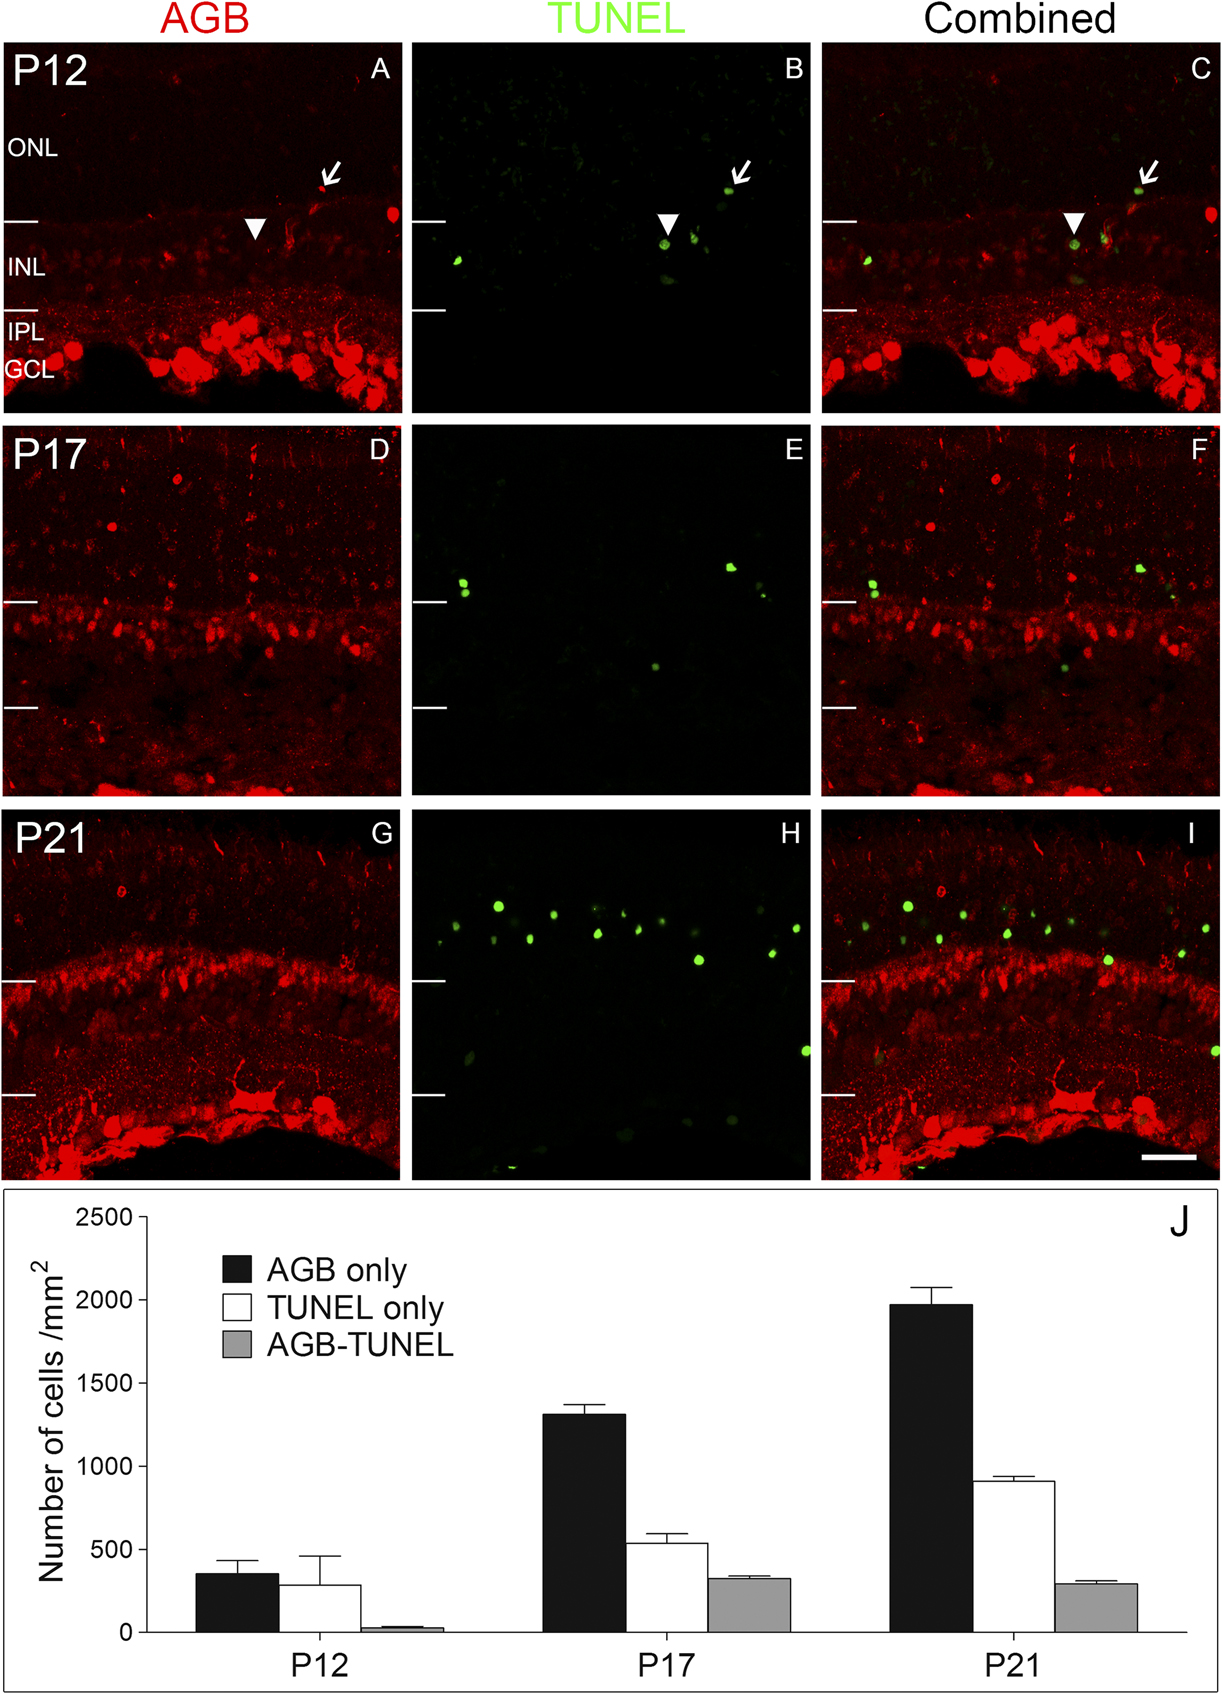
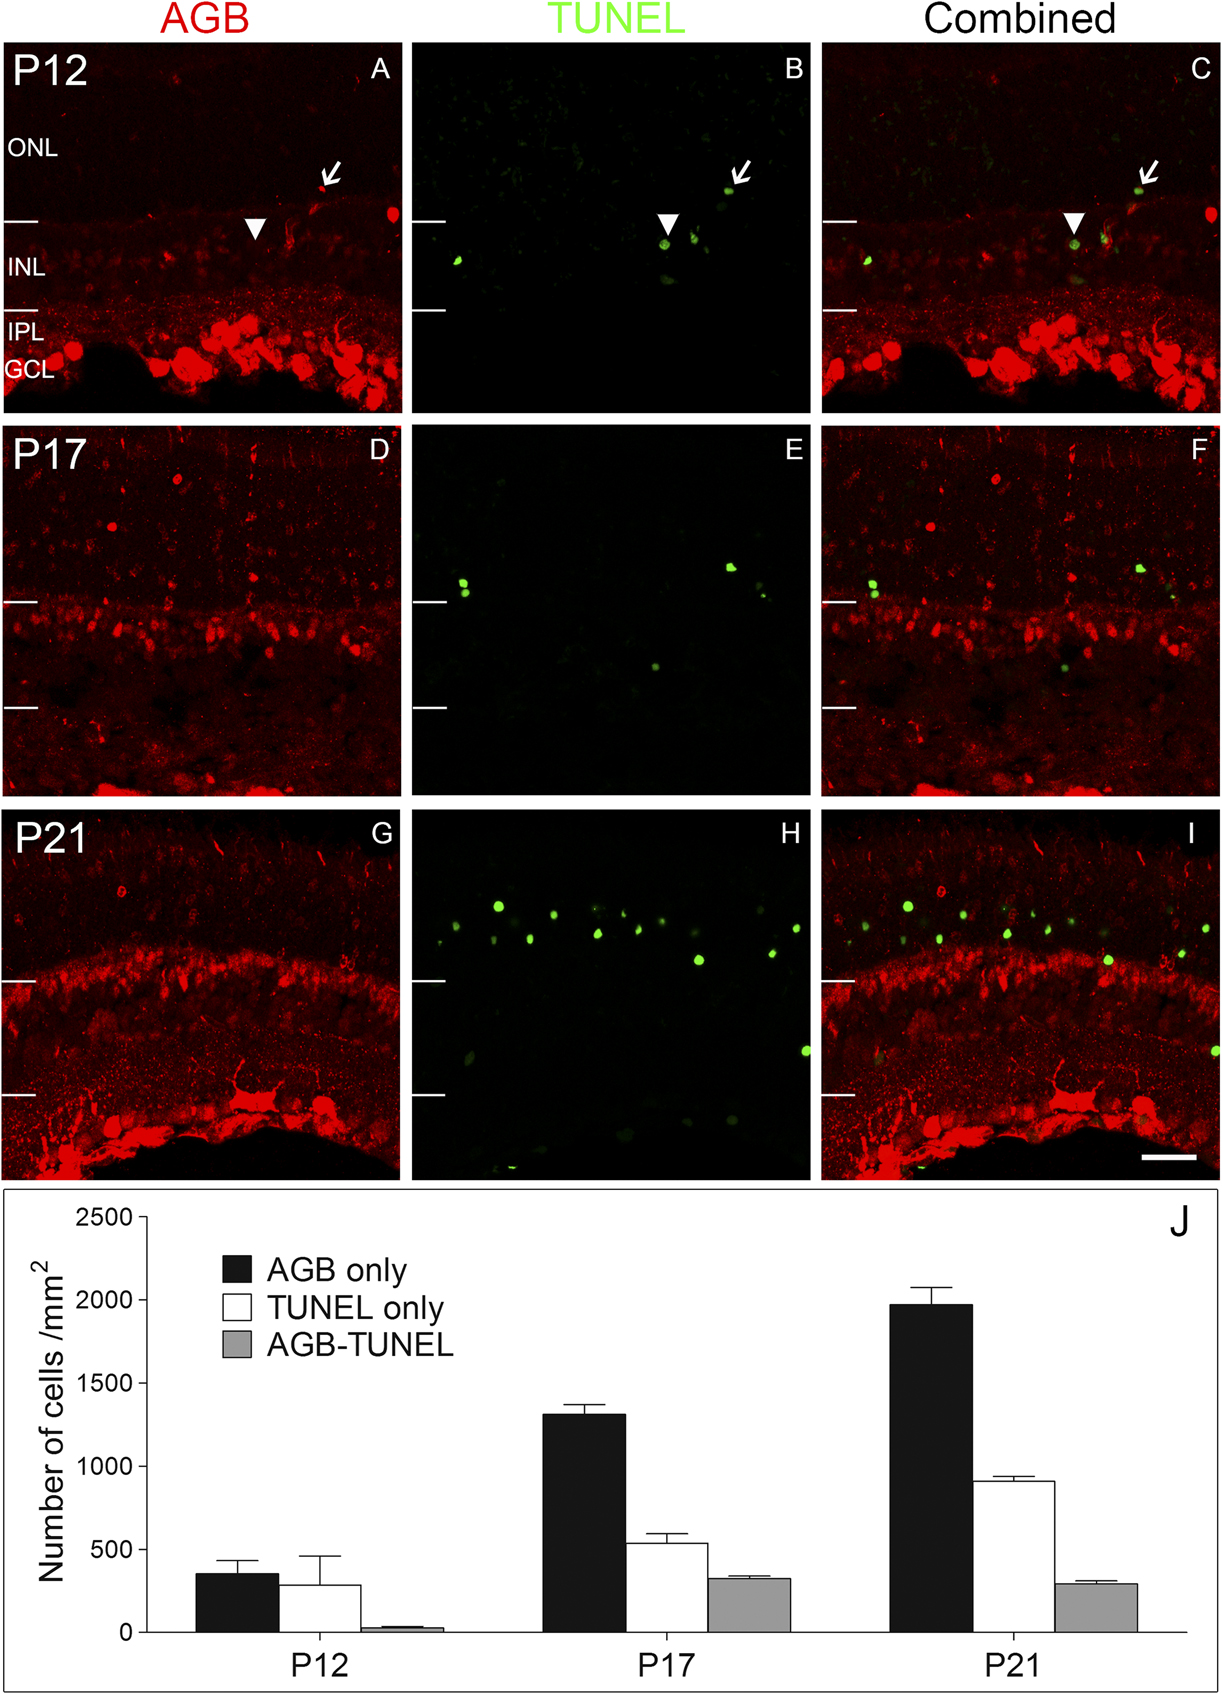
To determine whether increased AGB permeation was related to photoreceptor cell death in the P23H-3 rat, retinae were double stained for AGB and a marker of nuclear cell damage, TUNEL. Fig. 2 shows colocalization of AGB (red) and TUNEL (green) in P23H-3 retinae at P12, P17, and P21, which was also quantified as cells per unit area. Fluorescence immunocytochemistry showed a similar AGB labeling pattern of the SD and P23H retina as shown earlier using silver intensified immunolabeling. In addition to the strong labeling of amacrine cells and bipolar cells in the inner nuclear layer, some photoreceptor somata were also AGB positive. Within the photoreceptor layer at P12, approximately equal proportions were AGB positive or TUNEL positive but few somata colocalized. The number of TUNEL positive photoreceptors in the P23H retina almost tripled from P12 to P21 while there was a 5 times increase in the number of AGB only labeled photoreceptors (Fig. 2J). Co-localization, however, remained low even at P21.
Distribution and density of AGB and TUNEL positive photoreceptors in the P23H-3 rat at early developmental ages. Representative micrographs of AGB (red) and TUNEL (green) double staining in the retina of P23H rats at P12 (A–C), P17 (D–F), and P21 (G–I). Arrows indicated a photoreceptor cell that is positive for both AGB and TUNEL labeling. Arrowheads indicated a cell in the inner nuclear layer that is positive for TUNEL labeling but negative for AGB labeling. Mean density of AGB positive, TUNEL positive, and AGB/TUNEL double labeled photoreceptor cells were plotted in a graphical format (J). Abbreviations as in Fig. 1, GCL (ganglion cell layer). Scale bar, 20 μm.
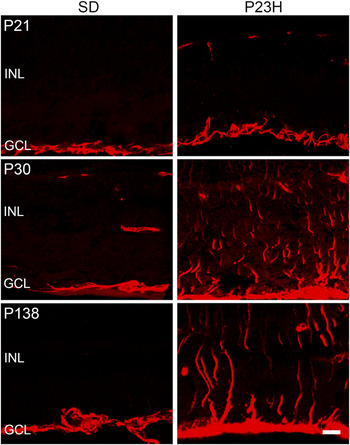
GFAP was employed as an indicator of retinal stress (gliosis) (Lewis & Fisher, Reference Lewis and Fisher2003; Yu et al., Reference Yu, Cringle, Valter, Walsh, Lee and Stone2004; Chua et al., Reference Chua, Nivison-Smith, Fletcher, Trenhom, Awatramani and Kalloniatis2013). At all ages examined, the SD retina showed GFAP labeling solely in astrocytes located in the nerve fiber layer (Fig. 3). At P21, GFAP labeling in the P23H-3 retina was limited to the astrocytes in the nerve fiber layer. However, at P30, intense GFAP labelling was observed in Müller cell processes, which correlated well with the peak time of photoreceptor apoptosis (Yu et al., Reference Yu, Cringle, Valter, Walsh, Lee and Stone2004). Gliotic changes appeared after increased AGB permeation to photoreceptors.
Confocal micrographs of GFAP labeling in the retina of SD and P23H-3 rats at P21, P30, and P138. GFAP upregulation in the Müller cell processes indicated tissue stress in the P23H-3 retina as early as P30. Occasional labeling in the outer retina that does not radiate from the astrocyte labeling is due to nonspecific secondary antibody binding (e.g., P23H P21 and SD P30). Scale bar, 10 μm.

Function of glutamate receptors in bipolar cells
Aberrant expression of glutamate receptors has been shown in a number of models of retinal dystrophy (Marc et al., Reference Marc, Jones, Anderson, Kinard, Marshak, Wilson, Wensel and Lucas2007), and data suggest similar changes in human retinal detachment (de Souza et al., Reference de Souza, Kalloniatis, Polkinghorne, McGhee and Acosta2012). In a mouse model (rd1) of RP, inner retinal neurons displayed aberrant functional remodeling as well as a number of other morphological changes (Strettoi & Pignatelli, Reference Strettoi and Pignatelli2000; Strettoi et al., Reference Strettoi, Porciatti, Falsini, Pignatelli and Rossi2002, Reference Strettoi, Pignatelli, Rossi, Porciatti and Falsini2003; Chua et al., Reference Chua, Fletcher and Kalloniatis2009). In contrast to wild type ON cone bipolar cells that express mGluR6 receptors, ON cone bipolar cells of the rd1 mouse display aberrant ionotropic glutamate receptor function at P15 during the rod photoreceptor degeneration phase (Chua et al., Reference Chua, Fletcher and Kalloniatis2009).
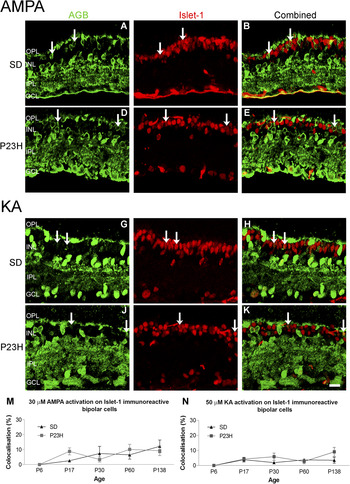
We investigated whether bipolar cells of P23H-3 rats also undergo similar functional alterations at various stages of photoreceptor loss. Activation of ionotropic glutamate receptors by AMPA/KA was examined by colocalizing AGB permeation with the rod and ON cone bipolar cell marker Islet-1. Fig. 4 shows micrographs of AGB and islet-1 labeling patterns at the age point of P30 and cell counts for P6–P138.
Confocal micrographs of AGB (green) and Islet-1 (red) staining in SD and P23H-3 retina at P30 secondary to 30 µM AMPA (A–F) or 50 µM KA (G–L) activation. Islet-1 is a cell marker for rod and ON cone bipolar cells that normally express mGluR 6 receptors and are not activated by AMPA or KA. The majority of the Islet-1 immunoreactive bipolar cells did not colocalize with AGB labeling, except a few indicated by arrows. The percentage of AGB colocalized Islet-1 immunoreactive bipolar cells over the total number of Islet-1 positive bipolar cells were measured at five age points and summarized in a graphical format (M and N). Scale bar, 20 μm.

Application of 30 μM AMPA resulted in strong labeling of AGB in horizontal cells, amacrine cells, and cells in the ganglion cell layer for both animals (Fig. 4A and 4D). Some bipolar cells were also AGB positive after AMPA activation which probably represent the OFF bipolar cell class. Typical islet-1 labeling was observed for both animals with strong staining of the rod bipolar cells and weak staining of the ON cone bipolar cells (Fig. 4B and 4E). As expected, few islet-1 labeled bipolar cells appeared to be AGB immunoreactive after AMPA activation in the SD retina (Fig. 4A–4C). In the P23H-3 retina, labeling of AGB and islet-1 remained identical to the SD retina (Fig. 4D–4F). The ratio of colocalization, expressed as the proportion of double-labeled bipolar cells compared to the total number of islet-1 positive bipolar cells, was not significantly different between SD and P23H-3 rats at all ages examined (two-way ANOVA, P = 0.1002) (Fig. 4M). Colocalization ratios for both animals corresponded to previous values in the rat and to basal values observed in the nonactivated mouse retinae (Sun & Kalloniatis, Reference Sun and Kalloniatis2006; Nivison-Smith et al., Reference Nivison-Smith, Sun, Fletcher, Marc and Kalloniatis2013). This small error may be partly due to AGB permeation through heterologous gap junctions between, for example, AII amacrine cells and ON cone bipolar cells (Mills & Massey, Reference Mills and Massey2000; Trexler et al., Reference Trexler, Li, Mills and Massey2001).
KA activation of islet-1 bipolar cells was very similar to the pattern obtained after AMPA activation (Fig. 4G–4L). Quantification analysis showed that the proportion of colocalization remained low as a function of age in both SD and P23H-3 rats (Fig. 4N). Moreover, no significant difference was observed between SD and P23H-3 rats (two-way ANOVA, P = 0.196). Therefore, ON bipolar cells in P23H-3 rats did not display aberrant function of ionotropic glutamate receptors from P6 to P138.
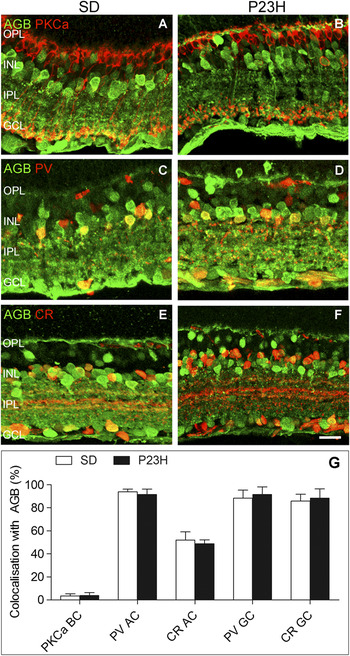
AGB permeation secondary to KA activation was also examined with the rod bipolar cell marker PKCα in SD and P23H-3 retinas as PKCα rod bipolar cells had fewer processes and smaller, more immature axonal arborization in the rd1 mouse (Strettoi et al., Reference Strettoi, Pignatelli, Rossi, Porciatti and Falsini2003; Chua et al., Reference Chua, Fletcher and Kalloniatis2009). Fig. 5A and 5B shows representative micrographs at P30. In SD rats, the apical bushy morphology of dendrites, the thin process, and the axonal ending of the rod bipolar cell were well developed (Fig. 5A). In P23H-3 rats (Fig. 5B), dendrites appeared shorter, spatially clustered, and poorly orientated compared to the normal retina. Very few of the PKCα immunoreactive cells were activated by KA (colocalization ratio of 3–5%) and there was no significant difference between the two strains (Fig. 5G).
Confocal micrographs of AGB (green) and cell markers (red) including PKCα (A, B), PV (C, D) and CR (E, F) were present in SD and P23H-3 rats at P30, after 50 µM KA activation. The ratio (%) of AGB colocalization with cell marker specific bipolar, amacrine, and ganglion cells were assessed and showed no difference between SD and P23H-3 rats (G). Scale bar, 20 μm.

Glutamate receptor function in amacrine and ganglion cells
We further investigated glutamate receptor function of amacrine and ganglion cells using the cell markers PV and CR in combination with AGB entry following KA activation. Fig. 5 shows micrographs of immunolabeling at P30 where these cell markers became adult like. Almost all the PV immunoreactive AII amacrine cells were colocalized with AGB, possibly due to the nonspecific activation of AMPA receptors on these cells by a high concentration of KA (Nivison-Smith et al., Reference Nivison-Smith, Sun, Fletcher, Marc and Kalloniatis2013; Fig. 5C, 5D, and 5G). Approximately 50% of the CR immunoreactive amacrine cells were colocalized with ligand-activated AGB labeling (Fig. 5E–5G).
Nearly 90% of PV or CR labeled ganglion cells were colocalized with AGB indicating that they harbor glutamate receptors responsive to AMPA or KA in both rat strains (Fig. 5C–5G). For all the cell classes and all age groups examined, the P23H-3 retina appeared to be identical to that in the SD rat retina (data not shown). Despite photoreceptor apoptosis, altered channel permeation of photoreceptors and gliosis of Müller cells, no change to KA or AMPA activation occurred in the inner retina of P23H-3 rat retina by P138.
Discussion
Using AGB as a marker of cation channel activity, we established increased photoreceptor labeling in the P23H-3 retina at P12, prior to the onset of substantial photoreceptor apoptosis and Müller cell gliosis. Glutamate receptor activity in the inner retinal neurons of the P23H-3 rat (up to P138) was investigated by ligand-activated AGB entry and was indistinguishable to control retina. These results suggest that like other animal models of retinal degeneration, the P23H-3 rat retina does not display aberrant functional remodeling during the active rod photoreceptor death phase of retinal dystrophy.
AGB permeation as early indicator of photoreceptor dysfunction
Basal AGB labeling is useful in tracking the functional activation of glutamate receptors during normal development as well as to indicate impending photoreceptor degeneration (Marc, 1999a,Reference Marcb; Kalloniatis et al., Reference Kalloniatis, Tomisich, Wellard and Foster2002; Acosta et al., Reference Acosta, Fletcher, Azizoglu, Foster, Farber and Kalloniatis2005; Marc et al., Reference Marc, Kalloniatis and Jones2005). AGB tracking provides the cation entry history of the cell and not the summed excitatory/inhibitory history of the cell (Marc et al., Reference Marc, Kalloniatis and Jones2005). Although AGB entry has been modulated through ionotropic and metabotropic cation channels in inner retinal neurons (Marc, 1999a,Reference Marcb, Reference Marc, Kalloniatis and Jones2005; Kalloniatis et al., Reference Kalloniatis, Tomisich, Wellard and Foster2002, Reference Kalloniatis, Sun, Foster, Haverkamp and Wässle2004; Marc et al., Reference Marc, Kalloniatis and Jones2005; Sun & Kalloniatis, Reference Sun and Kalloniatis2006; Nivison-Smith et al., 2013), the nature of the channel through which AGB enters photoreceptors remains cryptic (Marc, 1999b).
AGB labeling was first observed in the inner and outer plexiform layer in both normal and degenerating rat retina at P10. AGB labeled bipolar cells, presumably the OFF bipolar cells, were observed at P17 in the outer part of the inner nuclear layer and their labeling pattern appeared similar in both SD and P23H-3. The studies on mouse retina supported that the activation of different cell classes initiated at an early age from P0 to P7 (Zhang et al., Reference Zhang, Hammassaki-Britto, Britto and Duvoisin1996; Sun & Kalloniatis, Reference Sun and Kalloniatis2006; Acosta et al., Reference Acosta, Chua and Kalloniatis2007). At P125, the retina presented comparable activation of ionotropic glutamate receptors in SD and P23H-3 rats with AGB labeling of horizontal cells, bipolar cells, amacrine cells, and ganglion cell layer, indicating normal maturation of functional KA and AMPA receptors on second- and third-order neurons in P23H-3 rat retina.
Significantly elevated AGB labeling of photoreceptors in the P23H-3 rat retina was observed from P12, in parallel with the appearance of TUNEL labeled cells in the outer nuclear layer at approximately P10, with the large departure from control rats occurring at ∼P15 (Fig. 2A in Yu et al., Reference Yu, Cringle, Valter, Walsh, Lee and Stone2004). Unlike the TUNEL profiles which peaked at P25 and declined thereafter (Reference Yu, Cringle, Valter, Walsh, Lee and StoneYu et al., 2004), the number of AGB labeled photoreceptors continued to increase as a function of degeneration. Moreover, AGB positive photoreceptors increased dramatically to outnumber apoptotic cells from P17. Thus, altered cation permeability in the photoreceptors indicated by elevated AGB labeling can be used as an early sign of photoreceptor dysfunction in the P23H rat retina. AGB has been described as a useful marker for photoreceptors destined to degenerate before apoptotic markers in the RCS rat retina (Kalloniatis et al., Reference Kalloniatis, Tomisich, Wellard and Foster2002) and the rd1 mouse retina (Acosta et al., Reference Acosta, Fletcher, Azizoglu, Foster, Farber and Kalloniatis2005). In a light damage study of P23H rats, light exposure of 2 h was sufficient to cause increased cation entry in susceptible photoreceptors (Yu et al., Reference Yu, Acosta, Ready, Cheong and Kalloniatis2007). Interestingly, the number of photoreceptors labeled with both TUNEL and AGB was limited, indicating that the two labeling systems largely identify different populations of photoreceptor cells. The increase of AGB gating and TUNEL labeling may be concomitant events in the degeneration process of P23H-3 rats.
Lack of functional remodeling of glutamate receptors in the inner retina of P23H-3 by P138
The cation entry history of the cell reflecting glutamate receptor function is provided by ligand-activated (e.g., KA, AMPA: Marc, 1999a,Reference Marcb, Reference Marc, Kalloniatis and Jones2005; Sun & Kalloniatis, Reference Sun and Kalloniatis2006) or ligand-modified (e.g., L-AP4) AGB entry (Kalloniatis et al., Reference Kalloniatis, Sun, Foster, Haverkamp and Wässle2004). Both ionotropic and metabotropic receptor function is lost in advanced staged of retinal dystrophy when all photoreceptors have degenerated (Marc et al., Reference Marc, Jones, Anderson, Kinard, Marshak, Wilson, Wensel and Lucas2007). When some photoreceptors are present, aberrant functional glutamate receptors on bipolar cells was first shown due to the high number of bipolar cells that demonstrate ionotropic glutamate receptor activation in a human retina of a RP sufferer (Marc et al., Reference Marc, Jones, Anderson, Kinard, Marshak, Wilson, Wensel and Lucas2007). In the rd1 model, ON cone bipolar cells abnormally express functional ionotropic glutamate receptors from P15 (rod degeneration phase) to P40 (cone degeneration phase; Chua et al., Reference Chua, Fletcher and Kalloniatis2009). The P23H line 1 rat has no rod scotopic a-wave at P38 with a concurrent anatomical and neurochemical remodeling (Cuenca et al., Reference Cuenca, Pinilla, Sauve, Lu, Wang and Lund2004). The metabotropic glutamate receptor 6 or mGluR6 is dramatically reduced as early as P21, particularly on the tips of rod bipolar cells of the P23H-1 retina (Cuenca et al., Reference Cuenca, Pinilla, Sauve, Lu, Wang and Lund2004). Ectopic synapses also appear to aggregate with rod bipolar cell processes at surviving cone photoreceptor terminals (Cuenca et al., Reference Cuenca, Pinilla, Sauve, Lu, Wang and Lund2004).
During the process of degeneration, the retina undergoes three phases of neurochemical remodeling with cellular stress in retinal pigmented epithelium and photoreceptors marking the beginning of phase 1 (Jones et al., Reference Jones, Watt, Frederick, Baehr, Chen, Levine, Milam, Lavail and Marc2003; Marc et al., Reference Marc, Jones, Watt and Strettoi2003). The porcine model of P23H also displays glial stress shown by alterations in Müller cell taurine and glutamine levels (Jones et al., Reference Jones, Kondo, Terasaki, Lin, McCall and Marc2012). In the P23H-3 rat, signs of retinal stress were evident at P30 as increased GFAP immunoreactivity. Phase 2 is characterized by the debris removal by microglia and trophic effects that ultimately leads to complete loss of photoreceptors. Phase 3 involves a prolonged stage of global remodeling of the remnant neural retina, including neuronal and glial migration, elaboration of new neurites, and synapses and rewiring of retinal circuits (Jones et al., Reference Jones, Watt, Frederick, Baehr, Chen, Levine, Milam, Lavail and Marc2003; Marc et al., Reference Marc, Jones, Watt and Strettoi2003; Jones & Marc, Reference Jones and Marc2005).
Despite the extensive rod photoreceptor degeneration in the P23H-3 rat retina by P138 when >40% of rod photoreceptors were lost (Machida et al., Reference Machida, Kondo, Jamison, Khan, Kononen, Sugawara, Bush and Sieving2000; Yu et al., Reference Yu, Cringle, Valter, Walsh, Lee and Stone2004), we were unable to identify aberrant functional glutamate receptors in either the rod or the cone ON bipolar cells using AGB permeation. Other changes to inner retinal neuron glutamate receptors such as subcellular distribution, receptor kinetics, or receptor subunit composition could be occurring but were undetectable using this method. Alternatively, functional remodeling may occur ages later than used in this study. At P138, the P23H-3 retina is still undergoing rod degeneration characteristic of phase 1 of the degeneration process (Marc et al., Reference Marc, Jones, Watt and Strettoi2003). Functional remodeling of bipolar glutamate receptors is likely to occur at later stages of phase 1 or phase 2. The original observation in human retina with RP was analyzed in a region where 90–100% of rods were lost (Marc et al., Reference Marc, Jones, Anderson, Kinard, Marshak, Wilson, Wensel and Lucas2007), and the rd1 retina not only displays a rapid loss of rod photoreceptors between ∼P10 and P21, but the rod photoreceptor synaptology and function has not fully developed (Farber et al., Reference Farber, Flannery and Bowes-Rickman1994; Chua et al., Reference Chua, Fletcher and Kalloniatis2009; Gibson et al., Reference Gibson, Fletcher, Vingrys, Zhu, Vessey and Kalloniatis2012).
In the rapid photoreceptor degenerating line 1 P23H rat retina (Cuenca et al., Reference Cuenca, Pinilla, Sauve, Lu, Wang and Lund2004), there were anatomical changes in inner retinal neurons by P40 (AII amacrine cells). The third order neurons in the P23H-3 retina, including amacrine and ganglion cells did not display functional change (up to P138). In accordance with the current study, different types of amacrine cells were not affected in a fast-degenerating rd1 model (Strettoi et al., Reference Strettoi, Porciatti, Falsini, Pignatelli and Rossi2002, Reference Strettoi, Pignatelli, Rossi, Porciatti and Falsini2003), although inner retinal responses in this mouse model were altered secondary to N-methyl-d-aspartate activation (Chua et al., Reference Chua, Fletcher and Kalloniatis2009).
In conclusion, we have shown that AGB probing identifies photoreceptors destined to degenerate early in the disease process. Furthermore, no functional changes were apparent for glutamate receptors in the inner retina of the P23H-3 rat retina up to P138 based on AGB permeation. In many animal models examined, extensive rewiring or reprogramming occurs in cells of the inner retina (Jones et al., Reference Jones, Watt, Frederick, Baehr, Chen, Levine, Milam, Lavail and Marc2003; Marc et al., Reference Marc, Jones, Watt and Strettoi2003, Reference Marc, Jones, Anderson, Kinard, Marshak, Wilson, Wensel and Lucas2007), which has implications for successful interventions such as gene therapy or stem cells treatment. In the P23H-3 rat model of retinal dystrophy, the lack of remodeling (as assessed through AGB permeation) in downstream neurons over a long period compared to other RP animal models suggest a time window for possible intervention of therapeutic strategies.
Conflict of interest
The authors report no conflict of interest. The authors alone are responsible for the content and writing of the paper.
Acknowledgments
This work was supported in part by research grants from the National Health and Medical Research Council, Australia (1009342 and 1021042), the Health Research Council of New Zealand (05/247), Retina Australia and the Robert G. Leitl Trust (Professorship held by M.K.). We would like to thank Dr. Robert Marc, University of Utah, for providing the agmatine antibodies. The rats were produced by Xenogen Biosciences (formerly Chrysalis DNX Transgenic Sciences, Princeton, NJ) and developed and supplied with the support of the National Eye Institute by Professor Matthew LaVail (Beckman Vision Center, School of Medicine, University of California, San Francisco, CA). We thank Professor Jonathan Stone and Dr. Krisztina Valter-Kocsi for providing the P23H-3 breeders.