
I. INTRODUCTION
The solid–liquid interfacial free energy γSL is of interest to many researchers due to its importance in crystal nucleation and growth. Reference Turnbull and Fisher1–Reference Herlach, Gao, Holland-Moritz and Volkmann7 Unfortunately, direct measurement of γSL is still challenging. In the early time, Turnbull Reference Turnbull2,Reference Turnbull and Cech3 extracted the γSL for various materials from the homogenous nucleation rates at maximum undercooling temperature. The values measured by Turnbull have been used for many years as standard solid–liquid interfacial energy. However, this approach is not straightforward to measure γSL at high temperature (near melting point). Gündüz and Hunt Reference Gündüz and Hunt8 proposed another approach, grain-boundary groove experiments, by examining the shape of the interface that intersects with a grain boundary to extract γSL, directly. Such experiment requires transparent samples, as a result, only a few materials have been studied using this approach.
Compared with experiments, computer simulations have become the method of choice in determining γSL. Broughton and Gilmer Reference Broughton and Gilmer9 used the cleaving technique to calculate γSL by integrating the reversible work when two isolated slabs of solid and liquid are joined together to form a flat solid–liquid interface. Although this approach has enabled the direct estimation of the solid–liquid free energy, many trials are needed to deal with the stable interface. The capillary fluctuation method, another approach developed by Hoyt, Asta, and Karma, Reference Hoyt, Asta and Karma10 extracts γSL by examining the magnitude of capillary fluctuation of the interface profile. However, the applying of this approach is based on the fact that the solid–liquid interfaces are rough, rather than faceted or hybrid (like silicon). Apart from these two methods above, Bai and Li Reference Bai and Li11 proposed a new approach, the critical nucleus method (CNM), which has succeeded in determining γSL for several systems. Reference Zhou, Lin, Wang and Huang12–Reference Hashimoto, Shibuta and Suzuki14 In this approach, spherical nuclei of different radii were equilibrated with liquid phase at their corresponding critical undercooling, and γSL was obtained based on classical nucleation theory (CNT). Reference Porter and Easterling15 CNM can be performed at a wide range of temperatures with curved solid–liquid interface. However, in previous researches, the dependence of the interfacial free energy on the curvature of interface was neglected; in fact, the former will decrease as the latter increases. In this paper, silicon was used as a test example, whose interfacial free energy was calculated by CNM. At the same time, the influence of curvature on γSL was considered and more accurate results were calculated.
The paper is organized as follows. In Sec. II we briefly outline the CNM and the simulations carried out in our work. In Sec. III, results and discussion are presented. Conclusions are shown in Sec. IV based upon our results.
II. METHOD
A. Theory
The interfacial energy, according to the CNT, Reference Porter and Easterling15 can be obtained from the change of the Gibbs free energy as follows, where a small solid sphere of radius r in an undercooled liquid is studied:
 $$\Delta G = - {4 \over 3}\pi {r^3}\Delta {G_{\rm{V}}} + 4\pi {r^2}{\gamma _{{\rm{SL}}}}\quad ,$$
where ΔG V is the Gibbs free energy difference per unit volume between solid and liquid phases, expressed as follows:
 $$\Delta {G_{\rm{V}}} \cong {L_{\rm{V}}}{{\Delta T} \over {{T_{\rm{M}}}}}\quad ,$$
where L V is the latent heat of fusion per unit volume at the melting point T M, and ΔT(=T M − T) is the undercooling. However, in Eq. (1), the dependence of γSL on r is neglected; in fact the former will decrease as the latter decreases. Tolman Reference Tolman16 provided a relationship as follows:
 $${\gamma _{{\rm{SL}}}} = {{{\gamma _0}} \over {1 + 2\delta /r}}\quad ,$$
where γ0 is the interfacial free energy for a flat interface (r = ∞); δ is the Tolman length,
Reference Haye and Bruin17
treated as a constant of the order of atomic diameter.
Reference Kashchiev18,Reference Bai and Li19
Therefore, the relation of critical radius
 ${r^ * }$
and the corresponding temperature T can be obtained when maximizing ΔG by combining Eqs. (1), (2), and (3), and we can get the following:
 $$T = {T_{\rm{M}}} - 2{\gamma _0} \cdot {{{T_{\rm{M}}}} \over {{L_{\rm{V}}}}} \cdot \left( {{1 \over {{r^*}}} - {\delta \over {{r^*}^2}}} \right)\quad .$$
Considering a cylindrical nucleus (infinite long on two ends), γSL is expressed as follows:
 $${\gamma _{{\rm{SL}}}} = {{{\gamma _0}} \over {1 + \delta /r}}\quad .$$
On the other hand, the difference in the Gibbs free energy and critical nuclei radius are substituted as follows:
 $$\Delta G = - \pi {r^2}\Delta {G_{\rm{V}}} + {{2\pi r{\gamma _0}} \over {1 + \delta /r}}\quad ,$$
 $$T = {T_{\rm{M}}} - {\gamma _0} \cdot {{{T_{\rm{M}}}} \over {{L_{\rm{V}}}}} \cdot \left( {{1 \over {{r^*}}} - {1 \over {{r^*}}}{{\left( {{\delta \over {{r^*} + \delta }}} \right)}^2}} \right)\quad .$$
Therefore, for a given temperature, there exists a critical radius
 ${r^ * }$
. When nucleus' radius
 $r > {r^ * }$
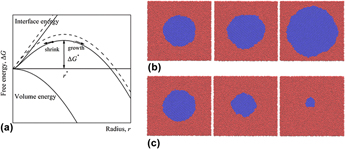
, the nucleus grows to lower the free energy of the system [see Fig. 1(b)]; if
 $r \;\lt\; {r^ * }$
, it shrinks to lower the free energy [see Fig. 1(c)]; if
 $r = {r^ * }$
, the nucleus can be in equilibrium (but metastable) with its surrounding liquid. These cases are shown in Fig. 1(a) where the Gibbs free energy is scratched as a function of the radius of the cylindrical nucleus. And γ0 can be extracted through Eq. (7) from a series of
 ${r^ * }$
and their corresponding equilibrium temperatures T obtained in simulations.
(a) Schematic image of the Gibbs free energy as a function of the radius of the cylindrical nucleus. The solid lines represent interface energy and free energy considering the dependence of γSL on r, while the dashed lines do not. (b) Snapshots of the growth of nucleus when
 $r > {r^ * }$
; (c) Snapshots of shrinkage of nucleus when
 $r \;\lt\; {r^ * }$
.

B. Methods
In this work, we use silicon as test samples and the Stillinger–Weber (SW) potential, Reference Stillinger and Weber20 a kind of three-body potential, was used. According to Eq. (7), before calculating γSL, the melting point T M and the latent heat of fusion L V must be determined. In our simulation, they were given as 1678 K and 2544.47 mJ/mm3, respectively, details can be found in Appendix.
The most important task of our simulation is to get the relation between
 ${r^ * }$
and their corresponding equilibrium temperature T. Simulations were carried out with LAMMPS, a MD simulation software exploited by Sandia National Laboratories, under isothermal–isobaric (NPT) ensembles, where the pressure was set as zero. The time step of the simulation was set to 1 fs. The sizes of simulation boxes are shown in Table I. The first column shows the x, y, z crystallographic directions, and z direction represents the centerlines of nuclei, and periodic boundaries were used in three directions. Three kinds of cylindrical nuclei with centerlines along [100], [110], and [111] directions were simulated, the radius of which ranged from 10 to 100 Å. All nuclei were in equilibrium with the liquid phase. To avoid the interaction between interfaces from different nuclei, the sizes of the boxes must be large enough comparing to the radii of nuclei. After relaxing the box at a temperature T for 100 ps, the atoms within a radius,
 ${r^ * }$
, were fixed while the others were melted by heat them up to 2400 K in 500 ps. The melted part of the box was equilibrated for 300 ps and cooled down to T in 100 ps. Then the whole box was relaxed for 1000 ps and the movement of the solid–liquid interface was monitored. System's temperature is controlled in the following way: if the interface moved toward the liquid side, the nuclei grew, we then slightly increased the temperature, vice versa. After a series of trial-and-error attempts, the interface became stationary at a certain temperature, the corresponding
 ${r^ * }$
and T was obtained.
The simulated system sizes of different nuclei. The third direction in the first column is the centerline of the nuclei.

To estimate the growth and shrinkage of a nucleus, distinguishing solid phase and liquid phase is critical, which was realized using a local structural order parameter, proposed by Morris. Reference Morris21 Firstly, the local order parameter for each atom was calculated via the following:
 $${\psi _i} = {\left| {{1 \over {{N_q}Z}}\sum\limits_{r,q} {\exp (i \bi {q \cdot r)}} } \right|^2}\quad,$$
where N q is the number of reciprocal vectors of perfect diamond lattice. In our simulations, 6 reciprocal vectors along (110) direction were selected. Z = 16, denotes the first and second nearest neighbors of each atom i, and r = r j − r i . The order parameter is 1 for the perfect crystal and 0 for liquid. To reduce the effects of molecular vibrations caused by thermal fluctuations and to improve the discrimination between the crystal and melt phases, an averaged order parameter for each atom is used as follows:
 $$\bar \psi = {1 \over {Z + 1}}\left( {{\psi _i} + \sum\limits_j {{\psi _j}} } \right)\quad ,$$
where j runs over all nearest neighbors (Z). Figure 2 shows the order parameter along radius in an instantaneous configuration of nucleus
 ${r^ * } = 60\,{\rm{{\AA}}}$
. As seen in Fig. 2, most atoms in the solid region have order parameters larger than 0.1 and less than 0.1 in the liquid region. Therefore, atoms with order parameters larger than 0.1 were defined as solid atoms. The increase and decrease in number of solid atoms was used to determine the growth and shrinkage of nuclei, respectively.
The order parameter as a function of position along radius in an instantaneous configuration of nucleus
 ${r^ * } = 60\,{\rm{{\AA}}}$
. The centerline of nuclei along [100] direction.

III. RESULTS AND DISCUSSION
A. Interfacial free energy from relation between
 ${r^ * }$
and T

The relation between the critical nuclei radii
 ${r^ * }$
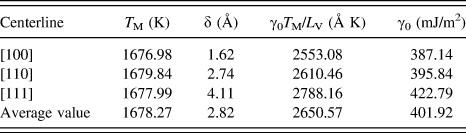
and the corresponding temperatures T is presented in Fig. 3. The blank points are the data from simulations for three kinds of nuclei; the red lines are the fittings based on Eq. (7). Table II provides parameters fitted by Eq. (7), the deviation of melting points for three kinds of nuclei is no more than 3 K. The average of them, 1678.27 K, is very close to the melting point determined in Appendix A, 1678 K, as well as the results reported by Buta et al.,
Reference Buta, Asta and Hoyt22
1677 K, and Tang et al.,
Reference Tang, Wang and Zeng23
1678 K. The Tolman length of the nuclei with centrelines along [111] direction is slightly larger than atomic diameter 2.35 Å, while results from two nuclei of other directions are less than atomic diameter. Averaging Tolman length from three kinds of nuclei, we get 2.82 Å. The averaged interfacial free energy is provided as 401.92 mJ/m2, by using the fitting values of γ0
T
M/L
V (the fourth column), and is shown in the fifth column. Our results are close to reported experimental results γ0 ∼ 340–450 mJ/m2 (obtained based on CNT
Reference Stiffler, Thompson and Peercy24–Reference Shao and Spaepen26
). Among three different kinds of nuclei, the one with centerlines along [111] direction gives the largest γ0 as 422.79 mJ/m2, about 35 mJ/m2 larger than that along [100] direction. This deviation between three kinds of nuclei reflects larger anisotropy of interfacial free energy. Although the anisotropy of γSL cannot be calculated by CNM, this conclusion was verified by the work from Apte and Zeng,
Reference Apte and Zeng27
who calculated γSL of silicon using cleaving wall method for SW potential and provided results of three facets of (100), (110), and (111) as 420 mJ/m2, 350 mJ/m2, and 340 mJ/m2.
Temperature dependence of the estimated critical radius
 ${r^ * }$
for cylindrical nuclei in the undercooled liquid. The hollow points come from simulations; the red lines are fittings of Eq. (7).

The parameters fitted from simulated data according to Eq. (7). The latent heat L V is 2544.47 mJ/mm3.

In traditional CNT, the influence of interfacial curvature on its free energy [see Eq. (5)] was not considered and Eq. (7) is approximated as follows:
 $$\Delta T = {\gamma _0} \cdot {{{T_{\rm{M}}}} \over {{L_{\rm{V}}}}} \cdot {1 \over {{r^*}}}\quad .$$
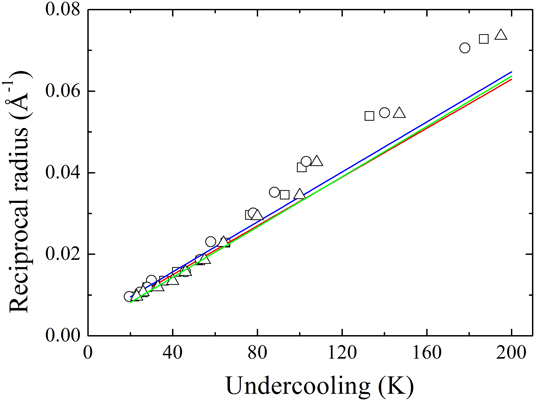
Figure 4 shows the relation between reciprocal radius
 $1/{r^ * }$
and undercooling ΔT. For three kinds of nuclei, the simulation data follow Eq. (10) at large
 ${r^ * }$
, while deviate at small
 ${r^ * }$
. This is because the effect of Tolman length δ could be neglected if
 ${r^ * }$
is large enough as explicit in Eq. (7). However, it is essential for small
 ${r^ * }$
, for the deviation will increase as the decrease of
 ${r^ * }$
. On the contrary, the relation between
 ${r^ * }$
and T is well described by Eq. (7), shown in Fig. 3.
Relation between reciprocal radius and undercooling. Open squares (□) represent nuclei of critical along [100] direction, open circles (○) means nuclei along [110], and open triangle (△) corresponds to nuclei along [111]. The red, blue, and green lines represent the theoretic values according to according to traditional CNT [Eq. (10)] for three kinds of nuclei, respectively.

B. Interfaces interactions effect
Equation (7) provides the relation between the critical nucleus radius
 ${r^ * }$
and its corresponding temperature T, theoretically. To check the system size's influence on this relation, we performed simulations different sized systems for the same
 ${r^ * }$
. As shown in Fig. 5, three nuclei with centerline z direction along [100] crystal orientation were equilibrated with liquid in boxes whose size in x, y directions changed from 50 Å to 400 Å. For the same
 ${r^ * }$
, the corresponding T decreased by about 20 K as we increased the size of systems. However, if the size of systems is larger enough, T obtained in simulations hardly change. In this paper, therefore, T was determined from 380.15 Å systems (see Table I).
The effect of system sizes on equilibrium temperature. The centerline of nuclei along [100] direction, and the critical nucleus radius are ■
 ${r^ * } = 30\,{\rm{{\AA}}}$
, ●
 ${r^ * } = 60\,{\rm{{\AA}}}$
, and ▲
 ${r^ * } = 100\,{\rm{{\AA}}}$
. For the same critical nucleus radius, the corresponding equilibrium temperature decreases as the system size increases.

It must be pointed out that the interaction between different nuclei will influence the determined corresponding temperature T
M, and the reason of this phenomenon is explained by the attraction between interfaces (see Appendix A). In small simulation systems, the nuclei are close to each other due to the periodic boundary. Because of the attraction, the nuclei are easier to grow compared to nuclei in larger systems. Therefore, higher temperature is needed to prevent the growth of nuclei. Two extreme cases are considered in the following to prove our viewpoint. Two simulations were carried out in the systems with the same size and same radius of nuclei, but where there were one and nine nuclei in two systems, respectively. Figure 6 shows two simulations with nuclei
 ${r^ * } = 30\,{\rm{{\AA}}}$
, the size in x, y directions were 130.34 Å. Both of the simulations were carried out at 1615 K. If the system just included one nucleus, the nucleus melts as the extension of time [Fig. 6(a)]. However, if nine nuclei were introduced and equilibrated with liquid phase in the same time, the nuclei grew [Fig. 6(b)]. In the systems with the same size, the more nuclei mean the less distance between them and the stronger attraction among them. Because of the attraction, the nuclei tend to approach to each other, in other words, the nuclei grow. As the distances between nuclei become larger enough, the attraction can be ignored and the determined T is considered accurate. More details involve the attraction between interfaces are provided in Appendix A: the determination of melting point.
Snapshots of nuclei with
 ${r^ * } = 30\,{\rm{{\AA}}}$
that shrank or grew at the same temperature T = 1615 K. The size in x, y directions is 130.34 Å in these two simulations and the centerline of nuclei along [100] direction. (a) The nucleus shank when just one nucleus was inserted into liquid phase; (b) the nuclei grew when nine nuclei were inserted into liquid phase, simultaneously.

IV. CONCLUSIONS
In summary, we studied the solid–liquid interfacial free energy of Si by CNM. First, a series of cylindrical nuclei were used to equilibrate the liquid phase at corresponding temperatures (undercooled). Based on the relation of radii and temperature range from 1480 to 1680 K, we obtained the melting point, Tolman length, and orientationally averaged interfacial free energy of 1678.24 K, 2.82 Å, and 401.92 mJ/m2, respectively. Because in the existed simulations, the influence of the interfacial curvature on interfacial free energy was neglected; our work provides supplement on the respect.
ACKNOWLEDGMENTS
We would like to acknowledge the financial support for this work provided by the National Natural Science Foundation of China (51301094), the National Magnetic Confinement Fusion Science programme of China under Grant (51471092) and China Nuclear Power Engineering Co., Ltd. (2013966003). The work was carried out at the National Supercomputer Center in Tianjin, and the calculations were performed on TianHe-1(A) and were also supported by Tsinghua National Laboratory for Information Science and Technology. The authors also thank Prof. M. Li (Georgia Institute of Technology) and Mr. J.X. Ding (Tsinghua University) for fruitful discussions.
APPENDIX
A. The determination of melting point
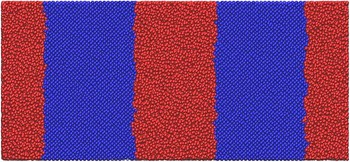
The equilibrium melting point T M is a crucial reference point for determining the interfacial free energy γ SL. In our work, we obtained T M from solid–liquid coexistence simulations. Reference Morris, Wang, Ho and Chan28,Reference Morris and Song29 As shown in Fig. 7, a box filled with silicon atoms (in orientation of [100] × [010] × [001]) was designed to form a sandwich structure. The cross-section size of box was 106.82 × 106.82 Å; the size of two blue sections in x direction was 54.307 Å, while the size of red section was changeable; to keep the symmetry of the system, the size of red section in the middle is twice as larger as two sides and periodical boundaries were used in three directions. The atoms in red region were heated to 2400 K to obtain liquid phase while atoms in blue section were kept fixed. Then the liquid was subsequently quenched to an estimated melting temperature and relaxed the whole system by 1000 ps. Equilibrium temperature T was obtained when the solid–liquid interfaces became stable.
Sandwich structure for determining the melting temperature. Atoms in red section were used to obtain liquid phase, while atoms in blue remained solid phase.

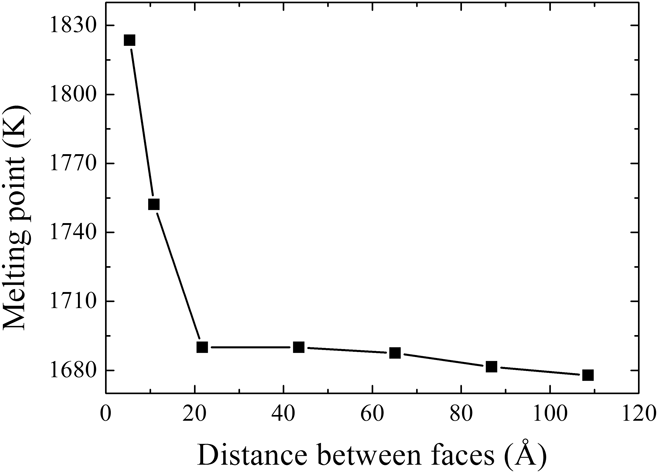
Figure 8 shows the relation between equilibrium temperature and the distance of two solid–liquid interfaces. If the distance between interfaces increased, the equilibrium temperature decreased. We attribute the reason of this phenomenon to the interaction between two interfaces. In fact, Broughton and Gilmer Reference Broughton and Gilmer30 noticed similar phenomenon in the research of grain boundaries premelting. In their work, the interaction between two interfaces was expressed as follows:
 $$E(\lambda ) = ({\gamma _{{\rm{GB}}}} - 2{\gamma _{{\rm{SL}}}})g(\lambda )\quad ,$$
where λ is the distance between two interfaces and γGB is the grain boundaries energy which arises when λ = 0. The term g(λ) accounts for the transition from crystalline order at small λ, where g(0) = 1, to liquid at larger λ, with g(∞) = 0. Hoyt et al. Reference Hoyt, Olmsted, Jindal, Asta and Karma31 have studied the form of g(λ), and gave an exponential expression. Broughton and Gilmer studied the situation that
 $${\gamma _{{\rm{GB}}}} - 2{\gamma _{{\rm{SL}}}} > 0\quad ,$$
the interaction E(λ) is positive, and two interfaces are repulsive Reference Kikuchi and Cahn32 to keep the liquid layer from collapsing below the melting point. However, in our case, the grain boundaries energy γGB = 0, because of the same crystalline orientation on both sides of liquid phase, there is the following:
 $${\gamma _{{\rm{GB}}}} - 2{\gamma _{{\rm{SL}}}} = - 2{\gamma _{{\rm{SL}}}} \lt\; 0\quad .$$
Therefore, the interaction E(λ) is negative, and two interfaces attract in our simulations. To keep the liquid phase from solidification, the temperature must be higher than actual melting point. When λ is larger enough, this attraction can be neglected, and the equilibrium temperature T can be used as approximated the melting point T M. As shown in Fig. 8, when the distance λ was larger than 20 Å, the equilibrium temperature became stable, and a value of 1678 K was obtained at λ = 109 Å.
Dependence of equilibrium temperature on the distance between two solid–liquid interfaces. As the distance increased, the equilibrium temperature decreased.

B. The latent heat of fusion
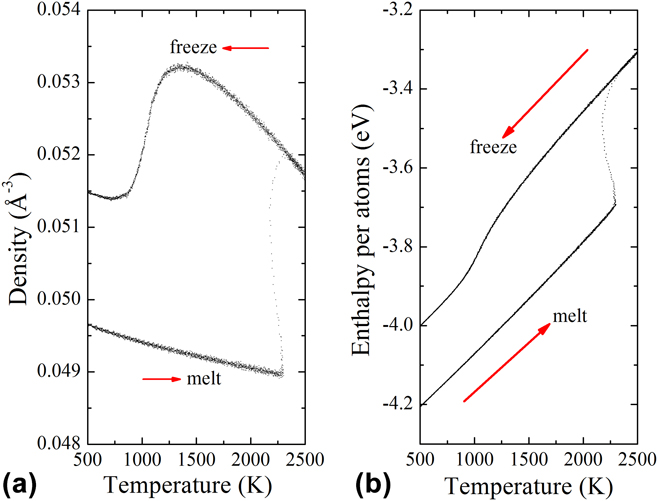
Before determining the latent heat of fusion L V, some bulk properties of solid and liquid phases must be obtained. Firstly, we heated a single-phase solid sample that consists 8000 atoms from 500 to 2500 K in 1000 ps. Simulations were carried out by NPT, the pressure was set as zero and periodic boundary conditions are applied. The sample became liquid at the upper superheating temperature about 2250 K. In this process, the density and enthalpy per atom of solid phase were measured and fitted by third order polynomial, provided:
 $${\rho _{\rm{S}}}(T) = \;0.04998 - 7.678 \times {10^{ - 7}}T + 2.36511 \times {10^{ - 10}}{T^2} - 4.26653 \times {10^{ - 14}}{T^3}\,({{\rm{{\AA}}}^{ - 3}})\quad ,$$
 $${H_{\rm{S}}}(T) = \;- 4.3377 + 2.61343 \times {10^{ - 4}}T + 2.17603 \times {10^{ - 9}}{T^2} + 2.2285 \times {10^{ - 12}}{T^3}({\rm{eV}})\quad .$$
Then, the system was cooled back to 500 K in another 1000 ps, the density and enthalpy per atom of liquid phase were measured and fitted by the following:
 $${\rho _{\rm{L}}}(T) = 0.05123 + 4.06181 \times {10^{ - 6}}T - 2.31245 \times {10^{ - 9}}{T^2} + 3.0682 \times {10^{ - 13}}{T^3}\,({{\rm{{\AA}}}^{ - 3}})\quad ,$$
 $${H_{\rm{L}}}(T) = - 4.26721 + 5.5461 \times {10^{ - 4}}T - 1.01167 \times {10^{ - 7}}{T^2} + 1.3192 \times {10^{ - 11}}{T^3}\,({\rm{eV}})\quad .$$
Figure 9 shows the hysteretic loops of the heating and cooling processes of bulk system, from which the latent heat of fusion was calculated by the following:
 $${L_{\rm{V}}} = \left[ {{H_{\rm{L}}}(T) - {H_{\rm{S}}}(T)} \right] \times {\rho _{\rm{S}}}(T)\left| {_{T = {T_{\rm{M}}}}} \right.\quad .$$
The melting point T M = 1678 K was substituted into Eq. (18) and obtained L V = 2544.47 mJ/m2.