1 Introduction
For online communications, the anonymity granted by the Internet allows for authors to hide behind aliases, making direct attribution difficult. To overcome this problem, evidence accumulation is required, often based on grouping documents by the same author to combine small amounts of information to form a profile. These profiles can then be used to target cyber criminals, such as those perpetrating identity theft or phishing online (Layton, Watters and Dazeley Reference Layton, Watters and Dazeley2011a). Unsupervised Authorship Analysis (UAA) is the task of clustering documents by authorship, allowing for the profiling of authors based only on their writing (Layton et al. Reference Layton, Watters and Dazeley2011a).
One method for performing UAA is to develop a distance calculation method, called the authorship distance method, such that documents sharing an author have a low distance, and documents with different authors have a high distance. This distance method is then used in a clustering algorithm, which clusters together instances with low distances (Layton et al. Reference Layton, Watters and Dazeley2011a). As clustering algorithms will generally find clusters regardless of the given input, the clustering algorithm needs to be strongly influenced to return clusters correlated to the stated goal. The clusters resulting from UAA will have a high correlation to true authorship if the distance method is accurate.
The ability to cluster documents by authorship is important for many tasks, and has been used in the literature for the investigation of cyber crime (Layton et al. Reference Layton, Watters and Dazeley2011a). In this instance, an investigator wishes to know details about the groups behind different attacks, without the prior knowledge of which group performed which attack. Clustering documents by authorship can lead to more focused investigations and profiling of attacks, which would otherwise be difficult if all attacks needed to be examined at once. This type of methodology has been used successfully in clustering phishing webpages by authorship (Layton et al. Reference Layton, Watters and Dazeley2011a).
There are a large number of clustering algorithms in the literature, with many different types of algorithms and assumptions about the nature of cluster analysis. Different combinations of algorithm and authorship method may perform differently, making a true comparison between full methodologies difficult – Was the difference due to the clustering algorithm or due to the authorship method? Further, non-deterministic cluster analysis methods are inherently difficult to test, as they can produce different results for the same input. If the operating cost of such algorithms is high, it may not be possible to perform multiple iterations of the algorithm to find standard clusters. As a result, there is a need to test the quality of the authorship distance method independently from the application with a clustering algorithm.
In this research, we propose to use a variation of the Silhouette Coefficient (SC) to rank authorship distance methods by comparing the distance between instances to their base classes. The choice of the SC to rank distance metrics stems from the observation that cluster analysis algorithms have been shown to perform better on data that more naturally form clusters. Clusters are more naturally formed when the distance between points is low when they are within the same cluster and are high otherwise.
In recent research, Duarte et al. (Reference Duarte, Fred, Lourenço and Duarte2010) tested a large number of datasets with a large number of evaluation metrics using a fixed clustering algorithm. Of the synthetic datasets used, the datasets that naturally formed dense and separated clusters, such as the cigar and 3 Half Rings datasets, scored equally or higher (across all evaluation metrics) than those with clusters, which, at least visually, were not dense and well separated, such as Bars and Complex (compare Table 1 with Figure 1 in Duarte et al. Reference Duarte, Fred, Lourenço and Duarte2010). This observation leads to the following hypothesis, which is used as the basis for the testing methodology:
Distance metrics that naturally define dense and separated clusters lead to higher quality results after cluster analysis is performed.
The corollary of the above hypothesis is that if an authorship distance method is lower for documents with the same author and higher for documents from different authors, then a cluster analysis will more easily be able to find clusters which correlate highly with authorship. Therefore, evaluating this correlation is important to the development of effective authorship methods for UAA.
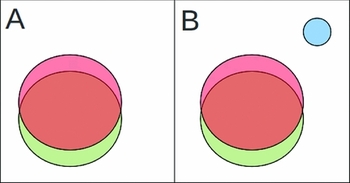
Example of how including data can significantly alter the mean Silhouette coefficient (SC) value. Part A shows two highly overlapping clusters, which has a negative SC. Part B has the same clusters, but includes another cluster which is dense and well separated. While most of the points are still overlapping and poorly clustered, the overall set of clusters has a positive SC.

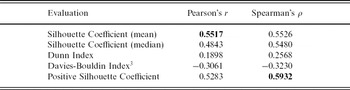
Correlation between each evaluation measure and the V-measure of an application of cluster analysis using all authorship methods and corpora

1.1 Contributions
This paper gives three major contributions to research. The first contribution is an examination of the breakdown point of the SC, showing its susceptibility to outliers when calculated for a set of points. A theoretical examination is performed and then an example of the problem is given. The second contribution is the Positive Silhouette Coefficient (PSC), which is the proportion of points in a set with a positive SC value. This is not as susceptible to the influence of outliers as the standard SC. This new evaluation metric is then tested by comparing the correlation of the PSC with the V-measure of an application of cluster analysis. The third contribution is an application of the positive SC to the evaluation of authorship distance methods. This evaluation gives insight as to which metrics would perform best in a UAA methodology.
This paper is structured as follows. An overview of authorship analysis is first given, followed by the derivation of the positive SC. The authorship distance methods and corpora used in this paper are then described, forming the basis for the following two experiments: The first experiment is a validation of the PSC, testing the correlation between the PSC and clusters obtained by the k-means++ algorithm. The methodology of this experiment is presented first, followed by the results. The second experiment is then described, which ranks authorship distance methods for their applicability in an unsupervised environment using the PSC. As before, the methodology is presented followed by the results. A discussion of the results of both experiments follows, along with the conclusions on the presented research.
2 Authorship analysis
This paper evaluates a number of authorship distance methods for applicability in an UAA environment. A number of supervised authorship attribution methods (Juola Reference Juola2008) are extended for use in an unsupervised environment. In authorship attribution, a classification model is trained using a set of training documents with known authorship (Stamatatos Reference Stamatatos2009). That trained model is then used to predict the author of a set of testing documents, which were not included in the training. In UAA, documents are clustered with an aim to generate clusters correlating strongly to true authorship. There are no ‘training’ documents of known authorship, and therefore a model must be built looking only at features contained within the documents.
Supervised authorship distance methods profile a document according to some feature set and then calculate some form of distance between either an author profile and a document profile, or between two document profiles (Layton et al. Reference Layton, Watters and Dazeley2011a). A document profile is the list of values corresponding to a set of features for a single document. Methods, such as Common n-grams (CNG), create author profiles as part of the training process for each candidate author. Profiles for each of the testing documents are then created, with the predicted author for each document being the one with the author profile with the highest similarity. Another methodology for authorship attribution is to create a document profile for each training document and map the profiles onto a vector space, with each dimension corresponding to a feature (Zheng et al. Reference Zheng, Li, Chen and Huang2005). A machine learning algorithm, such as SVM, is trained using this mapping which then predicts the class of new training documents. These two methodologies will be referred to as the author profile-based methodology and the vector space methodology respectively.
In each of the above cases, the methodologies can be altered for use in an unsupervised environment. For vector space methodologies, a set of features F is chosen to represent the documents. A vector is then created for each document containing the ordered values for each collected feature. These features are collected for every document and combined to create a dataset X such that X i,j is the value of feature Fj for document i. Many cluster analysis methods use a vector space model for clustering points. This makes applying the vector space methodologies to an unsupervised problem trivial by simply replacing the classification algorithm (such as SVM) with a clustering algorithm (such as k-means).
Author profile-based methodologies for authorship attribution are classification methods requiring a training set of documents of known authorship. The training set is used to create a profile of each author based on a set of features. This type of methodology is usually used for Local n-gram-based methods, such as CNG (Kešelj et al. Reference Kešelj, Peng, Cercone and Thomas2003). For a given author, CNG takes the L most frequently occurring n-grams from all training documents known to be from the current author. These n-grams, along with their frequencies, form the author's profile. All candidate authors are profiled using this procedure. Documents of unknown authorship are then profiled in the same way; the L most frequently occurring n-grams are used as the document profile. A measure of distance between two profiles is then used to determine which author profile is the closest to the document profile. The author corresponding to the closest author profile is predicted as the author of the document. There are several variations to CNG in the literature. Two prominent versions are Source Code Author Profiles (SCAP) and Recentred Local Profiles (RLP) methods. SCAP is an effective simplification of CNG, discarding the frequencies and using only the occurrence of a feature in the L most frequent n-grams (Frantzeskou et al. Reference Frantzeskou, Stamatatos, Gritzalis and Chaski2007). The similarity between two profiles is the size of the set intersection between the contained profiles. RLP introduces a corpus default value, which is the expected value for an n-gram given to the language of the document (Layton, Watters and Dazeley Reference Layton, Watters and Dazeley2011b). Values are recentred by subtracting the expected value, giving a value for how ‘unusual’ the usage of an n-gram is, rather than the overall usage.
In an unsupervised environment, author profiles cannot be created – there are no documents of known authorship to create them. Instead, document profiles for each document are created and the distance between profiles is calculated using the same procedure as if using author profiles (Layton et al. Reference Layton, Watters and Dazeley2011a). This creates a distance matrix M such that M i,j is the distance between document profiles i and j. Using this distance matrix, a large number of clustering algorithms can be used. One example method is graph-based clustering, in which a graph G=(V, E) is created, where the vertices V correspond to the documents, and each edge in E has a weight corresponding to the distance between the two documents (Foggia et al. Reference Foggia, Percannella, Sansone and Vento2007).
2.1 Previous evaluation methods
One method for evaluating the quality of an authorship distance method used in previous research was the one employed by Juola and Baayen (Reference Juola and Baayen2005). Their evaluation compares the average distance between documents sharing an author and the average distance of documents not sharing an author. While a valid comparison, it does not adequately test whether documents would be clustered together in a UAA setting. As an example, consider a set of authors A=A 1, A 2, A 3, A 4 with each author having the same number of documents and using a sufficiently accurate method for calculating distance between documents by authorship. Let authors A 1 and A 2 have a similar writing style, as well as authors A 3 and A 4, and let the similarity between each of these pairs be close to the within-author similarity. Let the distance between these author pairs (e.g. A 1 and A 4) be very high. The comparisons of the means will show that there is significant difference between the documents written by one author and another. This is due to the fact that there are a greater number of documents unlike those written by a given author, than there are like them. As a result, the mean SC is very different, with significance increasing with the number of documents per author. Such an experiment would not perform adequately in an unsupervised scenario, where some of the documents by authors A 1 would be mis-clustered with the documents by authors A 2 and so on. One method for overcoming this weakness is to focus on the next-nearest cluster, which is addressed with the SC.
Several other metrics have been proposed in the literature, specifically for the purposes of evaluating clusterings of data. Many methods compare two sets of labellings, normally the ‘ground truth’ classes to a set of clusters and are known as external metrics (as they rely on external data). These are supervised metrics, including information gain, rand index, adjusted mutual information and the V-measure. As the focus of this research is on evaluating using a distance matrix and a set of labels, these methods are not applicable.
Unsupervised methods, also known as internal metrics, include the Dunn Index, the Davies Bouldin Index, and the SC. These compare a set of clusters by ensuring that the points within the cluster are closer to each other than the points not within the same cluster. Dunn's Validity Index has higher values for clusterings that are both compact and well-separated (Dunn Reference Dunn1974). Davies–Bouldin (Davies and Bouldin Reference Davies and Bouldin1979) measure the within-cluster scatter, compared with the between-cluster separation, where scatter is defined on the basis of the distance of each point in the cluster from the centroid. Many of these metrics were compared by Duarte et al. (Reference Duarte, Fred, Lourenço and Duarte2010), who found that the SC is a highly effective metric, more than either Dunn or Davies–Bouldin. The SC is therefore focused in this research and is described in the next section.
2.2 The Silhouette coefficient
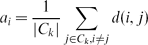
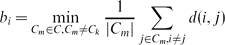
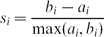
The Silhouette Coefficient was created as a measure of cluster density and separation (Rousseeuw Reference Rousseeuw1987). The typical use case of the SC is to evaluate a particular clustering of a dataset and compare it with other clustering of the same dataset (Layton et al. Reference Layton, Watters and Dazeley2011a). Given a set of instances I in clusters C (typically partitions), the SC si for an instance i∈I in cluster Ck∈C is calculated using (3),
 \begin{eqnarray}
a_i &=& \frac{1}{|C_k|}\sum \limits _{j \in C_k, i \ne j} d(i, j)
\end{eqnarray}
 \begin{eqnarray}
b_i &=& \min \limits _{C_m \in C, C_m \ne C_k}\frac{1}{|C_m|}\sum \limits _{j \in C_m, i \ne j} d(i, j)
\end{eqnarray}
 \begin{eqnarray}
s_i &=& \frac{b_i-a_i}{\text{max}(a_i, b_i)}
\end{eqnarray}
The SC is bounded in the interval [−1, 1]. Negative values for a point i indicate that the instance is in the incorrect cluster. Positive values indicate a correct and dense clustering, with higher values indicating a greater ratio between the values of bi compared with ai. This in turn is indicative that the instance i is more like other instances in its own cluster than in instances of the next closest cluster. Values around 0 indicate that the clusters are overlapping.
3 The positive Silhouette coefficient
As noted above, the SC is defined for each instance in a dataset, while the SC for a set of points is simply the mean of the SCs of each instance (Rousseeuw Reference Rousseeuw1987). This definition can cause problems, as the mean is easily skewed by outliers and can cause the SC for a set of instances to misrepresent the SC of the points within that set. The lack of stability in the mean is a well recognised trait, with research on the topic appearing as early as in 1934 (Pollard Reference Pollard1934).
The main concern with the mean as a measure of the central tendency is that the mean has a 0 percent breakdown point (Huber and Ronchetti Reference Huber and Ronchetti1981). As an example, given a sample Y of points in a one-dimensional space with a mean Y, by adding a single point a to Y, the mean becomes  $\frac{n\bar{Y} + a}{n+1}$, where n=|Y|. This is unbounded, meaning that a single outlier can alter the mean to an arbitrary value.
A similar problem exists for the SC, however the problem is not as pronounced, as the SC is bounded in the interval [−1, 1]. However the effect of a small number of outliers can cause a significant change. As an example, consider a dataset with two overlapping clusters, each of the range [0, 1) in intervals of 0.1. The mean SC for this dataset is –0.1, descriptive of the overlapping nature of the clusters. Adding a third cluster containing points in the range [20, 20.5) with an interval of 0.1 makes the mean SC approximately 0.118. This value would imply that points in this new dataset would generally have a positive SC, when just five of the twenty-five points have a positive SC. A two-dimensional representation of this is given in Figure 1.
To overcome this problem, this research proposes to use the proportion of points with a positive SC as an evaluation metric, as opposed to the mean value. A document can only have a positive SC if it is closer to its true author than any other, regardless of the magnitude of the SC for that value. It is therefore more important to measure the number of documents that would be assigned the correct author rather than the mean magnitude. This new metric is referred to as the PSC. Formally, given a set of points pi∈P with Silhouette Coefficient Spi, the PSC is defined as follows:
 \begin{eqnarray}
PSC_P = \vert \lbrace p_i \mid p_i \in P, S_{p_i}>0 \rbrace \vert
\end{eqnarray}
4 Authorship distance methods
A large representative sample of the authorship attribution methods is tested for their applicability in an unsupervised environment in this paper. Vector space-based methods tested in this paper are as follows:
• Each of the four subsets of features from Zheng et al. (Reference Zheng, Li, Chen and Huang2005): character, word, structural and syntactic features.Footnote 1
• Every combination of the above four feature subsets (Zheng et al. Reference Zheng, Li, Chen and Huang2005).
• Bag-of-Part of Speech (POS) n-grams (BOPOS).
• Bag-of-words (BOW).
• Bag-of-n-grams (BOn) (Global n-grams).
For the last three items in the above list, L values used will be 50, 100, 200, 500, 1,000, 2,000, 3,000, 5,000, 7,500 and 10,000. For each of the items in the list, three different distance metrics will be used: Euclidean, Cosine and Correlation. Normalisation of the values will also be tested, with and without the use of tf–idf weighting (Jones Reference Jones1972). Note that if tf–idf is not used, the values are still normalised linearly such that every feature has a maximum of 1 and minimum of 0.
The author profile-based methods tested in this chapter are as follows:
• Common n-Grams (Kešelj et al. Reference Kešelj, Peng, Cercone and Thomas2003) using character n-grams.
• Source Code Author Profiles (SCAP) (Frantzeskou et al. Reference Frantzeskou, Stamatatos, Gritzalis and Chaski2007) using character n-grams.
• Recentred Local Profiles (Layton et al. Reference Layton, Watters and Dazeley2011b) using character n-grams.
5 Authorship corpora
The corpora used for testing these methods comes from three separate sources. The first is a collection of emails known as the Enron dataset (Klimt and Yang Reference Klimt and Yang2004). The second is a collection of forum postings, called the Forum Dataset (Pillay and Solorio Reference Pillay and Solorio2011). The third is a collection of Greek newspaper articles known as the TO BHMA (The Tribune) dataset (Stamatatos Reference Stamatatos2006). The use of three broad ranging datasets was deliberate in an attempt to capture a range of authorship problems to ensure that the results were not indicative of features of any particular dataset. Instead, the results should be indicative of the general performance of the methodologies.
The Enron dataset is a collection of emails from the Enron corporation made available publicly during a legal investigation (Klimt and Yang Reference Klimt and Yang2004). The dataset comprises of over 200,000 emails by 158 users. This dataset has been used for a variety of purposes from investigating the flow of information in corporations to behavioural analysis on email usage. Emails are collected in mail folders for a variety of purposes, including email sent by the user, sent to the user and saved by the user in another folder. The dataset has been described in significant detail in Klimt and Yang (Reference Klimt and Yang2004). In the testing methodology, only email from the ‘sent mail’ folder for each user is collected as these emails are assumed to have been authored by the owner of the mailbox. Further, a sample of the dataset is taken, with five authorship problems each created by selecting five authors at random and choosing up to forty emails from each author (if less emails were sent by that author, all were included). Samples were taken to reduce the complexity of the problem, which is higher for unsupervised applications, compared with supervised applications.Footnote 2 The Enron corpus has been used in multiple supervised authorship studies to date (Allison and Guthrie Reference Allison and Guthrie2008, Iqbal et al. Reference Iqbal, Hadjidj, Fung and Debbabi2008, Corbin Reference Corbin2011).
The Forum dataset is a collection of postings to a forum titled ‘Chronicle of Higher Education’ (Pillay and Solorio Reference Pillay and Solorio2011). In general, these forum postings are short, with many documents having a sentence (or a fragment of one). The dataset used in this experiment is described in detail in Pillay and Solorio (Reference Pillay and Solorio2011), which comprised one hundred authors posting in the same category of the forum. As with the Enron dataset, a sample of the data was taken. As before, five authorship problems were created each by taking five authors at random and selecting up to forty postings from each author.
The TO BHMA dataset comprised articles from a major Greek newspaper (Stamatatos Reference Stamatatos2006). This dataset was collected by Stamatatos (Reference Stamatatos2006) for authorship attribution studies. There are two authorship problems in this dataset, Group A and Group B. Group A consists of ten randomly chosen authors from the TO BHMA dataset who write mainly about current affairs. Some of the texts are from different genres of the newspaper, but the important feature is that most of the texts are from the current affairs section of the newspaper. Group B consists of ten randomly chosen authors whose writings are mainly essays on topics, including science, culture and history. This set was chosen so that texts where ‘the idiosyncratic style of the author . . .(was) not overshadowed by functional objectives’ (Stamatatos Reference Stamatatos2006, p. 828). More details about the dataset are contained in Stamatatos (Reference Stamatatos2006). In the testing methodology, all texts (both training and testing) are used for each group.
6 Cluster analysis validation
To validate the new evaluation metric, we calculate correlation between the PSC scores and an evaluation of the resulting clusters using all combinations of authorship method and corpus defined in previous sections. The authorship distance methods are used in combination with the variant (Hartigan and Wong Reference Hartigan and Wong1979) to produce clusters. These clusters are then evaluated to determine the quality of the clusters compared with the ground truth – the original authorship classes. The correlation between the cluster evaluation and the PSC evaluation of the authorship distance methods is then calculated. There is an expectation that the correlation be higher than either using the mean and median SC.
The k-means algorithm has undergone significant improvements since its inception, although the core method remains consistent. We use the k-means algorithm described in Arthur and Vassilvitskii (Reference Arthur and Vassilvitskii2007), known as k-means++. The significant difference is the choice of seeding algorithm to determine the initial cluster centroids. This seeding algorithm has been shown to provide significantly better results than random seeding.
The clusters themselves will be evaluated using the V-measure (Rosenberg and Hirschberg Reference Rosenberg and Hirschberg2007). The V-measure is the harmonic mean between the homogeneity and the completeness of the clustering solution and has a relation to the F-measure score as a harmonic mean between the precision and the recall. The V-measure is an evaluation of the agreement between a set of clusters and a set of classes. Higher scores are better with a value of 1 indicating full agreement – that each cluster corresponds to exactly one class and all instances within that class are in the cluster. Lower values indicate that cluster partitioning of the data does not generally agree with the separation of the data using class values. In this application, we compare the resulting clusters from the k-means++ algorithm to the authorship classes of the original documents.
To evaluate our findings, both Pearson's correlation coefficient and Spearman's rank correlation coefficient are calculated to determine the correlation between the PSC and V-measure. Pearson's correlation coefficient (r) between variables X and Y is the covariance of two variables divided by the product of the variance of each variable. Spearman's rank correlation coefficient (ρ) is a correlation of the ranks of each variable as opposed to the values. The value of ρ is more robust than r to outliers, as ranks are less affected than values are by outliers.
For both correlation methods, the variables tested are the PSC obtained by the authorship method and the V-measure score of the clusters resulting from applying k-means++. For each authorship method, k-means++ was applied fifty times with the median score used in calculations. The correlations are then givenFootnote 3 with a comparison against the mean and median SC values. For a set of points, the SC was historically given as the mean value of the SC value for each point. We also present the median SC, as the median is often used as a method to remove the effect of outliers.
6.1 Validation results
Table 1 shows the correlation results for both Spearman's and Pearson's correlation coefficients across all authorship methods and corpora presented in this paper. The value given is the overall correlation between the PSC evaluation of the authorship method and the V-measure evaluation of the clusters resulting from applying k-means++ on that authorship method. Both Pearson's r and Spearman's ρ are given. The two tailed p-values of an uncorrelated system producing a correlation at least as high as that given for all experiments was p<0.0001. Evident from the results, the correlation between the PSC and the V-measure is higher than other metrics using Spearman's ρ. The mean SC has a higher correlation for Pearson's r, which is noteworthy as both are affected by outliers. This result shows both that the SC is susceptible to outliers (as is Pearson's r) and the PSC has a lesser effect.
7 PSC ranking methodology
The next objective of this research is to rank authorship distance techniques by their applicability to an unsupervised environment. To achieve this, the PSC was created to rank authorship distance methods by their correlation to the ‘true clustering’ of the data – their authorship classes. The methods were then ranked according to the PSC, with the best performing considered more applicable in an unsupervised environment.
The authorship distance methods are ranked using the PSC. The SC is typically used to determine the quality of the clustering of data provided by cluster analysis – clusterings with a higher SC are considered to be of a higher quality than those with a lower value (Duarte et al. Reference Duarte, Fred, Lourenço and Duarte2010). In this scenario, the method used for calculating the distance is usually fixed and the clusters are changed to find the highest PSC value. In order to increase the PSC under this scenario, the clusters need to be of higher quality to match the distances formed by the authorship method. This would increase the number of points that have a positive SC, which in turn would increase the PSC. However, the PSC would not have the instability of the SC when it comes to outliers affecting the overall value.
In this application, the PSC was used to determine which authorship distance methods are better by fixing the ‘clusters’ and changing the method used to calculate the distance between points. The clusters are given as the ‘true clustering’ of the data – the actual authorship class of the documents themselves. In order to increase the PSC under this scenario, the distance formed by the authorship method needs to match the true authorship classes more closely. The ideal situation would be a distance method that matches every document to its true author. This would result in a PSC value of 1.0, the highest possible value.
Each authorship method described in Section 4 is tested using the PSC. For each tested method, a distance matrix M is calculated such that M i,j is the distance between documents di and dj. The PSC is then calculated using M and ‘clustered’ using actual authorship as cluster labels. Methods with a higher PSC are considered to be better for use in an unsupervised environment, as they are expected to result in clusters with a higher correlation to true authorship based on the hypothesis given in Section 1.
8 Results
The results obtained by applying the testing methodology from Section 7 to the methods and data given in Sections 4 and 5 are provided in this section. These large number of experiments are summarised in this section in the interest of clarity and space. The full results of the experiments are available with the authors.
8.1 Feature subset results
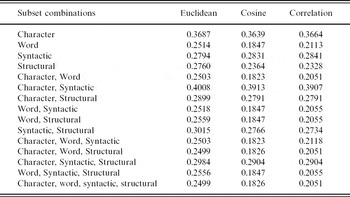
Results for the feature subsets were substantially lower than the later results, with the highest PSC just 0.4008 using the character and syntactic combination with the Euclidean distance metric. The Euclidean distance metric also scored the highest overall, with a mean of 0.2820. The mean scores for the Cosine and Correlation distance metrics were 0.2393 and 0.2515 respectively. This difference is significant for both metrics, with p-values for Cosine and Correlation compared with Euclidean values of 0.0010 and 0.0013 respectively, comparing all corpora scores using a two tailed paired t-test. The results of the experiments for each dataset are given in Table 2.
PSC for feature subset combinations (mean across all corpora)

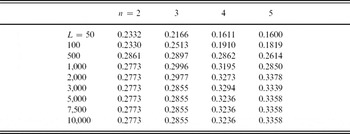
PSC for BOPOS over all corpora with the Cosine distance metric using tf–idf normalisation (mean over all datasets)

The best scoring combinations using the Euclidean distance metric were in order the following order:
(1) Character and Syntactic combination (0.4008).
(2) Character only (0.3687).
(3) Syntactic and Structural (0.3015).
(4) Character, Syntactic and Structural (0.2984).
(5) Character and Structural (0.2899).
As evident from the above results, the Word subset did not perform well for this task. Including the Word subset resulted in a mean net loss of 0.0645 to the number of documents with a positive SC. Overall, the Structural subset also resulted in a net loss of 0.0211, while the Character and Syntactic subsets resulted in moderate net gains of 0.0274 and 0.0085 respectively. The results also show the dangers of blindly adding features in an unsupervised application, as the PSC for all included features was 0.2499, which was below the overall mean value of 0.2820.
8.2 Bag-of-POS (BOPOS)
The BOPOS model again scored poorly, with the highest recorded value listed as 0.3378 using the Cosine distance with n = 5 and L = 2, 000, using tf–idf normalisation. The Cosine distance metric also had the highest overall PSC, with 0.2796 using tf–idf and 0.2415 without tf–idf. The Correlation distance metric had a PSC value of 0.2612 using tf–idf and 0.2408 without using tf–idf. The Euclidean distance had a PSC of 0.1952 with tf–idf and a PSC of 0.2303 without tf–idf.
These mean values also show that tf–idf was better for the Cosine and Correlation distance metrics but worse for the Euclidean distance metric, with all differences having a p-value of less than 0.001 for their respective metrics. The difference between the Cosine and Correlation metrics compared with the Euclidean distance metric is an inbuilt normalisation factor, which may have contributed to this finding.
While the PSC tends to increase with higher values of both n and L, these increased values are neither regular nor significant in most cases. Some increased values are significant, such as increasing n from 2 to 3; however, the number of comparisons suggests that this increase may be simply due to a large number of tests being preformed rather than a benefit in itself. Differences were also generally small for the Cosine distance with tf–idf, the maximum difference between sequential values for L tested was just 0.0216 and that for n it was just 0.0098.
8.3 Bag-of-Words (BOW)
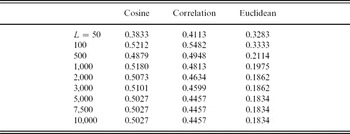
The highest scoring BOW experiment tested used the Correlation distance with L=100, with a PSC of 0.5482 and using tf–idf normalisation. The Cosine distance metric scored better overall with a PSC of 0.4929, compared with PSC values of 0.4662 and 0.2649 for Correlation and Euclidean respectively. For these PSC values, the Cosine and Correlation scored better with tf–idf normalisation, while the Euclidean scored better without tf–idf. Table 4 contains a summary of the BOW results.
PSC for BOW over all datasets using tf–idf (mean over all datasets)

As with the BOPOS experiments, using tf–idf gave a statistically significant increase for Cosine (p=0.046) and a statistically significant decrease using the Euclidean distance metric (p=0.005). There was an increase in the Correlation distance metric as well; however, this was not significant at the p=0.05 level with a p-value of 0.151.
There were no trends discovered in changes of L values in relation to the resulting PSC scores. No increases in the L values tested made a significant difference and there was no direct correlation, positive or negative, between the L value and the PSC.
8.4 Bag-of-n-grams (BOn)
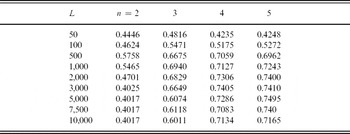
The highest scoring BOn method used the Correlation distance metric with L=3, 000 and n=5 using tf–idf normalisation, which scored 0.7495. The correlation metric had the highest PSC of the tested distance metrics of 0.6029 with tf–idf normalisation, above Cosine (0.5565 with tf–idf) and Euclidean (0.2897 without tf–idf). As evident by the PSC values, the Cosine and Correlation distance performed similarly with a difference of 0.0465 (p<0.001) and much better than Euclidean with differences of 0.2830 and 0.3295 (p<0.001) when using tf–idf. Without tf–idf, the improvement is only slightly lessened with differences of 0.2653 and 0.2838 respectively (p<0.001). Table 5 contains a summary of the BOW results.
PSC for BOn over all datasets using tf–idf and the Correlation distance metric (mean over all datasets)

The tf–idf normalisation results were similar to the previously mentioned methods; using tf–idf improved the Correlation and Cosine results but decreased the Euclidean results. However, this result is only significant for the Correlation distance metric (p=0.0045) and the increase is just 0.0295.
For the Correlation and Cosine distance metrics using tf–idf, the PSC tended to increase as n increased from 2 to 5. There also appears to be a peak value for L of approximately 1,000, after which the PSC tends to decrease slightly with increasing L values, although no individual increase was significant. While the highest listed score was using L=3, 000, the improvement over lower values for L was only slight and not similar to other values for n.
8.5 Local n-grams
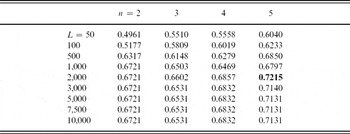
When using character n-grams, the highest scores for the CNG, SCAP and RLP methods were 0.7215, 0.5932 and 0.6460 respectively. The CNG method also had the highest PSC of 0.6490 followed by RLP (0.5527) and SCAP (0.4994). All differences were significant with p<0.001 using a two tailed paired t-test. This ordering is different to that observed in previous research, where it was discovered that RLP had a higher classification accuracy than SCAP and CNG (Layton et al. Reference Layton, Watters and Dazeley2011a). This shows the differences between using author profiles and using document profiles in this research. This finding provides strong evidence that classification accuracy is insufficient for unsupervised learning.
For both CNG and RLP, the PSC tended to increase with increasing L, while the PSC tended to decrease with increasing L for SCAP. This suggests that CNG and RLP work better with more features for document-based profiles. Further, for all three methods, the PSC tended to increase with increasing n values as well. The results for CNG are given in summary in Table 6.
PSC for the CNG methodology (mean over all datasets)

8.6 Separated by corpus
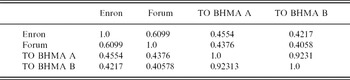
A further investigation of the results shows some variance in the best performing methods when examining individual corpora. Table 7 shows the Spearman's correlation between the efficacy of different methods. There are three comparisons listed. First all parameters for the models are considered, as listed in previous tables, with the relative effectiveness of the techniques measured. Secondly, we consider only the algorithm types (such as CNG or BOW), and average all parameters tested for each algorithm type. Thirdly, we consider the major parameter only, taken to be n for the local n-gram models and L for the BOW model. All models with the same major parameter were grouped and the mean value taken to represent the set.
Correlation between results for different corpora using Spearman's Correlation

9 Discussion
The experiments described in Section 7 used the PSC to measure the degree of correlation between an authorship distance method and true authorship classes in an unsupervised setting. This distinction was deemed to be necessary, as UAA has no knowledge of the authorship of any documents and therefore cannot create effective author profiles. Document profiles have more variation in the values of features, such as the frequency of particular n-grams, which makes it more difficult to group documents by authorship than for supervised learning. The results from applying the testing methodology presented in the previous section show the effectiveness of different forms of authorship analysis when applied in an unsupervised environment.
The features and the BOPOS-based methods performed poorly in the experiments, suggesting that these techniques are inadequate for UAA. Of these two methods, the best PSC found was just 0.4008, suggesting that more than half of the documents are considered closer to another author than the true author. Further to this, most scores were considerably lower with PSC scores of around 0.3. The BOW method performed better than either of the features or the BOPOS methods, with a highest score of 0.5482. When using the Cosine distance metric, most PSC scores listed were above 0.5, indicating that more than half of the documents were considered more similar to their true author than another author. This suggests that the BOW method would be an adequate baseline for future experiments and an expected benchmark score.
The BOn method scores considerably better than BOW, with a highest score of 0.7495. The highest score for n=2 was 0.5758, which was low compared with the PSC scores for higher values of n. This suggests that n values of 3 or higher are needed for effective UAA. It was also found that the Correlation distance metric performed best with this method and that tf–idf normalisation makes a significant, if small, improvement.
The CNG method performed best of the Local n-gram methods, with the highest score of 0.7215. While lower than the BOn method, the overall PSC for the tested parameters was 0.6490, higher than the PSC for BOn (0.6029). While this result is a product of the parameters tested more than the method itself (choosing a different set of parameters would result in different PSC values), it does highlight greater stability in the result of CNG compared with BOn. It was also found that the SCAP methodology performed poorly in general for this purpose, despite high accuracy in supervised authorship attribution. The RLP method performed better than SCAP, but was still below the results achieved by both CNG and BOn.
10 Conclusions
In the presented research, a number of authorship distance methods and features were retrieved from the literature and adjusted for use in an unsupervised learning environment. The vector-based methods did not need specific adjustment; these methods could be used as input to a clustering algorithm based on the vector space model, as many clustering algorithms already leverage. The author profile-based methods instead needed to be considered, as these would in an unsupervised learning environment; without knowledge about the authors of the documents, author profiles cannot be created. Instead, profiles must be built for individual documents and tested based on this adjustment.
An evaluation metric was created to determine the efficacy of methods in an unsupervised learning environment. The SC for a set of points is normally calculated as the mean of the SC of each point in the set, labelled as mean SC. However, it was deemed that this metric could be skewed by a small set of points with unusually high or low SC value. To account for this, a new evaluation metric was created that was not skewed and considered the application of methodology in grouping documents by authorship. This evaluation metric was named PSC and is the proportion of documents with a SC of above 0. The PSC was validated by calculating correlation between it and the V-measure score, and comparing that with the mean and median SC values. The PSC scored higher for both Pearson's r and Spearman's ρ. In both cases, the PSC scored highest, indicating that its results correlated more closely to an application of cluster analysis.
A number of authorship distance methods, adjusted for use in an unsupervised learning environment, were then evaluated using PSC. The results of this experiment indicate that the CNG and BOn methods would perform best in an UAA methodology. The BOPOS and feature subset-based methods performed poorly, with less than half of documents considered more similar to its true author than alternate authors. The BOW method performed slightly better, with just over half of the documents considered more similar to their true author. Local n-gram methods RLP and SCAP also performed around this mark, with RLP having PSC scores of up to 0.6460, while SCAP had the highest score of 0.5932.
Both the CNG and BOn methods scored above 0.7 using different parameters, showing high values in character n-grams for authorship analysis. The BOn method had the highest individual score of 0.7495 for any experiment, while the CNG method scored 0.7215. Overall, the BOn method had better scores when correct parameter values were chosen. Values for n≥4 scored above 0.7 for most values of L when using the Correlation distance metric and tf–idf normalisation. The CNG method was more robust against poorly selected parameter values. Of those tested, the CNG method scored a PSC of 0.6490, higher than the PSC score for BOn (0.6029). Its lowest score was also higher, CNG's lowest PSC was 0.4961 compared with BOn's lowest (using the Correlation distance metric) of 0.4248. This robustness against bad parameters suggests that it may be more reliable in an unsupervised environment where good parameters cannot be guaranteed. If good parameters are chosen, the PSC results indicate that the BOn method would perform better.
These results give an evaluation of authorship distance methods for use in an unsupervised environment. Future work could build upon these results to create better methodologies for clustering documents by authorship. The testing framework shown here may potentially be applied in non-authorship settings enabling the evaluation, using the PSC, of distance methods in other environments.
Acknowledgment
This research was conducted at the Internet Commerce Security Laboratory and was funded by the State Government of Victoria, IBM, Westpac, the Australian Federal Police and the University of Ballarat. More information can be found at http://www.icsl.com.au