In recent years, there has been a rising preference for studying students’ strengths and positive qualities, rather than deficits, in the field of educational psychology (Kristjánsson, Reference Kristjánsson2012). Among those qualities, the significance of school engagement is essential to understanding positive development during the period of adolescence (Rodríguez-Fernández, Ramos-Díaz, Madariaga, Arrivillaga, & Galende, Reference Rodríguez-Fernández, Ramos-Díaz, Madariaga, Arrivillaga and Galende2016), and for successful outcomes in adult age, including higher education, better employment opportunities, positive self-perceptions, and well-being (Abbott-Chapman et al., Reference Abbott-Chapman, Martin, Ollington, Venn, Dwyer and Gall2014). Furthermore, this construct has been identified as a good index of adaptation in the school context, and is considered a key element of psychosocial development and academic success (Ros, Goikoetxea, Gairín, & Lekue, Reference Ros, Goikoetxea, Gairín and Lekue2012). That has prompted a growing interest in developing theoretical models and assessment tools to study and apply it in educational contexts.
In effect, school engagement has recently been the subject of extensive debate, because it is a complex concept challenging to define and measure (Garret, Reference Garrett2011). Inconsistencies in the assessment tools researchers are using reflect their varied definitions of the construct (Wang, Willett, & Eccles, Reference Wang, Willett and Eccles2011), which still has no one, unequivocal conceptual definition (Veiga, Burden, Appleton, Taveira, & Galvão, Reference Veiga, Burden, Appleton, Taveira and Galvão2014). Some studies have developed measurement instruments designed to evaluate school engagement as a global construct (Yazzie-Mintz, Reference Yazzie-Mintz2007). Others have adopted a two-dimensional model, including a behavioural component encompassing participation at school, and a psychological or emotional component that refers to a sense of identification with school (Skinner, Furrer, Marchand, & Kindermann, Reference Skinner, Furrer, Marchand and Kindermann2008).
Most of the scientific community now recognizes that this construct is multi-faceted (Wang et al., Reference Wang, Willett and Eccles2011), highlighting three dimensions: cognitive, emotional, and behavioral (Appleton, Reference Appleton, Christenson, Reschly, Wylie, Christenson, Reschly and Wylie2012; Fredricks, Blumenfeld, & Paris, Reference Fredricks, Blumenfeld and Paris2004). In other words, they believe school engagement corresponds to the feelings, thoughts, and behaviours students report about their experiences in the school context (Veiga et al., Reference Veiga, Burden, Appleton, Taveira and Galvão2014).
This three-dimensional approach is the basis for the School Engagement Measure (SEM) by Fredricks et al. (Reference Fredricks, Blumenfeld, Friedel, Paris, Moore and Lippman2005), whose original exploratory factor analysis produced three subscales. The first, behavioral dimension encompasses participation in school activities, and is defined as school-centered, positive actions and practices, like completing learning-oriented tasks (Reschly & Christenson, Reference Reschly and Christenson2006), attending class, paying attention in class (Voelkl, Reference Voelkl, Christenson, Reschly and Wylie2012), putting effort into schoolwork, academic achievement (Wang & Holcombe, Reference Wang and Holcombe2010), absence of disruptive behaviors, and respecting school rules (Appleton, Reference Appleton, Christenson, Reschly, Wylie, Christenson, Reschly and Wylie2012; Fredricks et al., Reference Fredricks, Blumenfeld and Paris2004). The emotional dimension is characterized as the student’s connection with school, sense of identification with it (Voelk, Reference Voelkl, Christenson, Reschly and Wylie2012), and emotional reactions to his or her school, classmates, and teachers (Yazzie-Mintz, Reference Yazzie-Mintz2007). It also refers to the student’s connection with school, how much he or she feels like part of it, connected to classmates, and happy, and his or her sense of belonging at school (Ros, Reference Ros2014). The cognitive dimension is defined as the student’s level of investment in the learning-oriented task, and refers to flexible problem-solving, personal effort, and self-regulation strategies (Fredricks et al., Reference Fredricks, Blumenfeld and Paris2004) on the part of the student.
The English-language version of the SEM by Fredricks et al. (Reference Fredricks, Blumenfeld, Friedel, Paris, Moore and Lippman2005) is known as one of the most widely used questionnaires to measure school engagement (Fredricks & McColskey, Reference Fredricks, McColskey, Christenson, Reschly, Wylie, Christenson, Reschly and Wylie2012), and is based on the three-dimensional approach most accepted currently. However, studies which empirically test its internal structure using a technique other than exploratory factor analysis have been lacking (Fredricks et al., Reference Fredricks, Blumenfeld, Friedel, Paris, Moore and Lippman2005; Fredricks & McColskey, Reference Fredricks, McColskey, Christenson, Reschly, Wylie, Christenson, Reschly and Wylie2012). As a result, more advanced statistical analyses have not been done that could enable researchers to confirm the questionnaire’s underlying three-dimensional structure. Furthermore, the instrument has not been validated in Spanish, so there is presently no valid, reliable instrument available in that language that is geared toward adolescents and takes the three-dimensional view. With that in mind, this study’s main objective is two-fold: first, to confirm the SEM’s factor structure (Fredricks et al., Reference Fredricks, Blumenfeld, Friedel, Paris, Moore and Lippman2005), and second, to analyze different types of validity, and variability between them. Regarding the second objective, there are reasons to empirically analyze variability in SEM scores as a function of level of education, because some studies have observed a drop in engagement during the transition from primary to secondary school (Mahatmya, Lohman, Matjasko, & Farb, Reference Mahatmya, Lohman, Matjasko, Farb, Christenson, Reschly and Wylie2012).
To demonstrate the SEM’s concurrent validity, another variable will be examined: perceived school performance. It is well established that school engagement is key to academic success (Motti-Stefadini & Masten, Reference Motti-Stefanidi and Masten2013). Similarly, some evidence has indicated school engagement is an antidote to low academic achievement and high dropout rates (Rumberger & Rotermund, Reference Rumberger, Rotermund, Christenson, Reschly, Wylie, Christenson, Reschly and Wylie2012). This justifies using the school performance variable as a reference point for the SEM’s criterion validity.
Method
Participants
The sample included 1,250 students (49% boys and 51% girls) ranging from 12 to 15 years of age (M = 13.72; SD = 1.09) and enrolled at one of nine schools (middle-class) in the Spanish autonomous community of Basque Country. Of those, four had private or semi-private licensing, and five were public schools. All were 1st- or 2nd -cycle students in the Obligatory Secondary Education system (ESO from the acronym in Spanish): 1st cycle, year 1 (21.8%), year 2 (28.2%), year 3 (28.2%), 2nd cycle/year 4 (31.4%). Analysis of contingency (Pearson’s chi-squared test) between sex and level of education did not produce statistically significant differences (χ2 (1) = 4.66, p > .05), so the groups comprising the sample can be considered balanced. In sample selection, we opted for the random selection method, choosing at random among various schools, and within each school, from various classrooms.
Instruments
The School Engagement Measure (SEM) (Fredricks et al., Reference Fredricks, Blumenfeld, Friedel, Paris, Moore and Lippman2005) is comprised of 19 items with a 5-point Likert-type response format (where 1 = never and 5 = all the time). Factor analysis of items on the original version yielded three scales, corresponding to behavioral engagement (5 items), emotional engagement (6 items), and cognitive engagement (8 items). The instrument’s psychometric properties, computed for the present sample, gave indexes of internal consistency (α = .81 for the emotional engagement scale, α = .74 for behavioural engagement, and α = .77 for cognitive engagement).
Moral, Sánchez-Sosa, and Villarreal-González’s (Reference Moral, Sánchez-Sosa and Villareal-González2010) Escala Breve de Ajuste Escolar (EBAE-10) [Brief Scale of School Adjustment] was applied to measure perceived school performance. The instrument contains three factors: adjustment problems to the scholastic environment (5 items), good scholastic performance (3 items), and intention to attend university (2 items). For the purposes of this study, only the performance subscale was selected (sample item: tengo buenas calificaciones [I get good grades]). Adolescents answer questions, indicating their level of agreement or disagreement with three Likert-type items, with response options ranging from 1 to 6 (with anchors completamente en desacuerdo [strongly disagree] and completamente de acuerdo [strongly agree]). The percentage of explained variance obtained for the school performance scale was 68.47% in this study’s sample, and internal consistency was adequate (α = .75).
Procedure
To adapt the original version of the SEM by Fredricks et al. (Reference Fredricks, Blumenfeld and Paris2004), we followed the general rules and recommendations about questionnaire translation and adaptation set forth by the International Test Commission (ITC; Muñiz & Hambleton, Reference Muñiz and Hambleton1996) to correctly adapt an instrument from one linguistic context to another. A back-translation process of SEM items was done using the method of translation (English-Spanish) and back-translation (Spanish-English). First, the original version was translated into Spanish by a native Spanish-speaker fluent in both languages and knowledgeable about Spanish and American cultures. The second step was to translate the result back into English, and compare the original to this new translated version, examining any non-equivalent meanings, and making corrections to generate the final version in Spanish. Based on our analysis, no item on the Spanish SEM needed to be eliminated or significantly modified.
School principals were contacted to explain the research project. Once their participation was confirmed, adolescents and their parents submitted informed consent forms. Next, two researchers went to schools and administered the assessments to participants during class time; all students in a given classroom filled out the questionnaire at the same time. It took approximately 10 to 20 minutes to administer. In order to mitigate response alignment with the research hypothesis, a single-blind design was employed, trying to prevent respondent from discovering the study’s aim. To ensure the absence of a social desirability effect, we ensured that all responses were anonymous, and that participation in the study was completely voluntary.
Data Analysis
To test the SEM’s structure, we turned to confirmatory factor analysis (CFA) technique, part of structural equation modeling methodology. Said analyses were done using a maximum likelihood estimation (MLE) procedure, and a matrix of covariance between items was entered into data analysis. The model’s goodness of fit was analyzed applying the chi-square statistic (χ2), with non-significant values (p ≥ .05) indicating that the model fits the data. However, because this index is highly sensitive to sample size and deviations from normal data distribution (Barret, Reference Barrett2007), other goodness of fit indexes were considered as well: CFI (Comparative Fit Index), GFI (Goodness of Fit Index), and IFI (Incremental Fit Index), for which values over .90 indicate the model adequately fits the data (Schumacker & Lomax, Reference Schumacker and Lomax2010). By the same token, the indexes RMSEA (Root Mean Square Error of Approximation) and SRMR (Standarized Root Mean Square Residual) were utilized. For those, values under .08 indicate acceptable model fit and values of .05 or less indicate goodness of fit between model and data (Hu & Bentler, Reference Hu and Bentler1999). And last, the ECVI (Expected Cross Validation Index), proposed by Browne and Cudeck (Reference Browne and Cudeck1992) was used to compare alternative models in a single sample. According to those authors, if a model has the smallest ECVI, or if ECVI does not vary for the different models examined, the model is considered stable within the population.
The statistical programs SPSS 22 and AMOS 21 were employed – for descriptive statistics and calculating correlations, and conducting CFA, respectively.
Results
To do multiple imputation of missing values (2.1%), an approximate score was generated on the missing item based on the participant’s pattern of responses, expectation-maximization algorithm, and the Markov chain Monte Carlo (MCMC). After testing for multivariate normal distribution, a basic assumption that structural models must meet, then eliminating outliers (1.3%), normal distribution was established using Mardia’s coefficient, the value of which was adequate (M = 37.12 < 70).
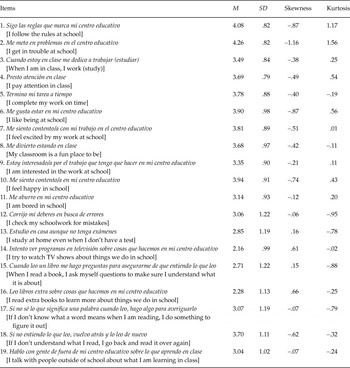
Table 1 presents descriptive statistics for the SEM’s 19 items. Values of central tendency, variability, skewness, and kurtosis are given for each item. SEM item scores ranged from M = 2.16 to M = 4.26, with standard deviations close to one. Generally speaking, values under 3 are recommended for skewness, and under 10 for kurtosis (Kline, Reference Kline2011), conditions which all items on the questionnaire met.
Mean, Standard Deviation, Skewness, and Kurtosis of the SEM Questionnaire

Confirmatory Factor Analysis
Next, we compared possible factor structures for the questionnaire based on the assumptions of school engagement theory: two-dimensional (M2), with cognitive and emotional aspects combining to form the psychological dimension of school engagement, and a behavioral component as the second dimension; and the three-dimensional model (M3a) comprised of behavioral, emotional, and cognitive engagement. For the sake of comparison, a one-dimensional model (M1) was also proposed, according to which school engagement has a single dimension encompassing all the dimensions hypothesized. Results appear in Table 2.
School Engagement Models’ Goodness of Fit Indexes

Examining each of the three models’ goodness of fit indexes, we observed, first, that the models differed significantly from one another, and that the one-dimensional model (χ2 (152) = 2,521.45, p < .001; GFI = .772; CFI = .664; IFI = .665; SRMR = .091; RMSEA = .112) and two-dimensional model (χ2 (152) = 2,053.94, p < .001; GFI = .730; CFI = .807; IFI = .731; SRMR = .083; RMSEA = .100) did not bear acceptable results. It was the three-dimensional model (M3a) that showed adequate goodness of fit (χ2 (149) = 1,203.96, p < .001; GFI = .896; CFI = .850; IFI = .851; SRMR = .066; RMSEA = .075), except that the chi-square difference was not significant. Nevertheless, since all its other parameters were adequate, and the final three-dimensional model (M3a) had better goodness of fit than the one- and two-dimensional models, it was our top choice to represent the internal structure of the school engagement questionnaire. The Expected Cross-Validation Index (ECVI) also identified the third model (M3a) as having the best goodness of fit, because its value was lower than for the one- and two-dimensional models.
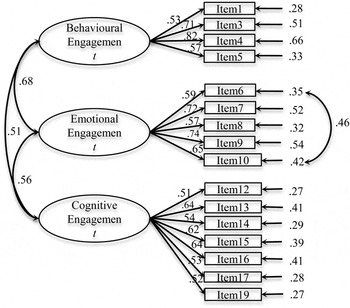
Then again, the modification indices collected indicate a need to reformulate the three-dimensional model (M3b) to improve its goodness of fit, undertaking a series of changes supported by theory. First, we reformulated the model by eliminating any items with low factor loadings (items 2, 11, and 18). Next, after evaluating the statistical significance of parameters omitted through the Lagrange Multiplier Test (Bentler, Reference Bentler2006), we added the error covariance in items 6 and 10, which changed the standardized coefficient by .16. That amount of change is consistent with theory, considering both items’ content refers to positive emotional states in the school context: me gusta estar en el colegio and me siento contento/a en el colegio [“I like being at school” and “I feel happy in school”]. Therefore, a second three-dimensional model (M3b) presented in Figure 1 was tested, the product of those modifications (eliminating items and including covariance). Chi-square was again significant (χ2 (764) = 2,364.09, p < .001), which would suggest the model did not fit the data. However, the values of all other indicators were adequate (χ2 (100) = 676.93, p < .001; GFI = .931; CFI = .906; IFI = .907; SRMR = .058; RMSEA = .068), and this reformulated three-dimensional model improved on the results of the previous one, showing goodness of fit. Comparing all the models analyzed, the reformulated one (M3b) was also the most stable in the population; it had the most favorable value of ECVI.
Internal structure of the School Engagement Measure (SEM).

Construct Validity and Reliability of Scores
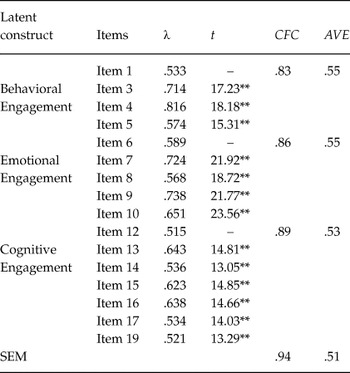
Construct validity was calculated based on the statistical significance of the factor loadings of indicators pertaining to each underlying construct. In Table 3, readers will find that all standardized factor loadings (λ) and t values were clearly above the minimum recommended values of .50 and 1.96 (p < .05), respectively (Hair, Black, Babin, Anderson, & Tatham, Reference Hair, Black, Babin, Anderson and Tatham2006). Reliability analysis was conducted using the composite reliability coefficient (CRC), which is computed in conjunction with structural equation modeling and provides a more suitable alternative to Cronbach’s alpha coefficient (Peterson & Kim, Reference Peterson and Kim2013), which has been come under criticism. In the present study, all the questionnaire’s dimensions yielded values over .80, surpassing the cut-off point of .70 considered the minimum accepted composite reliability coefficient (Nunnally, Reference Nunnally1967). Next, average variance extracted (AVE) represents the total variance in indicators explained by the underlying variable, and is therefore another indicator of reliability. It is recommended that AVE values not dip below .50, a criterion met by all dimensions of this version of the SEM (Hair et al., Reference Hair, Black, Babin, Anderson and Tatham2006). Thus, both reliability indicators were within the appropriate limits for the SEM overall, and its three scales (behavioral, emotional, and cognitive engagement), and we established that the questionnaire had good reliability indexes.
Construct Validity and Reliability of the SEM

Note: λ: Factor loadings; t: t values; CFC: Composite Reliability Coefficient; AVE: Average Variance Extracted.
** p < .01.
Discriminant Validity
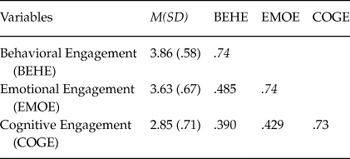
One criterion used to evaluate discriminant validity is that the correlation between constructs is less than the square root of AVE (Fornell & Larcker, Reference Fornell and Larcker1981). Table 4 displays Pearson’s correlations between the dimensions of school engagement, and the square root of AVE along the diagonal. In light of the results, we concluded there was discriminant validity between those constructs.
Descriptive Statistics, Pearson Correlations, and Discriminant Validity

Note: All correlations are significant (p < .01). Square root of AVE appears on the diagonal.
The Questionnaire’s Variability
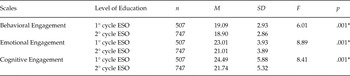
Displayed in Table 5 is the difference in each dimension of school engagement as a function of level of education. The data reflect high significant differences on all scales (behavioral, emotional, and cognitive engagement), with more favorable results in first-cycle ESO students (years 1–3) than in second-cycle students (year 4).
Differences on School Engagement Dimensions as a Function of ESO Cycle

* p < .05.
Concurrent Validity
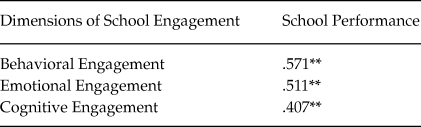
To analyze concurrent validity, Pearson’s correlations were calculated (Table 6) between scores on the three SEM scales and school performance, along with the complete structural regression model.
Correlational Coefficients between the Dimensions of School Engagement, and School Performance

** p < .01.
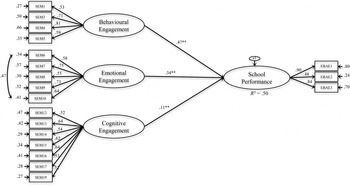
Given that the positive correlations (p < .01) found between SEM dimensions and the school performance variable ranged from r = .40 to r = .57, we confirmed they were positive and high, the first layer of support for the SEM’s concurrent validity. Next, we tested the structural model depicted in Figure 2. Its goodness of fit indexes were acceptable: GFI = .906; CFI = .884; IFI = .885; SRMR = .075; RMSEA = .073, except for the value of chi-square (χ2 (145) = 1,122.84, p < .001). Furthermore, the resulting structural model shows that the three scales of school engagement significantly predict school performance, adding a second layer of support for the questionnaire’s concurrent validity. Finally, school engagement explained a high percentage of variance in school performance (50%).
Influence of school engagement on school performance.

Discussion
The study of school engagement is becoming increasingly relevant for educational psychology researchers, because it is considered an antecedent to positive outcomes in the academic sphere (Chase, Hilliard, Geldhof, Warren, & Lerner, Reference Chase, Hilliard, Geldhof, Warren and Lerner2014). Given a recent proliferation of definitions of school engagement, and instruments to measure and evaluate it, we recommend reaching a consensus about its meaning (Reschly & Christenson, Reference Reschly, Christenson, Christenson, Reschly, Wylie, Christenson, Reschly and Wylie2012) and what instruments should be used to measure it (Garret, Reference Garrett2011). The three-dimensional model of school engagement is currently the most widely accepted (Veiga et al., Reference Veiga, Burden, Appleton, Taveira and Galvão2014), so determining whether the underlying structure of the Spanish SEM (Fredricks et al., Reference Fredricks, Blumenfeld, Friedel, Paris, Moore and Lippman2005) had three dimensions was pending. That would make it consistent with the three-dimensional framework (cognitive, emotional, behavioral) most accepted today. This study delivered such empirical confirmation, conducting confirmatory factor analysis and variability analysis, examining the questionnaire’s different types of validity, and utilizing the variable school performance to establish concurrent validity.
Analyses confirmed three first-order factors. However, for the questionnaire to function the most optimally, we recommend eliminating three items, which would leave the Spanish-language version of the SEM (Appendix 1) with three items less than the original. In that case, the behavioral dimension would still adequately capture the positive school-focused practices described by Fredricks et al. (Reference Fredricks, Blumenfeld and Paris2004). The item that describes the presence of disruptive behaviors (me meto en problemas en el centro educativo [I get in trouble at school]) would be eliminated. By the same token, the emotional factor would continue to capture the student’s sense of connection with school (Appleton, Christenson, Kim, & Reschly, Reference Appleton, Christenson, Kim and Reschly2006; Finn, Reference Finn1989; Voelk, Reference Voelkl, Christenson, Reschly and Wylie2012) and positive emotions toward school (Glanville & Widhagen, Reference Glanville and Wildhagen2007; Marks, Reference Marks2000; Yazzie-Mintz, Reference Yazzie-Mintz2007) without the item referring to his or her sense of boredom at school. Last, omitting the item Si no entiendo lo que leo, vuelvo atrás y lo leo de nuevo [If I don’t understand what I read, I go back and read it over again] did not affect the cognitive dimension, because flexible problem-solving and personal effort, as described by Fredricks et al. (Reference Fredricks, Blumenfeld and Paris2004), are tapped by another similar item (Si no sé lo que significa una palabra cuando leo, hago algo para averiguarlo [If I don’t know what a word means when I am reading, I do something to figure it out]). After making the adjustments needed, leaving out those items did not seem to alter the internal structure of school engagement, and scores on the Spanish version of the SEM showed high reliability and adequate discriminant and construct validity. Thus, it can be said that the instrument is a good measure of school engagement. With that in mind, the most suitable explanation for school engagement is that it is the result of an interaction between three independent factors: behavioral, emotional, and cognitive engagement.
Regarding differences in school engagement as a function of ESO cycle (years 1–3 vs. 4), our data confirmed what was anticipated: scores dropped significantly with age, which the very authors of the SEM reported as well (Fredricks et al., Reference Fredricks, Blumenfeld, Friedel, Paris, Moore and Lippman2005). This corroborated earlier research findings that school engagement declines as the student advances through school (Wylie & Hodgen, Reference Wylie, Hodgen, Christenson, Reschly, Wylie, Christenson, Reschly and Wylie2012). This drop in engagement level among secondary students could be related to the changing influence of peer groups (Li, Lynch, Kalvin, Liu, & Lerner, Reference Li, Lynch, Kalvin, Liu and Lerner2011). Future studies should address perceived support from peers given the decisive importance of friend relationships during the adolescent years. As far as concurrent validity, we confirmed that school engagement significantly influenced school performance. Those results are consistent with previous research findings supporting a connection between a student’s school engagement and his or her performance (Green et al., Reference Green, Liem, Martin, Colmar, Marsh and McInerney2012; Rumberger & Rotermund, Reference Rumberger, Rotermund, Christenson, Reschly, Wylie, Christenson, Reschly and Wylie2012). By the same token, student engagement with school may have played an especially important role in the successful academic outcomes observed in this study, so it is important to develop psychoeducational interventions geared toward promoting the student’s sense of belonging and identification with school. Of course these findings that there is variability as a function of different variables support the SEMS’s reliability and validity; the data were to be expected from a theoretical standpoint.
Finally, our results suggest the potential value of the three-dimensional model of school engagement in the educational context. Specifically, the educational implications derived from this study highlight the importance of promoting adjustment at school by means of an education that addresses the emotional, cognitive, and behavioral aspects of school engagement. What is more, we suggest that emotional reactions to the school environment precede behavior and attainment of desirable outcomes at school, including subjective perception that one is a good student, enjoying schoolwork, and getting good grades. Generally speaking, our conclusions have bearing on professional practice, specifically to optimizing psychological intervention programs in the educational sphere.
In closing, a limitation of this study that deserves mention is the possibility that the results presented here will vary. Validating the SEM cannot yet be considered a closed debate; as long as the questionnaire is subject to empirical testing in different, more specific sectors of the population, goodness of fit and the composition of its factors will likely vary. Future research should test the model’s stability in different samples (for instance, at different levels of education) to establish invariance in the school engagement model.
The authors of this study are part of the Consolidated Research Group IT701–13 of the Basque University System. The study was carried out as part of the research project EHUA 15/15 at the University of the Basque Country (UPV-EHU).