Implications
In dairy systems, many farmers tend to secure the protein supply with ‘over supplementation’ to maximise milk production per cow, leading to higher feed costs and N excretion. In a context of volatile input–output prices (Insee, 2015), together with a societal demand to reduce environmental impacts, more efficient feeding strategies are required. This study shows that better nitrogen use efficiency can be achieved for dairy cattle fed with low amounts of degradable protein, leading to reduced impacts on the environment, with a modest reduction in milk protein in the short term.
Introduction
In Europe, animal production has been, and still is, encouraged to become more productive (public policy measures such as tariffs and export subsidies) in order to meet a growing consumer demand: for example, the demand for meat and milk in 2050 is projected to grow by 73% and 58%, respectively, compared with 2010 (FAO, 2011). Intensive systems are often characterised by high inputs of nitrogen, which are mostly excreted. This is not without consequence for global environmental and health issues related to the emission of greenhouse gases (GHG) and other pollutants like ammonia (NH3; European Environment Agency, 2009, Gerber et al., Reference Gerber, Steinfeld, Henderson, Mottet, Opio, Dijkman, Falcucci and Tempio2013).
Dairy cattle consume high amounts of soya bean meal (Institut de l’élevage, 2011), mainly imported from South-America and other parts of the world (Peyraud et al., Reference Petersen, Blanchard, Chadwick, Del Prado, Edouard, Mosquera and Sommer2012), known to be associated with land use change and concomitant GHG emissions (Gerber et al., Reference Gerber, Steinfeld, Henderson, Mottet, Opio, Dijkman, Falcucci and Tempio2013, Pellerin et al., Reference Pellerin, Bamière, Angers, Béline, Benoît, Butault, Chenu, Colnenne-David, De Cara, Delame, Doreau, Dupraz, Faverdin, Garcia-Launay, Hassouna, Hénault, Jeuffroy, Klumpp, Metay, Moran, Recous, Samson, Savini and Pardon2013). Generally <30% of the N intake is retained in the produced milk, and the remainder is typically excreted roughly equally between faeces and urine (Castillo et al., Reference Castillo, Kebreab, Beever and France2000, Calsamiglia et al., Reference Calsamiglia, Ferret, Reynolds, Kristensen and van Vuuren2010). In urine, nitrogen is principally found in the form of urea, which is rapidly hydrolysed to ammonium (NH4 +) by urease enzymes present in faeces and soil. This ammonium may then volatilise in the form of ammonia depending on temperature and air velocity. Alternatively, it may be oxidised into nitrites and nitrates through a two-step nitrification process, leading to emissions of intermediate compounds such as nitric oxides (NOx) and nitrous oxide (N2O; Petersen et al., Reference Peyraud, Cellier, Donnars and Réchauchère2013). Reducing nitrogen excretion hence appears critical to reduce environmental impacts.
Lowering the amount of nitrogen consumed by the animals generally results in a higher proportion of N exported to milk and decreased N excretion (Castillo et al., Reference Castillo, Kebreab, Beever and France2000, Kebreab et al., Reference Kebreab, France, Beever and Castillo2001). In the INRA feeding system, the metabolisable protein (PDIE, protein digested in the small intestine when rumen-fermentable energy is limiting; INRA, 2007) is used to calculate animal protein balance, assuming an efficiency of 64% to transform PDIE into milk protein. Moreover, the requirements in terms of degradable nitrogen for microbial protein in the rumen are considered to be fulfilled when PDIN (protein digested in the small intestine when rumen-fermentable nitrogen is limiting; INRA, 2007) equals or exceeds PDIE concentration in the diet. Two strategies could then be used to reduce N excretion: 1/improve protein use efficiency by decreasing metabolisable protein supplies in relation to energy from the diet (PDIE/UFL, milk feed unit, 1 UFL=7.106 MJ of net energy for lactation; INRA, 2007); 2/favour urea reuse by a deficit in degradable protein in the diet ((PDIN–PDIE)/UFL). A decline of PDIE intake was shown to reduce milk yield (Cantalapiedra-Hijar et al., Reference Cantalapiedra-Hijar, Peyraud, Lemosquet, Molina-Alcaide, Boudra, Noziere and Ortigues-Marty2014) and milk protein concentration (Monteils et al., Reference Monteils, Jurjanz, Blanchart and Laurent2002) with a curvilinear response (Vérité and Delaby, Reference Vérité and Delaby2000). On the other hand, reducing PDIN available for microbes stimulates urea reuse for microbial synthesis (Reynolds and Kristensen, Reference Reynolds and Kristensen2008), resulting in lower N excreted in urine without affecting protein synthesis and animal performance (Cutullic et al., Reference Cutullic, Delaby, Edouard and Faverdin2013), but with a risk of decreasing microbial activity. Moreover, a lower amount of highly degradable protein in the diet has been shown to modify the partition of N excreted between urine and faeces, likely due to more efficiently captured N in the rumen (Kebreab et al., Reference Kebreab, France, Beever and Castillo2001).
The reduction of urinary N excretion should result in lower amounts of urea in manure likely to volatilise in the form of ammonia (Dijkstra et al., Reference Dijkstra, Oenema, van Groenigen, Spek, van Vuuren and Bannink2013). Moreover, transformation from ammonium to nitrate via nitrification is a source of N2O (Chadwick et al., Reference Chadwick, Sommer, Thorman, Fangueiro, Cardenas, Amon and Misselbrook2011); a variation of ammonium in manure could therefore influence, even if marginally, N2O emissions at the building level. Finally, methane (CH4) emissions from animal housing are mainly caused by enteric fermentation, sensitive to rate of organic matter (OM) degradability, type of VFA produced and efficiency of microbial synthesis (Monteny et al., Reference Monteny, Smits, van Duinkerken, Mollenhorst and de Boer2006). A reduction in N content of grass due to low N fertilisation was also predicted to increase enteric CH4 emissions, through modification of rumen degradation characteristics and associated changes in the carbohydrate composition and degradability of the feed (Bannink et al., Reference Bannink, Smits, Kebreab, Mills, Ellis, Klop, France and Dijkstra2010). The potential benefit from lowering dietary nitrogen supplies in terms of ammonia and nitrous oxide emissions could therefore be counter-balanced by increased methane emissions.
This study therefore explores the effect of lowering PDIN supplies from a theoretical excess to a theoretical deficiency, while maintaining PDIE, on dairy cows’ N use efficiency and performance as well as gas emissions (NH3, N20, CH4) at barn level. From current knowledge in the literature, we hypothesised that, due to a high possibility of urea reuse for microbial synthesis in lactating dairy cows, a deficit in PDIN supply in the diet will 1/induce higher N use efficiency without detrimental consequences on animal performance (dry matter intake (DMI) and digestibility, milk production and composition, etc.); 2/decrease N excretion, especially in urine, resulting in lower urinary urea content as well as lower ammonia and nitrous oxide emissions from manure. With the will to avoid pollution swapping, methane emissions were also monitored to ensure that the modulation of the diet composition was not associated with higher methane production at barn level.
Material and methods
The experiment was conducted at the INRA experimental farm of Méjusseaume near Rennes, France, from September to October 2008.
Treatments, animals, experimental rooms and experimental design
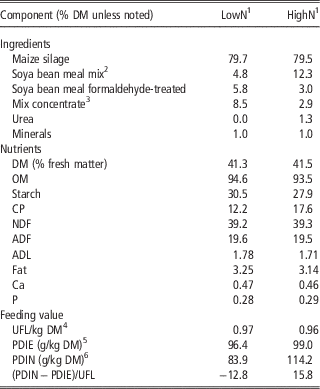
Treatments consisted of total mixed rations offering either low (LowN; CP: 12% DM, 84 g PDIN/kgDM) or high (HighN; CP: 18% DM, 114 g PDIN/kgDM) dietary degradable nitrogen. The rations were composed of a 80 : 20 mixture of maize silage : concentrate and were given ad libitum (constant access to the trough; refusal maintained between 0.05 and 0.10 of feed offered) and individually twice a day (≈0800 and 1800 h). Diets were formulated to provide similar PDIE concentrations (96 and 99 g PDIE/kg DM for LowN and HighN, respectively), but with degradable N either in deficit or in excess (PDIN/PDIE of 0.87 and 1.15 for the LowN and HighN, respectively; INRA, 2007). Diet compositions are given in Table 1. Six Holstein dairy cows in late lactation (221±32 days in milk) were used for the experiment (mean live weight=617±13 kg). All were in their second or later lactation and were not pregnant. Three of them were fitted with a rumen cannula; fistulated and non-fistulated cows were kept apart throughout the experiment to account for potential gas losses through the cannula. Each group was housed in a mechanically ventilated and hermetic experimental room (temperature ≈18°C ) with negative air-pressure so as to ensure unique and constant air extraction through the extraction duct. Air renewal was achieved by the controlled air-conditioning system. The two rooms were equipped with tied stalls and mattresses covered with sawdust (except during urine and faeces collection), which were renewed daily. The cows had continuous access to water and were milked on site twice a day.
Ingredients and nutrient composition of the two experimental diets varying in CP concentration fed to lactating dairy cows

1 LowN and HighN diets correspond to 12% and 18% of CP, respectively.
2 Soya bean meal mix composed of 98% soya bean meal and 2% of molasses.
3 Mix concentrate is composed of 25% wheat, 25% maize, 25% barley, 20% beet pulp, 3% molasses, 1% vegetable oil and 1% NaCl.
4 UFL: Amount of net energy for milk production contained in 1 kg of a reference barley (87% of dry matter, 2700 kcal of metabolisable energy), based on INRA feeding system (INRA, 2007).
5 PDIE: true protein absorbable in the small intestine when rumen-fermentable energy is limiting in the rumen based on INRA feeding system (INRA, 2007).
6 PDIN: true protein absorbable in the small intestine when rumen-fermentable nitrogen is limiting in the rumen based on INRA feeding system (INRA, 2007).
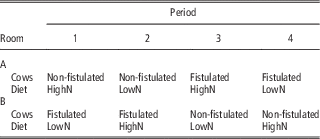
The experiment followed a split-plot design with two groups of cows (fistulated and non-fistulated cows), two treatments (LowN and HighN), and two experimental rooms (A and B) during four periods of 2 weeks (Table 2). All the cows received the two diets and were housed successively and conversely in the two experimental rooms to account for possible biases due to ventilation systems. For each period of 2 weeks, the first 4 days were used to accustom the cows to their diet; animal performances (DM intake, milk yield and composition) were measured from days 5 to 14. From days 8 to 11, urine and faeces were totally collected to estimate diet digestibility and N excretion. Gaseous measurements were continuously taken from days 5 to 14 so as to compare periods with and without manure collection. The cows were weighed at the beginning and the end of the experiment.
Description of the split-plot experimental design (LowN and HighN diets correspond to 12% and 18% of CP, respectively)

Measurements and analyses
Feed sampling and intake
Offered and refused feed was weighed precisely and sampled every day to determine DM concentration (80°C, 48 h) in order to assess individual cow DM intake. From days 8 to 11 of each period, samples of feed were collected daily: concentrate was dried (80°C during 48 h), maize silage (offered and refused) was freeze dried. Average samples of concentrate and maize silage per period, and per cow for refusals, were then ground with a three-blade knife mill through a 0.8 mm screen. The OM concentration was determined by ashing for 6 h at 500°C. Total N concentration was assessed by the Dumas method (Association Française de Normalisation, 1997). Feed and refusals ADF, NDF and ADL were analysed using the method described by van-Soest et al. (Reference van-Soest, Robertson and Lewis1991), using a neutral detergent solution containing α-amylase without sulphite, on a Fibersac analyzer (Ankom Technology, Fairport, NY, USA), and were corrected for ash concentration. Water intake was recorded individually every day by monitoring mechanical water meters. Dietary PDIE and PDIN concentrations were calculated from the diet ingredients’ chemical composition (Table 1), and predicted rumen degradability of CP and intestinal digestibility of rumen undegraded CP diet (INRA, 2007).
On day 10 of each period, rumen liquor was collected from fistulated cows at 0800 h (just before the morning ration distribution) and again at 0900, 1000, 1100, 1200, 1400, 1600 and 1800 h (just before evening ration distribution) to assess pH kinetics. Samples were then frozen to determine N-NH4 + concentrations later (Berthelot colour reaction method).
Milk yield and composition
Individual milk yield was monitored each day throughout the experiment. Morning and evening milk samples were collected three times a week (each Monday, Wednesday and Friday) to analyze for true protein and fat via infrared analysis using a Milkoscan 605 (Foss Electric, Hillerød, Denmark). An additional fresh milk sample was collected in the morning and evening of day 10 of each period to assess individual milk total N (Kjeldahl method).
Digestibility, faeces and urine
Digestibility ([intake–faecal output]/intake) was estimated from days 8 to 11 for each period. Faeces were collected individually in the gutter behind the animals, and were weighed daily. Animals were equipped with harnesses to collect urine separately. Urine was acidified with 500 ml of H2SO4 20% to prevent ammonia volatilisation and weighed daily. Samples were collected every day for each cow, and average samples were frozen every week in order to analyse faecal DM, OM, and total-N (Dumas method; Association Française de Normalisation, 1997). Urea-N was assessed in urine using colorimetric enzymatic reaction with a multi-parameter analyser (KONE Instruments 200 Corporation, Espoo, Finland).
Uraemia
In order to depict urea variations in relation to the diet, uraemia was assessed just before and 3 h after the morning ration distribution. Even if urea concentrations in blood and milk are correlated when measured at short time intervals (Gustafsson and Reference Gustafsson and PalmquistPalmquist, Reference Gustafsson and Palmquist1993), blood was preferred to milk as it was easier to sample at both times. Blood samples were collected from the tail vein once per period (day 10) at 0800 h and at 1100 h to assess plasmatic uraemia (KONE Instruments 200 Corporation).
Gas emissions measurements
Air samples were continuously collected in each isolated room at air entrance and air extraction ducts so as to calculate a gradient. Measurements of gas concentrations were performed on the last 10 days of each period, therefore including periods with and without urine and faeces collection. An infra-red photo acoustic analyser (INNOVA model 1312, Air Tech Instruments, Ballerup, Denmark) was used coupled with a sampler-doser (INNOVA 1303). Air samples were withdrawn from the experimental rooms into the analyser through 3 mm PTFE (Teflon®, Em-Technik, France) sampling lines protected with dust filters, insulated and heated to avoid water condensation within the sampling tubes. The analyser was fitted with six filters, enabling the concentrations of six gases (NH3, CO2, CH4, N2O, SF6 and H2O) to be sequentially measured. The analyser sampled air with a 2-min interval between measurements, each location being analysed during 15 min, and a computer was used to record concentrations. The instrument was span-calibrated with known concentrations by the manufacturer before the experiment. The instrument internally corrected for signal interferences from gases measured (optical filters/detection limit: NH3 973/0.2 ppm; CO2 982/1.5 ppm; CH4 969/0.4 ppm; N2O 985/0.03 ppm). However, for NH3, non-compensated interferences were detected by unexpected variations in gas concentration (two important peaks in NH3 concentrations associated with feeding phases). As was recently highlighted by Hassouna et al. (Reference Hassouna, Robin, Charpiot, Edouard and Méda2013) under the same experimental conditions, these NH3 oscillations were due to interferences with ethanol and acetic acid emitted by mixed rations (maize silage in particular). We noticed that 6 h after the meal distribution the quantity of feed remaining in the trough was close to the quantity of refusals (0.05 to 0.10 of feed offered); from that time, interference was probably negligible. NH3 emission measurements were therefore only considered between 1200 and 0700 h and between 1400 and 1700 h. The flow rate in each experimental room was determined with the tracer ratio method using the constant dosing approach (Baptista et al., Reference Baptista, Bailey, Randall and Meneses1999). Sulphur hexafluoride (SF6) was continuously injected through PTFE sampling lines directly in the air entrance duct equipped with a mixing system to homogenise air and SF6. The amount of SF6 released at each time step was determined by the sampler-doser (INNOVA 1303). Ventilation rate (Q, in m3/h per cow) was calculated as a function of time (t) from the rate of tracer release (φT) in m3/h and the indoor tracer concentration (CT inside) in mg/m3 after correction for the background concentration of the tracer (CT outside) (Demmers et al., Reference Demmers, Phillips, Short, Burgess, Hoxey and Wathes2001):
 $$Q(t){\,=\,}{{\varphi T{\rm (}t{\rm )}} \over {{\rm CT}\,{\rm inside}(t){\minus}{\rm CT}\,{\rm outside}(t)}}$$
Indoor (ambient) and outdoor (air entrance) temperature and moisture were monitored using thermo-hygrometers while collecting air samples. Temperature, moisture, flow rates and gas concentrations were expressed as mean values per h. Gas emissions were calculated by multiplying the ventilation rate (m3/h per cow) by gas concentrations (air extraction concentrations corrected by air entrance concentrations, in mg/m3). Methane and nitrous oxide emissions were expressed as cumulated gas emissions per cow per day; ammonia emissions per cow were averaged at the hourly rate for the periods of the day when interferences were expected to be negligible (i.e. between 1200 and 0700 h and between 1400 and 1700 h).
Statistical analyses
For each period, only the last 10 days were considered for measurements, as the first 4 days were used to adapt the animals to experimental conditions. For animal performance and N balance variables, data were averaged per period for each individual (n=24) in order to overcome the temporal correlation between daily measurements. Statistics were performed using the linear procedure of SAS 9.4 (PROC GLM; SAS Enterprise Guide v6.1 2013, SAS Institute Inc., Cary, NC, USA) following the statistical model below:
 $$\eqalign{ Y_{{ijklm}} {\,=\,}{\rm }\mu &{\rm }{\plus}{\rm }Nconc_{i} {\plus}{\rm }Room_{j} {\plus}{\rm }Period_{k} {\plus}{\rm }Group_{l} \cr& {\plus}{\rm }Cow(Group)_{{m(l)}} {\plus}{\rm }e_{{ijklm}} $$
where Y ijklm is the studied variable; μ the average; Nconc i the diet degradable N concentration (LowN or HighN, 1 df); Room j the experimental room housing the cows (A or B, 1 df); Period k the period of 2 weeks (1 to 4, 3 df); Group l the group of cows (fistulated cows v. normal cows, 1 df); Cow(Group) m(l) the cow nested in the group of cows (4 df); and e ijklm the error associated with each Y ijklm . In order to account for the split-plot design, the factor Group l was specifically tested against the Cow(Group) m(l) error.
Hourly (NH3) and daily gas emissions (N2O, CH4, CH4/kg DMI) were averaged per experimental room and per period, identifying excreta (urine+faeces) collection and no-collection periods (n=16), and compared using the linear procedure of SAS 9.4 (PROC GLM; SAS Enterprise Guide v6.1 2013, SAS Institute Inc., Cary, NC, USA) following the statistical model below:
 $$\eqalign{ Y_{{ijklmn}} {\,=\,}&\mu {\rm {\plus}}Nconc_{i} {\plus}Collection_{j} {\plus}Room_{k} {\plus}Period_{l} \cr&{\plus}Group_{m} {\plus}{\rm (}Nconc{\times}Collection{\rm )}_{n} {\plus}e_{{ijklmn}} $$
where Y ijklmn is the studied variable; μ the average; Nconc i the diet degradable N concentration (LowN or HighN, 1 df); Collection j the excreta collection status (yes or no, 1 df); Room k the experimental room housing the cows (A or B, 1 df); Period l the period of 2 weeks (1 to 4, 3 df); Group m the group of cows (fistulated or not, 1 df); and e ijklmn the error associated with each Y ijklmn .
Because of confounding effects, the interactions Nconc×Room and Nconc×Group could not be tested in either model.
Results and discussion
Maintained animal performances and improved N use efficiency
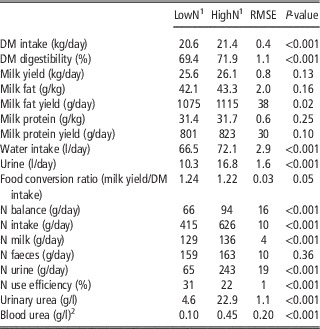
Compared with the HighN diet, animals that were fed low amounts of degradable N ingested 0.8 kg DM/day less (P<0.001) with a 2.5% reduction in DM digestibility (P<0.001; Table 3); however, during the 8 weeks of experimentation, all the cows gained weight (+14±5 kg). Nitrogen excreted in milk was 5% lower (P<0.001), but milk protein secretion was only 3% lower (P=0.10; Table 3), the difference probably being due to non-protein nitrogen content, higher in the HighN diet. Neither milk yield (P=0.13) nor milk composition (P=0.16 and P=0.23 for fat and protein concentration, respectively) were significantly affected by N supply; only milk fat yield was reduced on the LowN diet (difference of 40 g/day, P=0.02; Table 3). These results corroborate those of Cutullic et al. (Reference Cutullic, Delaby, Edouard and Faverdin2013) where a reduction of degradable protein supply in the diet (−10 g (PDIN−PDIE)/UFL; 12% CP) did not significantly affect milk yield and protein milk yield for dairy cows compared with a balanced diet (PIDE=PDIN). When both PDIN and PDIE supplies are reduced, the decrease in milk and milk protein yields is generally more important, (e.g. −2 kg/day and −13% to 18% nitrogen in milk; Monteils et al., Reference Monteils, Jurjanz, Blanchart and Laurent2002; Cantalapiedra-Hijar et al., Reference Cantalapiedra-Hijar, Peyraud, Lemosquet, Molina-Alcaide, Boudra, Noziere and Ortigues-Marty2014). In the present study, PDIE concentrations of the diets were deliberately maintained equivalent between treatments even if a small reduction in PDIE supply came from the decrease in DM intake. A deficit of PDIE (under the threshold of 100 g PDIE/UFL) is known to rapidly lead to important drops in performance (Vérité and Delaby, Reference Vérité and Delaby2000). Moreover, in order to obtain an optimal microbial protein synthesis and a satisfying diet digestibility, microbes need a minimal and balanced amount of fermentable energy and degradable protein in the rumen. Dairy cattle can tolerate a deficit of PDIN (down to (PDIN–PDIE)/UFL=−8 g/unit UFL for low milk production; INRA, 2007) as microbes in the rumen are able to use a certain amount of NH4 +-N recycled in the form of urea. On the other hand, the excess of PDIN for the HighN diet ((PDIN–PDIE)/UFL=15 g/unit UFL) resulted in higher amounts of nitrogen excreted compared with the LowN diet, especially in urine (P<0.001, Table 3). As cattle consumed much less nitrogen in the low N diet (−33%) and exported quite similar quantities of nitrogen in milk (−5%), they achieved considerably improved N use efficiency (from 22% to 31%; P<0.001), which is consistent with the literature (Huhtanen and Hristov, Reference Huhtanen and Hristov2009). Moreover, as both milk protein concentration and yield were not significantly affected by the diet (P>0.05, Table 3), it seemed that the animals were able to achieve a better use of nutrients with a lower amount of feed ingested, as illustrated by the food conversion ratio that tended to be higher for the LowN diet (1.24 v. 1.22, P=0.05, Table 3). This could represent a certain economy for farmers and act as compensation for the slight loss in milk production (Frank and Swensson, Reference Frank and Swensson2002). For example, changing the diet from 16% to 14% CP by replacing soya bean meal and urea by grains was estimated to bring a benefit of 12 €/cow per year, provided balanced supplies of PDIN and PDIE were maintained (taking into account milk yield and milk protein concentration reductions in winter; Pellerin et al., Reference Pellerin, Bamière, Angers, Béline, Benoît, Butault, Chenu, Colnenne-David, De Cara, Delame, Doreau, Dupraz, Faverdin, Garcia-Launay, Hassouna, Hénault, Jeuffroy, Klumpp, Metay, Moran, Recous, Samson, Savini and Pardon2013). The recent inflation of nitrogen-rich feed prices (Insee, 2015) should encourage farmers to promote low degradable N diets, even more so if it results in improved protein self-sufficiency on these farms (Pellerin et al., Reference Pellerin, Bamière, Angers, Béline, Benoît, Butault, Chenu, Colnenne-David, De Cara, Delame, Doreau, Dupraz, Faverdin, Garcia-Launay, Hassouna, Hénault, Jeuffroy, Klumpp, Metay, Moran, Recous, Samson, Savini and Pardon2013).
Influence of diet degradable N concentration on components of animal production, milk composition and nitrogen balance in late-lactating cows over the last 10 days of experimentation (least square mean, probability and root mean squared error of the model; n=24)

1 LowN and HighN diets correspond to 12% and 18% of CP, respectively.
2 Mean of two samples (before and 3 h after the morning ration distribution).
Partitioning of nitrogen excretion and consequences for ammonia emissions
As expected, nitrogen excreted in urine was substantially decreased with the LowN diet (P<0.001), representing as little as 30% of the total N excreted in manure (urine+faeces) v. 60% for the HighN diet. On the other hand, the amount of N excreted in faeces was not significantly modified (P=0.36, Table 3). This observation is consistent with the literature for diets varying in CP concentration (Castillo et al., Reference Castillo, Kebreab, Beever and France2000; Monteils et al., Reference Monteils, Jurjanz, Blanchart and Laurent2002; Cantalapiedra-Hijar et al., Reference Cantalapiedra-Hijar, Peyraud, Lemosquet, Molina-Alcaide, Boudra, Noziere and Ortigues-Marty2014). As already mentionned by Kebreab et al. (Reference Kebreab, France, Beever and Castillo2001), the proportion of N excreted in faeces in relation to N intake increased (from 26% to 38%) when animals were fed diets with lower amounts of highly degradable protein.
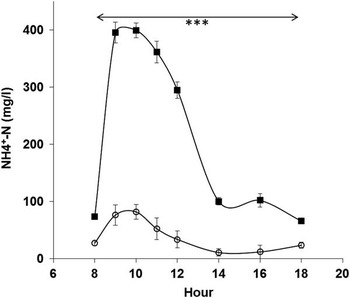
Ruminal kinetics showed a peak of NH4 +-N in rumen liquor after the morning ration distribution. Ruminal NH4 +-N concentration was four times higher for the HighN diet at 0900 h (76 and 396 mg/l for the LowN and the HighN diets, respectively, P<0.001, RMSE=44; Figure 1) and stayed more elevated throughout the day (P<0.001). Despite this peak, ruminal pH was not significantly affected by treatment, either before or after the meal (P>0.05). Urinary and blood urea concentrations were considerably lower for the LowN diet (P<0.001, Table 3) leading to a large drop in urinary urea excretion (47 v. 385 g/day for the LowN and HighN diets, respectively, P<0.001). The clearance rate of urea (volume of blood cleared per unit of time) can be calculated as the ratio between urinary urea excretion (g/day) and blood urea concentration (g/l). In the present study, the clearance rate of urea was almost twice as high for the HighN diet (36 l/h) as it was for the LowN diet (20 l/h). These values are consistent with recent studies reporting that urea clearance was reduced from 41 to 27 l/h when the diet CP concentration of lactating cows decreased from 17% to 13% DM (Kristensen et al., Reference Kristensen, Storm and Larsen2010) and from 35 to 25 l/h for decreasing urea ruminal infusions (Rojen et al., Reference Rojen, Theil and Kristensen2011). The large drop in urinary urea excretion for the LowN diet was moreover accompanied by an important decrease in terms of the proportion of urea N in urine (34% of total urinary N) compared with the HighN diet (76% of total urinary N). Nitrogen deficiency in the LowN diet therefore led to nitrogen saving in the kidney (Rojen et al., Reference Rojen, Theil and Kristensen2011). As discussed by Kohn et al. (Reference Kohn, Dinneen and Russek-Cohen2005), keeping urea in the blood may enable herbivores to recycle greater amounts of N in the gut compared with omnivores, which explains how herbivores can survive on low amounts of low-quality protein.
Ruminal liquor NH4 +-N concentration (mg/l) in late-lactating cows fed two diets (open circles for the LowN diet at 12% CP; full squares for the HighN diet at 18% CP); statistical differences between diets are indicated: ***P<0.001.

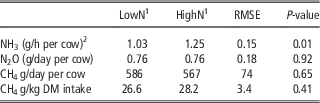
As expected, hourly NH3 emissions were significantly decreased on the LowN diet compared with the HighN diet (1.03 and 1.25 g NH3/h per cow, respectively, P=0.01; Table 4). The 18% reduction does not seem very important given the large reduction in urine volumes (1.5 times lower, P<0.001) and urinary urea concentration (divided by 5, P<0.001) for the LowN diet v. the HighN diet and when compared with the literature. In controlled conditions, ammonia emission from manure (measured in flux chambers) was, for example, three times lower when dietary CP decreased from 21% to 15% (Burgos et al., Reference Burgos, Embertson, Zhao, Mitloehner, DePeters and Fadel2010). At the dairy barn level, based on a large range of diets, ammonia emissions were predicted to be reduced by 80% with a grass-based diet with balanced amounts of rumen degradable protein (Monteny et al., Reference Monteny, Bannink and Chadwick2002). However, as reported by Powell et al. (Reference Powell, Broderick and Misselbrook2008), ammonia emissions from tie-stall dairy barns, where narrow gutter scrapers remove manure once or twice a day, are usually lower than from free-stall barns where the emitting surface is much larger. In the present study, the small reduction in ammonia emissions could therefore be viewed as the result of the interaction between diet and a low emitting housing system. On the other hand, the non-reduced ammonia emissions when excreta were collected and acidified either as a single factor (P=0.44, n=16) or in interaction with the N concentration of the diet (P=0.12, n=16) are surprising. However, the calculation of mean hourly emissions excluding feeding periods – because of interferences – could limit these interpretations.
Influence of diet degradable N concentration on ammonia and greenhouse gas emissions in late-lactating cows housed in tied stall barns (least square mean, probability and root mean squared error of the model; n=16)

1 LowN and HighN diets correspond to 12% and 18% of CP, respectively.
2 Ammonia emission measurements were only considered during periods of the day when interferences were expected to be negligible (i.e. between 1200 and 0700 h and between 0200 and 0500 h), and were averaged at an hourly scale.
Significant N losses proportional to N inputs
Unaccounted N (not recovered either in manure or in milk) was 66 and 94 gN/day per cow for the LowN and the HighN diets, respectively, representing around 15% of N intake for both treatments. These proportions are high but not unexpected when compared with the literature. As pointed out by Cheng et al. (Reference Cheng, Kim, Merry and Dewhurst2011), the nitrogen balance technique is difficult to implement and often leads to overestimations of N retention. In a meta-analysis, Spanghero and Kowalski (Reference Spanghero and Kowalski1997) recorded an average N balance of 39 g/day (ranging from −57 to 205 g/day), representing 8% of N intake and 1/3 of N contained in milk. More recently, Klevenhusen et al. (Reference Klevenhusen, Kreuzer and Soliva2010) reported N balances of up to 26% of N intake (maize diet, 21% CP), and even if the average value reported in the review of Spek et al. (Reference Spek, Dijkstra, van Duinkerken, Hendriks and Bannink2013) is only 2% of N intake (for EU trials), the high standard deviation of 31 (n=68) suggests high variations. In the present study, considering that the cows were adult and non-pregnant, N retention could only be linked to N accretion related to the energy balance of the animals. Calculations of the animals’ energy balance (based on UFL intake, mean BW and fat-corrected milk yields as described in INRA, 2007) for each treatment, using the value of 6 g N retained per UFL reported by Faverdin and Vérité (Reference Faverdin and Vérité1998), make it possible to estimate N retention in cows of 19 and 20 g N/day per cow, respectively, for the LowN and the HighN diets. Nitrogen balances corrected for N retention were therefore 47 and 74 gN/day per cow, representing about 11% of N intake. Consequently, a significant part of N ingested was probably lost during the recovery process or because of errors associated with the measurement of N concentrations in the various samples. Volatile N losses during urine collection should be prevented by the addition of a strong acid (here H2SO4 20%). In contrast, underestimation of faecal N by incomplete collection of material or volatile losses of ammonia during collection and subsequent drying of the samples could be important (e.g. −15% N in faecal samples after drying compared with fresh faeces; Spanghero and Kowalski, Reference Spanghero and Kowalski1997). Echoing the words of Reynolds and Kristensen (Reference Reynolds and Kristensen2008), mysteries of N balance still need to be solved today.
Consequences of N dietary manipulation for GHG emissions
The dietary treatment did not affect N2O (P=0.92) and CH4 emissions either expressed in g/day or in g/kg DM intake (P=0.65 and P=0.41, respectively; Table 4). We could not identify any group effect (fistulated cows v. normal cows) in measured emissions of any of the gases concerned, suggesting that losses through the cannula could not be detected, even for methane.
Urinary N is the principal source of N2O emissions (Dijkstra et al., Reference Dijkstra, Oenema, van Groenigen, Spek, van Vuuren and Bannink2013). In this experiment, urine and faeces were deposited on small areas (gutters) and stayed for short periods in the house before being scraped twice daily. Consequently, N2O emissions were very low (daily averages between 0.07 and 1.86 mg/m3) and variations were difficult to detect for the photo acoustic IR gas analyser (detection limit of 0.05 mg/m3).
Methane emissions at room level measured in this paper are rather high (>550 g CH4/day and >26 g CH4/kg DMI) when compared with the literature (19 to 22 g CH4/kg DMI for grass and maize silage diets varying in CP concentration measured in respiratory chambers, Reynolds et al., Reference Reynolds, Mills, Crompton, Givens and Bannink2010b). In the present study, we cannot exclude that part, even if marginal, of the methane at room level was produced by manure. Moreover, gaseous emissions result from the product between gas concentrations and the ventilation rate in the experimental room, both being associated with high uncertainties (about 30% for the estimation of gas emissions from livestock; Scholtens et al., Reference Scholtens, Dore, Jones, Lee and Phillips2004). Biases being most likely the same for both treatments, they should not affect the major conclusions of this study.
Bannink et al. (Reference Bannink, Smits, Kebreab, Mills, Ellis, Klop, France and Dijkstra2010) reported that both observed and predicted enteric CH4 emissions decreased with an increased dietary N : OM ratio, even if, as discussed by the authors, variations in DMI may have affected these results. However, in the literature, most papers were not able to link either the amount of total or digestible protein consumed, nor N fertilisation levels to methane emissions (Reynolds et al., Reference Reynolds, Crompton, Mills, Humphries, Kirton, Relling, Misselbrook, Chadwick and Givens2010a; Podesta et al., Reference Podesta, Hatew, Klop, Van Laar, Kinley, Bannink and Dijkstra2013), which would be consistent with our results that dietary N modulation did not affect CH4 emissions.
More generally, efforts to mitigate an emission can sometimes lead to higher emissions of other pollutants, or of the same pollutant at a different stage; this is referred to as pollution swapping (Monteny et al., Reference Monteny, Smits, van Duinkerken, Mollenhorst and de Boer2006). Reduced gas formation at animal or manure level in the barn might be partially compensated by increased gaseous emissions from manure in the following step of manure management (Dijkstra et al., Reference Dijkstra, Oenema and Bannink2011). In the future, more attention should be given to GHG and ammonia mitigation options at farm level to account for effects on C and/or N flows and associated gas emissions, considering all possible interactions at every stage of the manure management continuum (Petersen et al., Reference Peyraud, Cellier, Donnars and Réchauchère2013).
Conclusion
In the literature, most of the papers show that with <14% CP in the diet, animal performance is severely reduced. This study demonstrates that dairy cattle can tolerate, at least for periods of 2 weeks, important deficits of degradable protein supply in maize-based diets (down to 84 gPDIN/kgDM, 12% CP) without an important drop in performances if metabolisable protein is maintained close to the threshold of 100 g PDIE/UFL. The LowN diet might have favoured urea reuse for microbial synthesis, compensating the deficit in degradable N in the rumen for milk protein production. Excess intake of degradable nitrogen on the HighN diet (114 g PDIN/kgDM, 18% CP) involved, on the contrary, higher uraemia, resulting from greater ruminal NH3 production by microbes. This additional N was then lost in the form of urea through urine, leading to increased NH3 emissions. Offering low amounts of degradable protein to cattle can therefore generate a win–win situation. On one hand, low supplies of degradable N contributed to higher N use efficiency, at least on the short term, with a limited reduction of performance that could be compensated by lower amounts of feed ingested (potential economic gain). On the other hand, impacts on the environment could be reduced via lower ammonia emissions (acidification, eutrophication, human health, etc.). This strategy would, however, need to be validated for longer periods of time, other housing systems (e.g. free stall barns) and at farm level, including all stages of the manure management continuum.
Acknowledgements
The authors would like to thank the staff from the INRA unit PEGASE both at the dairy experimental farm for taking care of the animals and taking the measurements, and at the laboratory for their lab analyses. Many thanks also to Luc Delaby for precious advice on statistics and to anonymous reviewers for their helpful comments on earlier versions of the manuscript.